This is an author-deposited version published in:
http://oatao.univ-toulouse.fr/
Eprints ID: 13796
To link to this article: DOI: 10.1371/journal.pone.0121279
URL:
http://dx.doi.org/10.1371/journal.pone.0121279
To cite this version:
Gateau, Thibault and Durantin, Gautier and
Scannella, Sebastien and Lancelot, François and Dehais, Frederic
Real-Time State Estimation in a Flight Simulator Using fNIRS. (2015) PLOS
ONE, vol. 10 (n° 3). pp. 1-19. ISSN 1932-6203
O
pen
A
rchive
T
oulouse
A
rchive
O
uverte (
OATAO
)
OATAO is an open access repository that collects the work of Toulouse researchers and
makes it freely available over the web where possible.
Any correspondence concerning this service should be sent to the repository
administrator:
[email protected]
Real-Time State Estimation in a Flight
Simulator Using fNIRS
Thibault Gateau*‡, Gautier Durantin‡, Francois Lancelot‡, Sebastien Scannella‡,
Frederic Dehais‡
ISAE (Institut supérieur de l’aéronautique et de l’espace), Toulouse, France ‡All authors contributed equally to this work.
Abstract
Working memory is a key executive function for flying an aircraft. This function is particularly critical when pilots have to recall series of air traffic control instructions. However, working memory limitations may jeopardize flight safety. Since the functional near-infrared spectros-copy (fNIRS) method seems promising for assessing working memory load, our objective is to implement an on-line fNIRS-based inference system that integrates two complementary estimators. The first estimator is a real-time state estimation MACD-based algorithm dedi-cated to identifying the pilot’s instantaneous mental state (not-on-task vs. on-task). It does not require a calibration process to perform its estimation. The second estimator is an on-line SVM-based classifier that is able to discriminate task difficulty (low working memory loadvs. high working memory load). These two estimators were tested with 19 pilots who were placed in a realistic flight simulator and were asked to recall air traffic control instruc-tions. We found that the estimated pilot’s mental state matched significantly better than chance with the pilot’s real state (62% global accuracy, 58% specificity, and 72% sensitivi-ty). The second estimator, dedicated to assessing single trial working memory loads, led to 80% classification accuracy, 72% specificity, and 89% sensitivity. These two estimators es-tablish reusable blocks for further fNIRS-based passive brain computer
interface development.
Introduction
Piloting is a complex activity that takes place in a rapidly changing and uncertain environment. Working memory (WM) is a key executive function for handling the flight, maintaining an up-to-date situation awareness, adapting the flight plan [1,2] and interacting with ground control [3]. This latter activity, following air traffic control (ATC) instructions, is known to particularly solicit WM as it requires memorization of critical flight information (e.g. heading, altitude, speed) and the input of these parameters into the flight deck. However, human WM is funda-mentally limited [4,5]. Many studies have revealed that several factors such as message length [6,7] and complexity [8,9] affect the pilot’s memory capacity necessary for following ATC in-structions, as well as their ability to execute commands. One has to consider that the erroneous
execution of the ATC clearances may considerably jeopardize flight safety [10], thus prompting the need for enhanced pilot-system interaction.
A promising way to mitigate these human limitations is to consider the implementation of
an adaptive system such as a “passive” brain-computer interface (BCI) [11]. “Passive” BCIs are
not meant to directly control a device (e.g. a mouse) via brain activity but to support “implicit interaction”. Research on “passive” BCIs provides interesting insight as they aim to infer the human operator’s cognitive state and then adapt the nature of the interactions to overcome cognitive bottlenecks [12,13] such as WM limitations.
Defining a brain imaging technique to estimate WM load level in an operational context could be considered as the first step required for the development of such an inference system. Functional near-infrared spectroscopy (fNIRS) is an optical brain imaging method that mea-sures cortical hemodynamic response. fNIRS provides good spatial localization compared to
EEG, on the order of 1cm2, and can be easily integrated with EEG/ERPs [14–16]. Moreover,
fNIRS has shown to be correlated with functional magnetic resonance imaging (fMRI) studies [17]. This device is suited for both laboratory and field experiments in flight simulators [18,19]
and has been successfully used to detect WM solicitation [20–24]. Despite these numerous
ad-vantages, this technique has been less explored than EEG by the BCI community [11] mainly
because slow hemodynamic response prevents real-time interaction with an apparatus [25].
However, fNIRS has been proven to be a suitable technique for BCI purposes [26–30] although
most of the demonstrations were achieved in an off-line manner (e.g. [31–34]; for a literature review see [35,36]). Some on-line BCI have been implemented [25,37–43] and the processing of fNIRS data in real-time to provide good classification accuracy remains a challenge (e.g. [35,
44]).
Indeed, the on-line extraction of relevant features from the raw fNIRS signal is still a critical
issue [45] and new techniques need to be developed to reduce noise and to improve the
usabili-ty of the data [46,47]. Several studies [48,49] have revealed that the Moving Average Conver-gence DiverConver-gence (MACD) filter is a promising processing technique. Relying on the principle of the Exponential Moving Average (EMA) filter, the MACD filter performs efficient fNIRS signal detrending and eliminates the low-frequency drifts and high-frequency physiological and measurement noise from the raw fNIRS signal. It also compares favorably to classical filter-ing techniques, especially in terms of filter order, and it allows stimulus onset detection without requiring the use of machine learning techniques [50].
Another issue of deriving cognitive activity from the fNIRS signal is related to the selection of the most appropriate features used to discriminate different individuals’ states. Many met-rics have been proposed, such as the change in oxyhemoglobin or deoxyhemoglobin concentra-tions, the difference/sum/ratio of oxyhemoglobin and deoxyhemoglobin amplitudes, time-to-peak, and so forth, but there is still a lack of consensus (for a review of metrics see [51]). In any case, accounting for inter-individual variability is challenging as long as hemodynamics latency and recording sites may differ across participants [52,53]. To that end, Tai and Chau [54] have proposed to adopt a machine learning approach that considers both spatial (i.e. recording sites) and temporal features (i.e. time windows). In their paper, the authors processed 208 can-didate features such as the mean, kurtosis, skewness, variance, zero crossings, percentages of total energy, and root mean squared of the oxygenated and deoxygenated hemoglobin concen-trations for each site through different time windows. This approach provide excellent accuracy off-line, as well as a method for decoding single on-line trials [43].
The aim of this study was to design an on-line fNIRS-based inference system dedicated to: 1. estimating the pilot’s state (performing or not performing a WM task);
To this end, we designed a simplified but plausible pilot-ATC interaction task, using prerecord-ed messages. The implementation of this inference system was challenging as our participants were placed in an immersive flight simulator (i.e. user interfaces, panoramic external “view”) that induces additional cognitive activity (i.e. flight trajectory monitoring), as well as motion artifacts (i.e. programming autopilot device) therefore adding noise to the fNIRS signal.
To meet these goals, we measured changes in the oxygenation of the prefrontal cortex
in-cluding the dorsolateral prefrontal cortex (DLPFC) which is known to be involved in WM [18,
22]. Real-time pilot’s state estimation was performed using MACD as proposed in economic
market analysis [55] and did not require machine learning techniques. We implemented an
on-line single trial classifier [43,54] to discriminate low WM load achieved trials versus high WM load achieved trials.
Methods
1 Participants
Nineteen visual flight rules (VFR) pilots (6 women; mean group age: 27.4 ± 6.4; mean flight hours 145 ±45) completed the experiment. Pilots had normal or corrected-to-normal vision, normal hearing, and no psychiatric disorders. They all had medical clearance to fly. After pro-viding written informed consent, they were instructed to complete task training. Typical total duration of a subject’s session (informed consent approval, practice task, and real task) was about two hours. This work was approved by the Inserm Committee of Ethics Evaluation (Comité d’Evaluation Ethique de l’Inserm—CEEI/IRB00003888).
2 Equipment
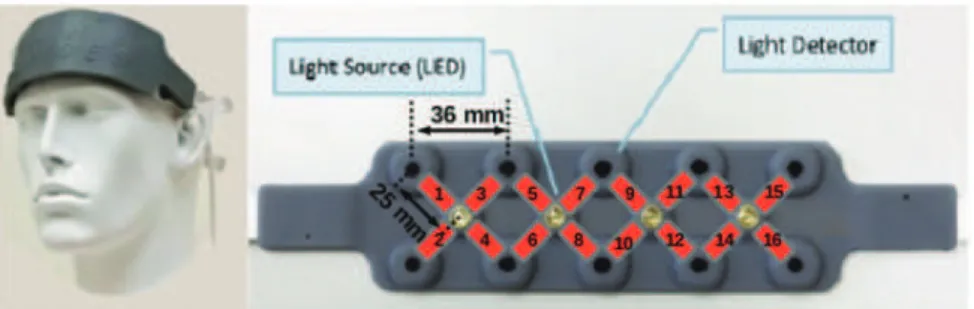
2.1 fNIRS Equipment. During each experiment, we recorded hemodynamics of the
pre-frontal cortex using the functional near-infrared spectrometer fNIR100 (Biopac1
) equipped
with 16 channels (Fig. 1). On this continuous-wave system, the optode separation was about 25
mm and two wavelengths were used, 730 nm and 850 nm.
Each channel of the device records hemodynamics at a frequency of 2Hz in term of oxygen-ation level varioxygen-ations in comparison to a baseline. Changes in the concentroxygen-ations of oxygenated
(Δ[HbO2]) and deoxygenated hemoglobin (Δ[hHb]) can be calculated from changes in detected
light intensity using the modified Beer-Lambert Law [56].
Cognitive Optical Brain Imaging (COBI) Studio1software [57,58] was used to collect data.
The data stream was available on-line from a TCP/IP interface. Before recording, signals for
Fig 1. fNIR1001headband and associated channels numbering.
Only the four closest detectors to an emitter constituted channels. The emitter-detector distance is 25 mm. Channels are represented in red with their associated number. The original image comes from the fNIRSOFT1manual and has been
each channel was carefully checked for saturation with COBI Studio which provides signal quality visual representation.
COBI studio was also used to check signal quality and to adjust consequently the headband on the participant’s forehead. Channels 8 and 10, located above the nasal sinus were systemati-cally removed because of saturation [59].
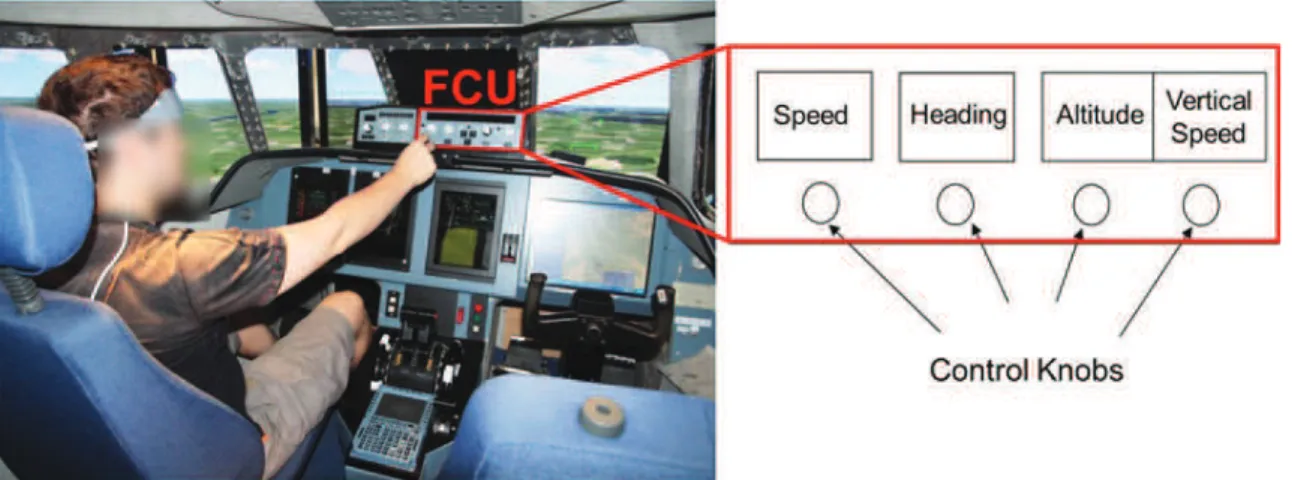
2.2 Flight Simulator. We used the ISAE (Institut Supérieur de l’Aéronautique et de
l’Espace—French Aeronautical University in Toulouse, France) flight simulator to conduct the experiment in an ecological situation. It simulates a twin-engine aircraft flight model and the user interface is composed of a Primary Flight Display (PFD), a Navigation Display, and an upper Electronic Central Aircraft Monitoring Display page. The pilot has a Flight Control Unit (FCU) to interact with the autopilot (Fig. 2).
3 Protocol
3.1 Task Description. Similar to true flying circumstances, pilots heard ATC messages
(pre-recorded for this experiment) and were asked to dial the corresponding flight parameters in the autoflight system using the four knobs (i.e. speed, heading, altitude, and vertical speed)
of the FCU. The ATC messages were delivered at 78 dB through a Sennheiser1
headset. Two levels of difficulty were defined based on the flight parameters that the participant had to set during the experiment:
• Low WM load: only one major digit per trial was used to set each flight parameter (e.g: 15 for “speed 150, heading 150, altitude 1500, vertical speed +1500”).
• High WM load: each flight parameter value was different from the previous one and com-posed of different digits to increase the complexity (e.g: “speed 164, heading 235, altitude 8700, vertical speed -1600”).
The task consisted of 20 repetitions of each difficulty for a total of 40 trials. The task difficul-ty order was randomly distributed with two constraints:
• the first 20 trials contained 10 trials of high difficulty, and 10 trials of low difficulty (which is necessary for machine learning purposes, see 3.3);
• the difficulty cannot be the same for more than two successive trials.
Fig 2. Pilot’s interaction with the FCU.The participants controlled the flight simulator from the pilot’s seat. The red rectangle corresponds to the FCU used to set the autopilot with four control knobs, according to ATC clearances (speed, heading, altitude, and vertical speed selection).
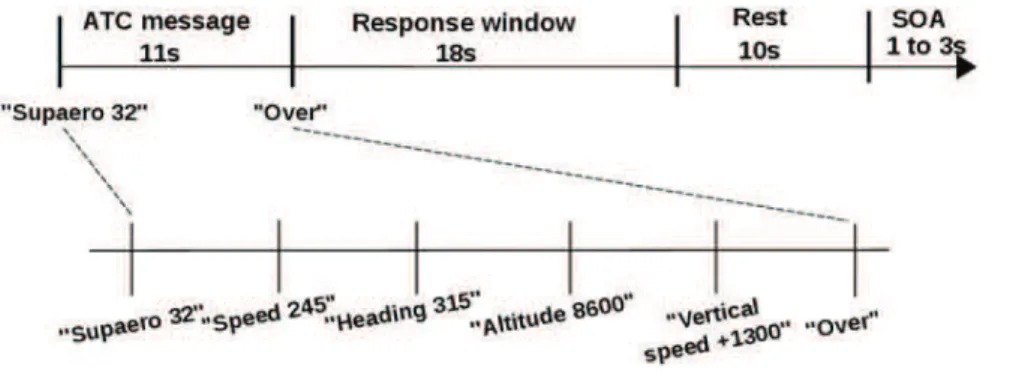
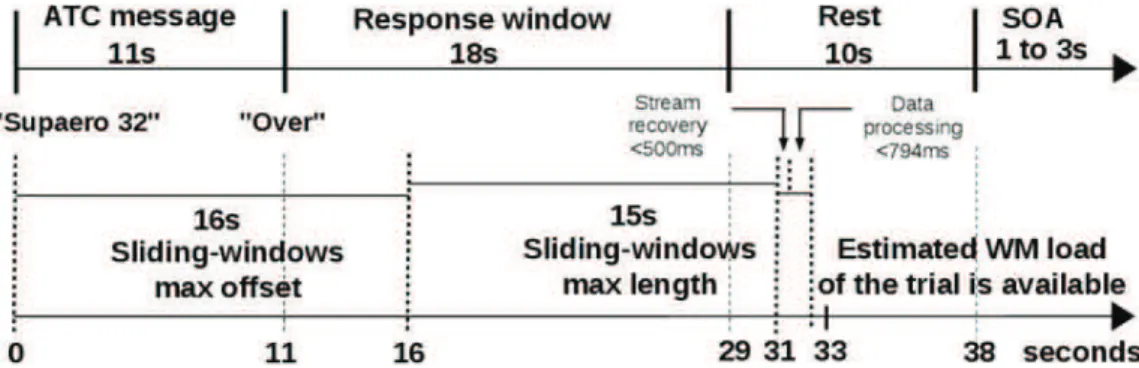
Each ATC message started with the airplane call sign (i.e. “Supaero 32”), immediately fol-lowed by a sequence of flight parameters and ended with the message “over”. Pilots were in-structed to set the parameters only after they heard the “over” message (Fig. 3). Thereafter, pilots had to dial the parameters on the autopilot interface during a 18 s response window. A practice session was conducted prior to the experiment runs to familiarize them with the exper-iment protocol and the interface.
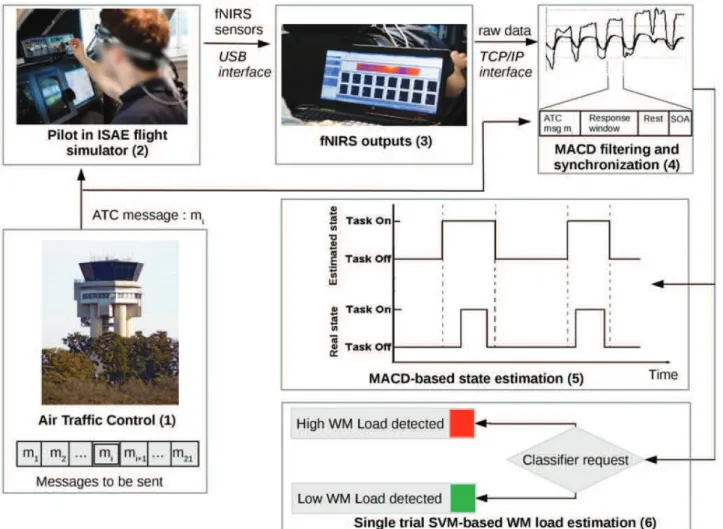
3.2 Experimental Components’ Architecture. We implemented a WM load estimator that integrated different components (Fig. 4):
• a simulated ATC which broadcasts a list of chosen messages to the pilot;
• the ISAE flight simulator which allows a pilot to be in an ecological flight condition (cf. sec-tion 2.2);
• a fNIR100 sensor which measures the prefrontal oxygenation on 16 channels (cf. section 2.1);
• a MACD filter for artifact removal (cf. section 4.1);
• a synchronization module that also formats filtered data for the classification process: filtered fNIRS output must be synchronized with the pilot’s state, according to the instant of the ar-rival of that incoming message and according to the pilot’s response window;
• a state estimator (cf. section 4.2) which evaluates pilot’s instantaneous current state in real-time, which can be not-on-task or on-task. The pilot is considered on-task during ATC mes-sage reception, and not-on-task in the other periods.
• a classifier (cf. section 4.3) which evaluates in real-time whether the last ATC instruction was a high WM load trial or a low WM load trial.
Task monitoring, data acquisition and computation were conducted on the same computer (core i5-3210M, 2.50GHz, 4GB RAM).
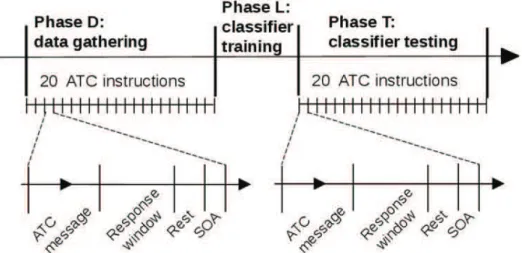
3.3 Experimental Time Course. For machine learning purposes (cf. section 4.3), the
ex-periment was split into three successive phases (Fig. 5):
• Phase D—data gathering phase: 20 instructions with two levels of difficulty were successively presented to the pilot in a random order. During phase D, the correctness of the pilot’s re-sponse was also checked for further pilot performance analysis. Entered FCU parameters were available through the ISAE flight simulator software. The fNIRS’s data were processed Fig 3. ATC span task trial design.
and recorded for each trial’s response window. The levels of difficulty of the message were also recorded.
• Phase L—classifier training phase: the classifier training process was activated, based on the data gathered during phase D. This phase was not perceived by the pilot (cf. section 3.2) and allowed further classification actions. At the end of this phase, the pilot’s classifier—the pi-lot’s specific classification model, correctly trained—was available for classification requests. • Phase T—classifier testing phase: 20 instructions with random levels of difficulty (high WM
load or low WM load) were successively presented. The aim of the classification process was to discriminate the difficulty of the trial, as soon as possible (cf. section 3.2). After each re-sponse window of trials, the classifier returned WM load estimation of the trial.
The transition from phase D to phase T was transparent to the participants.
Fig 4. Illustration of the fNIRS based inference system.Pre-recorded ATC messages were sent to the pilot (1). The pilot’s prefrontal activity was measured with a fNIRS device (2). Output measures (3) were MACD-filtered and synchronized with the temporal design of the trial (4). During the entire session, the MACD-based state estimator detected whether the pilot’s state was not-on-task or on-task (5). When all of the required data were available for the trial, a request was sent to the pilot’s classifier to assess the WM load of the trial (6).
4 Data Analysis
4.1 MACD Filter. Raw fNIRS data were real-time filtered using a MACD filter, commonly
used in economic market analysis [55]. This filter, based on the difference between a short-term EMA and a long-short-term EMA, implements a second order band-pass filtering to eliminate low-frequency (< 0.02Hz) and high-frequency (> 0.33Hz) components from the raw fNIRS signal [48]. This low order filter has a quasi linear phase in its bandwith and is particularly suit-ed for real-time applications. For the experiment, we procesuit-edsuit-ed to an on-line filtering of Δ
[HbO2] and Δ[hHb] on 14 of the 16 channels (Channels 8 and 10 were excluded due to several
artifact acquisition issues), as described inEquation 1, where N represents the number of time
points defining the EMA window:
y ¼ EMANðxÞ , yn¼
2
N þ 1xnþ
N & 1 N þ 1yn&1
MACDNshort;NlongðxÞ ¼ EMANshortðxÞ & EMANlongðxÞ
ð1Þ
We chose a 6 s short-term EMA (Nshort= 12) and a 13 s long-term EMA (Nlong= 26),
ac-cording to previous work [50] for MACD filtering, to get the desired bandwidth.
4.2 MACD-based State Estimation. We performed MACD analysis to estimate the
par-ticipant’s instantaneous mental state, on-task versus not-on-task, in real-time. In economic market analysis, Appel [55] states that a sustainable increase in the signal can be predicted when the MACD line crosses the signal from below. On the contrary, a sustainable decrease in the signal can be predicted when the MACD line crosses the signal line from above. This
meth-od can help estimate task-onsets and task-offsets based on the fNIRS signal [50]. We computed
in real-time a state estimation chronogram by associating the moments when the MACD line crossed the signal line from below with stimuli onsets. To do this, we averaged MACD-filtered fNIRS data over the 14 channels. A signal line was computed using a 5 s EMA (N = 10) of this data, as described inEquation 2:
SignalðxÞ ¼ EMA10ðMACDðxÞÞ ð2Þ
Fig 5. The experiment was split into three successive phases.Data gathering (phase D) and classifier testing (phase T) consisted of 20 ATC instructions each. The pilot’s classifier was trained between these two phases (phase L). The time scale of the figure is illustrative.
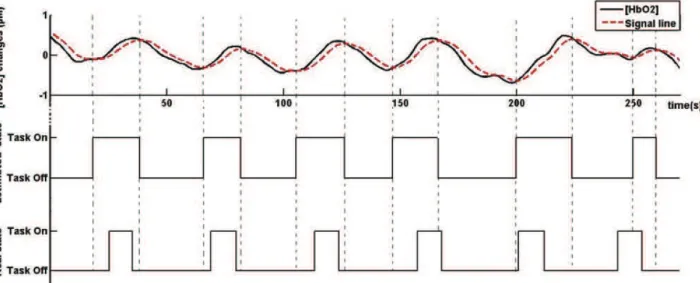
Similarly, we defined task-offsets when the MACD line crossed the signal line from above
(for an example, seeFig. 6). We then compared each time point of the state estimation
chrono-gram to the actual task-onsets chronochrono-gram in order to estimate the accuracy of this method. We labeled the state estimation at time t as:
• Correct Estimation, if the estimated state and the actual task state matched; • False Positive, if the state was estimated as on-task, and actual state was not-on-task; • False Negative, if the state was estimated as not-on-task, and actual state was on-task;
4.3 Single Trial SVM-based WM Load Estimation. The classification’s goal was to
dis-criminate on-line whether the last trial was a high WM load trial or a low WM load trial. For each pilot, we used the first 20 trials to train the pilot’s classifier (phase D and L, see section 3.3). From trial 21 to 40, we used the pilot’s classifier to discriminate trial difficulty, without any further training. An accuracy score of the pilot’s classifier was provided at the end of the experimental session.
Δ[HbO2] and Δ[hHb] signals were segmented into trials, in real-time, according to the task
synchronization module (cf. section 3.2). Trial data were filtered and all the features described below were computed as soon as the fNIRS data were available.
We used a sliding-window on the trial data set to take into account the pilot’s personal
he-modynamic response characteristics [52,53]. A sliding-window was defined by:
• an offset (first time value of the sliding-window); • a time interval (length of the sliding-window).
Fourteen prefrontal areas (all channels, except 8 and 10) corresponding to the channels
with sufficient signal reliability were monitored (in terms of HbO2and hHb concentrations,
rel-ative to a baseline) with our fNIRS system (cf. section 2.1).
Fig 6. Example of real-time state estimation (performed on pilot 16).The upper graph shows MACD-filtered fNIRS signal and the signal line computed from the latter (dashed line). The two lower graphs show the participant’s state estimated from crossovers between MACD and signal lines and the operator’s actual state, respectively.
From the Δ[HbO2] and Δ[hHb] signals, four time-domain features were calculated. For the
sake of simplicity, Δ[HbO2]tand Δ[hHb]tcorrespond to relative concentration of HbO2and
hHb respectively during trial t, filtered with the MACD filter (cf. section 4.1), averaged during a specified time period.
We defined $AD½HbO2(t(resp. $AD½hHb(t), the mean amplitude response of the considered
sliding-window of Δ[HbO2]t(resp. Δ[hHb]t), on trial t, as the mean value within a specified time
win-dow of the trial, reported to a 2 s average pre-trial onset value, to take into account potential drift on fNIRS signal.
We used the following as features:
• mean Δ[HbO2]tand mean Δ[hHb]ton each voxel during the sliding-window of trial t;
•A$D½HbO
2(tand $
AD½hHb(
ton each voxel during the sliding-window of trial t;
• Δ[HbO2]tand Δ[hHb]tkurtosis (“peakedness” of the probability distribution) on each voxel
during the sliding-window of trial t;
• Δ[HbO2]tand Δ[hHb]tskewness (asymmetry of the probability distribution) on each voxel
during the sliding-window of trial t;
Sliding-window parameters were chosen according to previous findings concerning ex-pected hemodynamic response [52,53] and best classifiers features characteristics defined by Tail et. al [54]. Therefore, we defined sliding-window length according to three values (5s, 10s, 15s), and to seven different offsets (10s, 11s, 12s, 13s, 14s, 15s, 16s). These variations provided 168 predictors (3×7 sliding-windows, 8 features) for each channel. Then, on each trial, 2352 predictors were provided. Two classes had to be discriminated, high WM load trials and low WM load trials. As our number of features was large compared to the training sample, we used
a linear Support Vector Machine (SVM) [60]. The principle of the SVM is to find the
separat-ing hyperplane that maximizes the distance between the hyperplane and the closest trainseparat-ing points in each class. To avoid over-fitting, we chose to customize the SVM regularization pa-rameter for each pilot’s classifier. In a linear SVM, the regularization papa-rameter C controls the trade-off between errors of the SVM on training data and margin maximization. During the training process of each participant, the parameter C is incrementally changed over a large
range of values (from 10−5to 10). For each value, a cross validation step was performed and the
parameter with the highest performance was chosen. The classifier was trained using a cross-validation (5-fold, 10-time) on the first 20 trials with the caret R packages [61]. The classifier training (phase L) was performed as soon as the data of the first 20 trials were available.
4.4 Behavioral and Offline fNIRS Data. We performed classical off-line behavioral
analy-sis to ensure that we correctly manipulated WM load (i.e. increased error rates in high WM load condition) and that the participants’ performance was identical across the two blocks (i.e. identical error rate during the first 20 trials and the last 20 trials). A two-way Analysis of Vari-ance (ANOVA) was carried out on the correct response rate between subject factors Phase (Learning vs. Test) and Position (Speed vs. Heading vs. Altitude vs. Vertical speed). An off-line analysis on the neurophysiological data to verify the consistency of prefrontal activation with
existing neuroimaging literature was performed. To do so, we computed the frontal [HbO2]
and [hHb] peak response (peak value within 30s post-trial onset minus 2s average pre-trial onset) for each trial and each pilot using the MACD-filtered data. We then performed a
three-way ANOVA using within subject factors Oxygenation (HbO2vs. hHb), WM Load (High vs.
Low) and Voxels (1 vs. 2. . . vs. 16), excluding voxels 8 and 10 due to several acquisition artifact issues. Tukey’s HSD post-hoc tests were used to evaluate all behavioral and hemodynamic interaction effects.
Results
1 Behavioral and Physiological Results
The participants committed a mean of 13.2 errors (SD = 4.7) during the entire experiment, all occurring during the high load trials. All the subjects completed the low WM load trials cor-rectly. There was no significant effect of the phase (learning or testing) on the number of committed errors.
The ANOVA over the fNIRS data revealed a main effect of the oxygenation (F(1, 18) = 95.2; p < 0.001; partial η2= 0.90) with higher [HbO2] than [hHb] and a main effect of the load (F(1,
18) = 7.3; p < 0.05; partial η2= 0.29) corresponding to higher peak response within the high load condition. In addition, a significant interaction effect between load and oxygenation was found (F(1, 18) = 28.7; p < 0.001; partial η2= 0.61) showing that the load effect was only pres-ent for [HbO2] (p < 0.001). Finally, a second order interaction effect revealed that the load
ef-fect was not homogeneous across voxels (F(13, 221) = 2.87; p < 0.001; partial η2= 0.14).
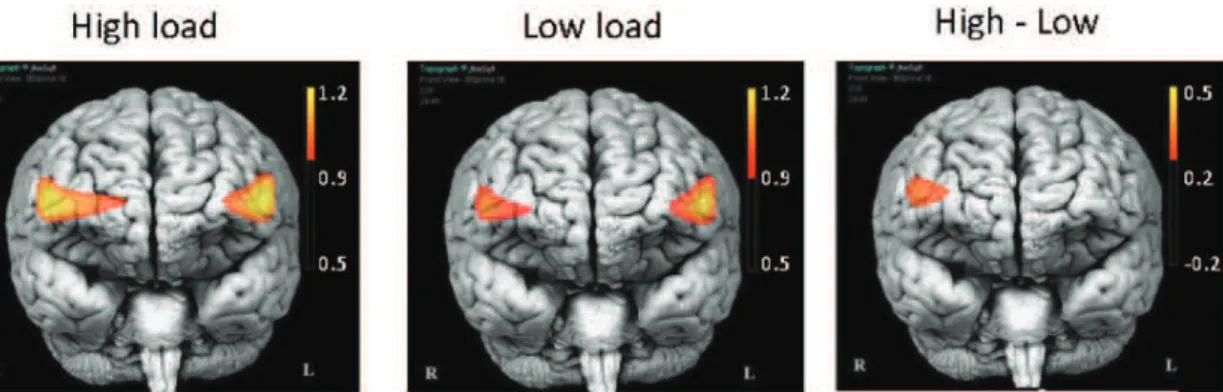
Post-hoc tests revealed a maximum load effect within the right DLPFC (i.e, voxel 15; seeFig. 7for
il-lustration) for[HbO2].
2 MACD-based State Estimation Results
2.1 Accuracy. The real-time estimated state was compared to the actual state of the subject
during the experiment (not-on-task or on-task). The results show that the estimation matched 61.74% of the time (SD = 4.27%), which was significantly better than chance (F(1, 18) = 145.52;
p < 0.01) (Fig. 6). We obtained a 58.24% mean specificity (SD = 3.80%), and a 71.88% mean
sensitivity(SD = 9.34%).
2.2 Latencies. The required time for data filtering (maximum per sample < 0.4 ms) is
neg-ligible regarding fNIRS time resolution (2Hz). Hence, pilot’s state estimation (not-on-task or on-task) is available in real-time.
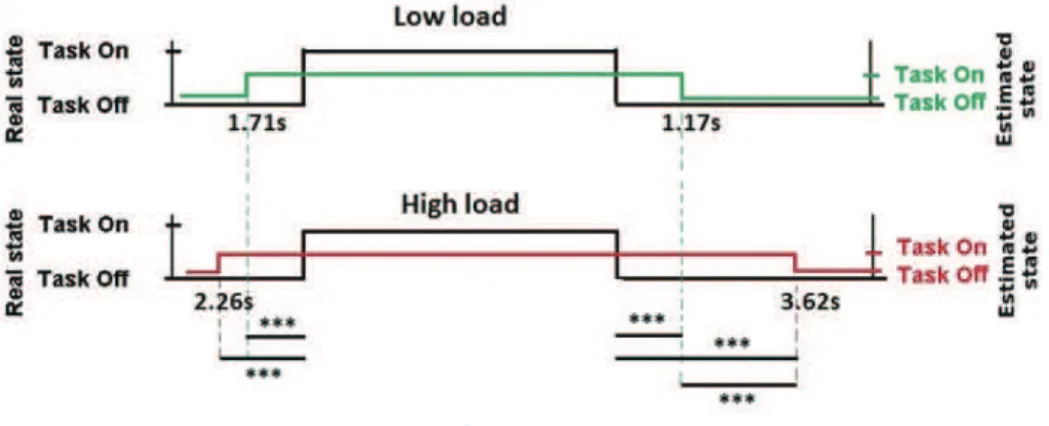
2.3 Off-line Analysis. The results of estimated onsets and offsets latencies compared to
stimuli onsets and offsets are summarized inFig. 8. On average, the onset of state estimation significantly occurred 1.97s before the actual state onset (SE = 0.34s). The estimated offset oc-curred 2.43s after the stimulus offset (SE = 0.52s).
The difficulty of the current trial had no effect on the onset estimation latency (p = 0.15). Concerning the offset estimation latency, the offset estimations occurred significantly later for Fig 7. Activation maps according to the level of difficulty.Units are in μmol.l−1. Both high and low load conditions elicit bilateral DLPFC activities. The
high load minus low load subtraction map (High—Low) shows significantly greater activation of the right DLPFC. Activations shown 14 s post-stimulus onset. p <0.001. fNIRSOFT1
high load trials (Mean = 3.62s; SE = 0.66s) than for low WM load ones (Mean = 1.17s; SE = 0.59s) (F(1, 18) = 12.3; p < 0.01).
3 Single trial SVM-based WM Load Estimation Results
3.1 Accuracy. During the testing phase, a mean of 80.8% (SD = 10.6%) of the trials were
accurately classified (discriminated into on-line low WM load trials and high WM load trials). We obtained a 72.11% mean specificity (SD = 19.89%), and a 89.47% mean sensitivity (SD = 15.72%). Individual classifiers’ accuracies are shown inFig. 9.
3.2 Latencies. After phase D was completed, the classifier training script was run
concur-rently with the 21sttrial achievement. This process took a maximum of 42.15s. In the worst
case, it can delay the 21sttrial WM load estimation result.
During classifier’s training (phase T), a request to the classifier and its associated response took a maximum of 770ms. This request can be sent as soon as the trial’s filtered data set is available. In fact, due to the machine learning design (cf. section 4.3), all the trial data set re-quired for a request to the pilot’s classifier is constrained by the maximum sliding-window off-set (16s) and the maximum sliding-window length of 15s (Fig. 10). Therefore, the trial data set is theoretically available 2s after the pilot’s response window. The required time for data filter-ing and formattfilter-ing is negligible regardfilter-ing fNIRS time resolution (2Hz), even for a full trial data set (maximum < 24 ms of computing time on a complet trial data set). However, the classifier’s process takes 770ms in the worst case to return an estimated WM load for the trial. The pilot’s estimated WM load is then available less than 3.3s after his response windows.
Discussion
The objective of this study was to implement on-line tools to infer pilots’ cognitive activity
[62]. We focused on the monitoring of WM as this executive function is highly solicited when
operating aircraft [1,2]. The design of such an inference system was challenging as, until now, only three studies involving on-line fNIRS-based state inference systems in an ecological con-text [39–41] have been conducted. However, these studies did not include realistic simulators but simplified PC-based simulations. In order to test our inference system, an experimental protocol was designed, during which the pilots had to interact with ATC instructions of two levels of difficulty. The behavioral results confirmed that these levels were contrasted, as Fig 8. Off-line estimated onset and offset latencies compared to the stimuli onset, in low WM load and high WM load conditions.Average for 20 trials per difficulty, on 19 pilots’ results. ***: p<0.001.
participants performed less well during the higher difficulty level. This result is coherent with
Taylor et al. [9] which has shown that pilots’ WM decline when four different instructions
have to be stored and recalled. The neurophysiological results also confirmed that the task diffi-culty statistically modulated oxygenation level in the prefrontal cortex (PFC). Moreover, the to-pographic maps (Fig. 7) revealed particular activations of the right and left dorsolateral PFC (DLPFC; BA 9 and 46) that are seen as mediating monitoring, i.e., executive control in the Bad-deley’s model of WM [63]. Indeed, these results, in accordance with previous findings [20–24], confirmed that fNIRS is a suitable device for monitoring WM load level.
Fig 10. Trial timeline and computing latencies.The upper timeline shows ATC span task trial events duration (seeFig. 3). Bottom timeline illustrates duration constraints to get pilot’s estimated WM load: classifier’s response is available in the worst case less than 3.3s after pilot’s response window.
1 MACD-based State Estimation
One novelty of this study was the use of a MACD filter as a systematic state estimator to detect the pilot’s state (doing or not doing a WM task) [50]. The results were promising as the MACD-based state estimation matched 62% of time with the real duration of on-task and not-on-task activity, i.e. receiving (memorizing) or not the ATC instruction (Fig. 6), with a good true positive rate (72%). The differences observed were explainable by the presence of 42% false positive rate, when the pilot’s state was estimated as on-task and the stimulus’s state was not-on-task. Our off-line analysis revealed that, on average, the on-task estimated periods
started before and ended after the stimulation periods (Fig. 8). Furthermore, the delay between
stimulus onset and state estimation offset was significantly higher during the high WM load trials than during the low WM load ones, suggesting a potential different way of dissociating workload levels. According to our definitions of the real and the estimated states, it is of a great importance to consider that the estimated pilot’s WM load could not perfectly fit to the real state as ATC messages are physical stimuli and pilot’s state is the ATC brain-related activity that necessarly extends beyond physical stimuli. To this extent, the latencies observed could be imputable to the anticipation of stimuli onset due to task rhythmicity and the maintenance in
WM of ATC instructions, two functions that have neural substrates in the PFC [64].
Altogeth-er, these results are consistent with previous studies proving the potential of fNIRS for idle mode detection [26,47]. In fact, fNIRS offers an insight into the brain’s reaction to stimuli, giv-ing information on perceived workload that would not be available through behavioral mea-sures (e.g. stimulation periods). The results also confirmed that MACD is an effective method for real-time task onsets detection [50], requiring no a priori information on task onsets, few computational resources, and no calibration. This result is key for ecological tasks, when onsets timing are unknown. For example, in realistic situations when events happen randomly, the in-formation concerning task onsets could be retrieved using such a system. This method would provide a simple and systematic way to trigger classification algorithms for workload level as-sessment, in addition to a not-on-task/on-task mode detection.
2 Single Trial SVM-based WMLoad Estimation
Along with the state estimation, we used machine learning techniques to discriminate low WM load versus high WM load trials. The mean classification accuracy reached up to 80.8% success-ful discrimination between low and high WM load trials with good mean specificity (89.5%) and sensitivity (72.1%). Moreover, the mean accuracy for 16 out of 19 participants was equal or superior to 70%, defined as a sufficient rate for BCI [54,65]. Only one participant’s WM load level estimation had a lower-than-chance classification. In fact, these results compare well to the rare on-line studies such as the ones conducted by Naseer et al. [38] (14 participants: 82.14% accuracy), Girouard et al. [39] (9 participants: 83.5% accuracy), and Schudlo et al. [43] (10 participants: 77.4% accuracy). However one has to consider that two of these studies in-volved controlled “rest versus task” paradigm [38,39], a two-class problem that leads to better classification results than a “low WM load versus high WM load” one. Indeed, these results demonstrated the efficiency of considering both spatial and temporal features as proposed by Tai et. al and Schudlo et. al [43,54], that allowed the monitoring of WM load level in ecological situations.
Another key issue when assessing the performance of an on-line inference system is related to the delay of single trial classification. Here, the automatic classification of WM load level oc-curred in the worst case less than 21.3s after the end of the ATC instruction (ATC instructions last 11s and estimated WM load of the trial is available less than 32.3s from the beginning of the trial), a comparable result with other line fNIRS-based BCI latency (for a review of
on-line fNIRS-based BCI latency, please refer to Strait et. al [35]). Such a delayed inference was not an issue in our experimental situation as pilots had 18s to program the autopilot according to the ATC clearances. As a matter of fact, the diagnosis of the WM performance (high WM load or low WM load) occurred at maximum 3.3s after the end of the participants’ task (Fig. 10). Although the loop was not completely closed in our study, this signal could be used to automatically give a feedback, for example to ATC. Such a feedback could allow ATC to check that the instruction has been understood, or to repeat the instruction to the pilots when high WM load conditions are detected, with an acceptable 3.3s maximum latency.
3 Limitation of this Study and Perspective
These results offer promising perspectives towards the design of a fNIRS-based “passive” BCI for pilots. However, its use in real operational cockpit still remains a challenge as safety is criti-cal in aeronautics.
First, we used a simplified pilot/ATC task for an easy implementation of our inference sys-tem. Since ATC was simulated, it prevented mutual pilot—controller verification as in a real operational situation. Despite this ecological limitation, we believe that our approach was rele-vant and could address several issues in aviation such as pilots training, pilot selection, or the monitoring of pilots’ WM ability that is highly sollicited when interacting with ATC [18]. In the future, pilots will use data-link technology that presents ATC messages as text to limit pilot-ATC communications. Data-link changes the nature of pilot-ATC interactions and sever-al studies have shown that it may negatively impact pilots’ WM performance especisever-ally when data-link interferes with other concurrent tasks [6,8]. Our next challenge is to test our real-time inference system in a multitasking context (i.e. ATC messages and failures management) and to dynamicaly adapt the interaction depending on pilots’ spare capacity.
A second issue in the use of a BCI in aviation is related to its reliability. A lack of BCI reli-ability could trigger spurious assistance and thus impair global pilots’ performance. Indeed, a mean classification rate of 80.8% and a 3.3s delayed diagnosis of WM load level cannot guaran-tee that the interaction is adapted in a timely and accurate manner. Therefore, a first step to
re-fine this approach is to integrate complementary measurements such as EEG [66,67] or
physiological sensors [68] that have been shown to significantly enhance classification perfor-mance when combined with fNIRS. A second step is to benchmark other machine learning
techniques such as Hidden Markov Models [69] or neuro-fuzzy inference systems [70] that are
well suited for the processing of physiological data [71]. Furthermore, once our classifier was trained (i.e. phase L), it remained static. Reinforcement learning [72] should be considered for gathering more samples and for updating our classifier with on-going trials. Such an approach would allow more robustness with potential optodes position drifting issues across long ses-sions and would permit to take into account participants’ neurophysiological evolutions across
time (e.g. fatigue, circadian rhythm [73]). Another way of improvement could be to use more
than one classifier method at the same time [74,75], as shown in practice by Tai et. al [54]. Moreover, this approach would allow for better classification of naturalistic ATC stimuli that are not at the extremes of a high vs a low WM load continuum. Another perspective is to ex-plore techniques to speed up response detection on fNIRS signal such as the ones proposed by Cui et. al [49] that can drastically reduce latency in detecting change in a mental state.
Finally, lingering issues remain regarding the implementation of a BCI in the cockpit. Air-craft accelerations (i.e. “G-forces”) may impact blood flow or creates headband motion artifacts
[76]. Controlled experiments have to be conducted in real flight with the use of accelerometers
to assess their effects on blood flow before the implementation of such systems in operational conditions. The usability of the BCI is another key factor in the acceptance of this technology.
No pilot would accept a lengthy calibration process to train the classifier before each flight de-parture. From a scientific point of view, this problem addresses inter-session consistency that is the analysis of the consistency of spatial and temporal features of cerebral oxygenation while performing a similar task across time. Some authors have investigated promising tracks and have shown that it is possible to define a trade-off between accuracy and calibration time [77]. The re-use of data collected during previous sessions [78] and the identification of potential users profile could help in dealing with this critical issue.
Supporting Information
S1 Dataset. Raw data from COBI Studio1used in this study.
(BZ2)
Author Contributions
Conceived and designed the experiments: TG GD SS FD. Performed the experiments: TG GD SS FD. Analyzed the data: TG GD SS FD FL. Contributed reagents/materials/analysis tools: TG GD SS FD FL. Wrote the paper: TG GD SS FD FL.
References
1. Causse M, Dehais F, Arexis M, Pastor J. Cognitive aging and flight performances in general aviation pi-lots. Aging, Neuropsychology, and Cognition. 2011; 18(5):544–561. doi:10.1080/13825585.2011. 586018
2. Causse M, Dehais F, Pastor J. Executive functions and pilot characteristics predict flight simulator per-formance in general aviation pilots. The International Journal of Aviation Psychology. 2011; 21(3):217– 234. doi:10.1080/10508414.2011.582441
3. Morrow D, Lee A, Rodvold M. Analysis of problems in routine controller-pilot communication. The Inter-national Journal of Aviation Psychology. 1993; 3(4):285–302. doi:10.1207/s15327108ijap0304_3
4. Miller GA. The magical number seven, plus or minus two: Some limits on our capacity for processing in-formation. Psychological review. 1994; 101(2):343. doi:10.1037/0033-295X.101.2.343PMID:8022966
5. Baddeley A. Working memory. Science. 1992; 255(5044):556–559. doi:10.1126/science.1736359
PMID:1736359
6. Risser MR, Scerbo MW, Baldwin CL, McNamara DS. Interference timing and acknowledgement re-sponse with voice and datalink ATC commands. In: Proceedings of the Human Factors and Ergonom-ics Society Annual Meeting. vol. 50. Sage Publications; 2006. p. 11–15.
7. Taylor JL, Yesavage JA, Morrow DG, Dolhert N, Brooks JO, Poon LW. The effects of information load and speech rate on younger and older aircraft pilots’ ability to execute simulated air-traffic controller in-structions. Journal of Gerontology. 1994; 49(5):191–200. doi:10.1093/geronj/49.5.P191
8. Scerbo MW, Risser MR, Baldwin CL. Implementing Speech and Simulated DataLink Commands: The Role of Task Interference and Message Length. In: Proceedings of the Human Factors and Ergonomics Society Annual Meeting. vol. 47. SAGE Publications; 2003. p. 95–99.
9. Taylor JL, O’Hara R, Mumenthaler MS, Rosen AC, Yesavage JA. Cognitive ability, expertise, and age differences in following air-traffic control instructions. Psychology and aging. 2005; 20(1):117–133. doi:
10.1037/0882-7974.20.1.117PMID:15769218
10. Billings CE, Cheaney ES. Information transfer problems in the aviation system. In: NASA Technical Re-port 1875; 1981. p. 89–90.
11. George L, Léecuyer A. An overview of research on ‘passive’brain-computer interfaces for implicit human-computer interaction. In: International Conference on Applied Bionics and Biomechanics ICABB 2010-Workshop W1’Brain-Computer Interfacing and Virtual Reality’; 2010.
12. Buttfield A, Ferrez PW, Millan JR. Towards a robust BCI: error potentials and online learning. Neural Systems and Rehabilitation Engineering, IEEE Transactions on. 2006; 14(2):164–168. doi:10.1109/ TNSRE.2006.875555
13. St John M, Kobus DA, Morrison JG, Schmorrow D. Overview of the DARPA augmented cognition tech-nical integration experiment. International Journal of Human-Computer Interaction. 2004; 17(2):131– 149. doi:10.1207/s15327590ijhc1702_2
14. Gratton G, Fabiani M. Optical imaging of brain function. Oxford Series in Human-Techology Interaction. 2006;p. 65.
15. Strangman G, Culver JP, Thompson JH, Boas DA. A quantitative comparison of simultaneous BOLD fMRI and NIRS recordings during functional brain activation. Neuroimage. 2002;17(2):719–731. Avail-able from:ftp://fh_articles_r:[email protected]/papers/Strangman2002.pdf.
16. Villringer K, Minoshima S, Hock C, Obrig H, Ziegler S, Dirnagl U, et al. Assessment of local brain activa-tion. In: Optical Imaging of Brain Function and Metabolism 2. Springer; 1997. p. 149–153.
17. Cui X, Bray S, Bryant DM, Glover GH, Reiss AL. A quantitative comparison of NIRS and fMRI across multiple cognitive tasks. Neuroimage. 2011; 54(4):2808–2821. doi:10.1016/j.neuroimage.2010.10.069
PMID:21047559
18. Ayaz H, Shewokis PA, Bunce S, Izzetoglu K, Willems B, Onaral B. Optical brain monitoring for operator training and mental workload assessment. Neuroimage. 2012; 59(1):36–47. doi:10.1016/j.
neuroimage.2011.06.023PMID:21722738
19. Takeuchi Y. Change in blood volume in the brain during a simulated aircraft landing task. Journal Of Oc-cupational Health-English Edition. 2000; 42(2):60–65. doi:10.1539/joh.42.60
20. Gagnon JF, Durantin G, Vachon F, Causse M, Tremblay S, Dehais F. Anticipating human error before it happens: Towards a psychophysiological model for online prediction of mental workload. In: Proceed-ings of the Human Factors and Ergonomics Society Chapter Europe; 2012.
21. Li C, Gong H, Zeng S, Luo Q. Verbal working memory load affects prefrontal cortices activation: Evi-dence from a functional NIRS study in humans. In: Biomedical Optics 2005. International Society for Optics and Photonics; 2005. p. 33–40.
22. Schreppel T, Egetemeir J, Schecklmann M, Plichta MM, Pauli P, Ellgring H, et al. Activation of the pre-frontal cortex in working memory and interference resolution processes assessed with near-infrared spectroscopy. Neuropsychobiology. 2008; 57(4):188–193. doi:10.1159/000147473PMID:18654088
23. Hirshfield LM, Gulotta R, Hirshfield S, Hincks S, Russell M, Ward R, et al. This is your brain on inter-faces: enhancing usability testing with functional near-infrared spectroscopy. In: Proceedings of the SIGCHI Conference on Human Factors in Computing Systems. ACM; 2011. p. 373–382.
24. Durantin G, Gagnon JF, Tremblay S, Dehais F. Using near infrared spectroscopy and heart rate vari-ability to detect mental overload. Behavioural brain research. 2014; 259:16–23. doi:10.1016/j.bbr. 2013.10.042PMID:24184083
25. Matsuyama H, Asama H, Otake M. Design of differential near-infrared spectroscopy based brain ma-chine interface. In: Robot and Human Interactive Communication, 2009. RO-MAN 2009. The 18th IEEE International Symposium on. IEEE; 2009. p. 775–780.
26. Coyle S, Ward T, Markham C, McDarby G. On the suitability of near-infrared (NIR) systems for next-generation brain–computer interfaces. Physiological Measurement. 2004; 25(4):815. doi:10.1088/ 0967-3334/25/4/003PMID:15382823
27. Coyle SM, Ward TE, Markham CM. Brain–computer interface using a simplified functional near-infrared spectroscopy system. Journal of neural engineering. 2007; 4(3):219. doi:10.1088/1741-2560/4/3/007
PMID:17873424
28. Power SD, Falk TH, Chau T. Classification of prefrontal activity due to mental arithmetic and music im-agery using hidden Markov models and frequency domain near-infrared spectroscopy. Journal of neu-ral engineering. 2010; 7(2):026002. doi:10.1088/1741-2560/7/2/026002
29. Naseer N, Hong KS. Classification of functional near-infrared spectroscopy signals corresponding to the right-and left-wrist motor imagery for development of a brain–computer interface. Neuroscience let-ters. 2013; 553:84–89. doi:10.1016/j.neulet.2013.08.021PMID:23973334
30. Hong KS, Naseer N, Kim YH. Classification of prefrontal and motor cortex signals for three-class fNIRS–BCI. Neuroscience letters. 2015; 587:87–92. doi:10.1016/j.neulet.2014.12.029PMID:
25529197
31. Girouard A, Solovey ET, Hirshfield LM, Chauncey K, Sassaroli A, Fantini S, et al. Distinguishing difficul-ty levels with non-invasive brain actividifficul-ty measurements. In: Human-Computer Interaction–INTERACT 2009. Springer; 2009. p. 440–452.
32. Solovey ET, Lalooses F, Chauncey K, Weaver D, Parasi M, Scheutz M, et al. Sensing cognitive multi-tasking for a brain-based adaptive user interface. In: Proceedings of the 2011 annual conference on Human factors in computing systems. ACM; 2011. p. 383–392.
33. Derosièere G, Dalhoumi S, Perrey S, Dray G, Ward T. Towards a Near Infrared Spectroscopy-Based Estimation of Operator Attentional State. PloS one. 2014; 9(3):e92045. doi:10.1371/journal.pone. 0092045
34. Sitaram R, Zhang H, Guan C, Thulasidas M, Hoshi Y, Ishikawa A, et al. Temporal classification of multi-channel near-infrared spectroscopy signals of motor imagery for developing a brain–computer inter-face. NeuroImage. 2007; 34(4):1416–1427. doi:10.1016/j.neuroimage.2006.11.005PMID:17196832
35. Strait M, Canning C, Scheutz M. What we can and cannot do with near infrared spectroscopy. Frontiers in Neuroscience. 2014; 8(117).
36. Naseer N, Hong K. fNIRS-based brain-computer interfaces: a review. Name: Frontiers in Human Neu-roscience. 2015; 9(3).
37. Abdelnour AF, Huppert T. Real-time imaging of human brain function by near-infrared spectroscopy using an adaptive general linear model. Neuroimage. 2009; 46(1):133–143. doi:10.1016/j.neuroimage. 2009.01.033PMID:19457389
38. Naseer N, Hong MJ, Hong KS. Online binary decision decoding using functional near-infrared spectros-copy for the development of brain–computer interface. Experimental brain research. 2014; 232(2):555– 564. doi:10.1007/s00221-013-3764-1PMID:24258529
39. Girouard A, Solovey ET, Jacob RJ. Designing a passive brain computer interface using real time classi-fication of functional near–infrared spectroscopy. International Journal of Autonomous and Adaptive Communications Systems. 2013; 6(1):26–44. doi:10.1504/IJAACS.2013.050689
40. Solovey E, Schermerhorn P, Scheutz M, Sassaroli A, Fantini S, Jacob R. Brainput: enhancing interac-tive systems with streaming fnirs brain input. In: Proceedings of the SIGCHI Conference on Human Factors in Computing Systems. ACM; 2012. p. 2193–2202.
41. Afergan D, Peck EM, Solovey ET, Jenkins A, Hincks SW, Brown ET, et al. Dynamic difficulty using brain metrics of workload. In: Proceedings of the 32nd annual ACM conference on Human factors in computing systems. ACM; 2014. p. 3797–3806.
42. Chan J, Power S, Chau T. Investigating the need for modelling temporal dependencies in a brain–com-puter interface with real-time feedback based on near infrared spectra. Journal of Near Infrared Spec-troscopy. 2012; 20(1):107–116. doi:10.1255/jnirs.971
43. Schudlo LC, Chau T. Dynamic topographical pattern classification of multichannel prefrontal NIRS sig-nals: II. Online differentiation of mental arithmetic and rest. Journal of neural engineering. 2014; 11 (1):016003. doi:10.1088/1741-2560/11/1/016003PMID:24311057
44. Strait M, Canning C, Scheutz M. Reliability of NIRS-Based BCIs: a placebocontrolled replication and re-analysis of Brainput. In: CHI’14 Extended Abstracts on Human Factors in Computing Systems. ACM; 2014. p. 619–630.
45. McFarland DJ, Anderson CW, Muller K, Schlogl A, Krusienski DJ. BCI meeting 2005-workshop on BCI signal processing: feature extraction and translation. IEEE transactions on neural systems and rehabili-tation engineering. 2006; 14(2):135. doi:10.1109/TNSRE.2006.875637PMID:16792278
46. Fazli S, Mehnert J, Steinbrink J, Curio G, Villringer A, Müller KR, et al. Enhanced performance by a hy-brid NIRS–EEG brain computer interface. Neuroimage. 2012; 59(1):519–529. doi:10.1016/j. neuroimage.2011.07.084PMID:21840399
47. Tomita Y, Mitsukura Y. Hemodynamic characteristics for improvement of EEGBCI performance. In: Human System Interaction (HSI), 2013 The 6th International Conference on. IEEE; 2013. p. 495–500. 48. Utsugi K, Obata A, Sato H, Katsura T, Sagara K, Maki A, et al. Development of an optical brain-machine
interface. In: Engineering in Medicine and Biology Society, 2007. EMBS 2007. 29th Annual Internation-al Conference of the IEEE. IEEE; 2007. p. 5338–5341.
49. Cui X, Bray S, Reiss AL. Speeded near infrared spectroscopy (NIRS) response detection. PLoS One. 2010;5(11):e15474. Available from:ftp://fh_articles_r:[email protected]/papers/Cui2010.pdf. 50. Durantin G, Scannella S, Gateau T, Delorme A, Dehais F. Moving Average Convergence Divergence filter preprocessing for real-time event-related peak activity onset detection: Application to fNIRS sig-nals. In: Engineering in Medicine and Biology Society (EMBC), 2014 36th Annual International Confer-ence of the IEEE. IEEE; 2014. p. 2107–2110.
51. Derosièere G, Mandrick K, Dray G, Ward TE, Perrey S. NIRS-measured prefrontal cortex activity in neuroergonomics: strengths and weaknesses. Frontiers in human neuroscience. 2013; 7.
52. Sato H, Fuchino Y, Kiguchi M, Katura T, Maki A, Yoro T, et al. Intersubject variability of near-infrared spectroscopy signals during sensorimotor cortex activation. Journal of biomedical optics. 2005; 10 (4):044001–1. doi:10.1117/1.1960907
53. Jasdzewski G, Strangman G, Wagner J, Kwong K, Poldrack R, Boas D. Differences in the hemodynam-ic response to event-related motor and visual paradigms as measured by near-infrared spectroscopy. Neuroimage. 2003; 20(1):479–488. doi:10.1016/S1053-8119(03)00311-2PMID:14527608
54. Tai K, Chau T. Single-trial classification of NIRS signals during emotional induction tasks: towards a corporeal machine interface. Journal of neuroengineering and rehabilitation. 2009;6:39. Available from:
ftp://fh_articles_r:[email protected]/papers/Tai2009.pdf.
55. Appel G. Technical analysis: power tools for active investors. FT Press; 2005.
56. Delpy DT, Cope M, Van der Zee P, Arridge S, Wray S, Wyatt J. Estimation of optical pathlength through tissue from direct time of flight measurement. Physics in medicine and biology. 1988; 33(12):1433. doi:
10.1088/0031-9155/33/12/008PMID:3237772
57. Ayaz H, Onaral B. Analytical software and stimulus-presentation platform to utilize, visualize and ana-lyze near-infrared spectroscopy measures. Master’s Degree Thesis, Drexel University; 2005. 58. Ayaz H, Shewokis PA, Curtin A, Izzetoglu M, Izzetoglu K, Onaral B. Using Maze-Suite and functional
near infrared spectroscopy to study learning in spatial navigation. Journal of visualized experiments: JoVE. 2011;(56). doi:10.3791/3443PMID:22005455
59. Yamamoto D, Kuroda S, Okada E. Modeling of influence of frontal sinus on NIRS signal of brain activa-tion. In: European Conference on Biomedical Optics. International Society for Optics and Photonics; 2007. p. 66290S–66290S.
60. Cortes C, Vapnik V. Support-vector networks. Machine learning. 1995; 20(3):273–297. doi:10.1023/ A:1022627411411
61. Kuhn M. Building Predictive Models in R Using the caret Package. Journal of Statistical Software. 2008;28(5):1–26. Available from:ftp://fh_articles_r:[email protected]/papers/Kuhn2008.pdf. 62. Parasuraman R, Wilson GF. Putting the brain to work: Neuroergonomics past, present, and future.
Human Factors: The Journal of the Human Factors and Ergonomics Society. 2008; 50(3):468–474. doi:
10.1518/001872008X288349
63. Fletcher P, Henson RNA. Frontal lobes and human memory insights from functional neuroimaging. Brain. 2001; 124(5):849–881. doi:10.1093/brain/124.5.849PMID:11335690
64. Miller EK, Cohen JD. An integrative theory of prefrontal cortex function. Annual review of neuroscience. 2001; 24(1):167–202. doi:10.1146/annurev.neuro.24.1.167PMID:11283309
65. Kubler A, Mushahwar V, Hochberg LR, Donoghue JP. BCI meeting 2005-workshop on clinical issues and applications. Neural Systems and Rehabilitation Engineering, IEEE Transactions on. 2006; 14 (2):131–134. doi:10.1109/TNSRE.2006.875585
66. Pfurtscheller G, Allison BZ, Bauernfeind G, Brunner C, Solis Escalante T, Scherer R, et al. The hybrid BCI. Frontiers in neuroscience. 2010; 4:3.
67. Khan MJ, Hong MJ, Hong KS. Decoding of four movement directions using hybrid NIRS-EEG brain-computer interface. Frontiers in human neuroscience. 2014; 8. doi:10.3389/fnhum.2014.00244
68. Guirgis M, Falk T, Power S, Blain S, Chau T. Harnessing physiological responses to improve NIRS-based brain-computer interface performance. In: Proc. ISSNIP Biosignals Biorobotics Conf; 2010. p. 59–62.
69. Sitaram R, Zhang H, Guan C, Thulasidas M, Hoshi Y, Ishikawa A, et al. Temporal classification of multi-channel near-infrared spectroscopy signals of motor imagery for developing a brain–computer inter-face. NeuroImage. 2007;34(4):1416–1427. Available from:ftp://fh_articles_r:[email protected]. fr/papers/Sitaram2007.pdf.
70. Zhang JH, Peng XD, Liu H, Raisch J, Wang RB. Classifying human operator functional state based on electrophysiological and performance measures and fuzzy clustering method. Cognitive Neurody-namics. 2013;p. 1–18.
71. Réegis N, Dehais F, Rachelson E, Thooris C, Pizziol S, Causse M, et al. Formal Detection of Attentional Tunneling in Human Operator–Automation Interactions. IEEE Transaction on Human Machin System. 2014;.
72. Kaelbling LP, Littman ML, Moore AW. Reinforcement learning: a survey. Journal of Artificial Intelligence Research. 1996; 4:237–285.
73. Dijk DJ, Duffy JF, Czeisler CA. Circadian and sleep/wake dependent aspects of subjective alertness and cognitive performance. Journal of sleep research. 1992; 1(2):112–117. doi:10.1111/j.1365-2869. 1992.tb00021.xPMID:10607036
74. Lin WH, Hauptmann A. Meta-classification: Combining multimodal classifiers. In: Mining Multimedia and Complex Data. Springer; 2003. p. 217–231.
75. Tsirogiannis G, Frossyniotis D, Nikita K, Stafylopatis A. A Meta-classifier Approach for Medical Diagno-sis. In: Vouros G, Panayiotopoulos T, editors. Methods and Applications of Artificial Intelligence. vol. 3025 of Lecture Notes in Computer Science. Springer Berlin Heidelberg; 2004. p. 154–163. Available from:http://dx.doi.org/10.1007/978-3-540-24674-9_17.
76. Mackey JR, Harrivel AR, Adamovsky G, Lewandowski BE, Gotti DJ, Tin P, et al. Effects of Varying Gravity Levels on fNIRS Headgear Performance and Signal Recovery. The American Institute of Aero-nautics and AstroAero-nautics. 2013;.
77. Power SD, Kushki A, Chau T. Intersession consistency of single-trial classification of the prefrontal re-sponse to mental arithmetic and the no-control state by nirs. PloS one. 2012; 7(7):e37791. doi:10. 1371/journal.pone.0037791PMID:22844390
78. Krauledat M, Tangermann M, Blankertz B, Müller KR. Towards zero training for brain-computer inter-facing. PloS one. 2008; 3(8):e2967. doi:10.1371/journal.pone.0002967PMID:18698427