O
pen
A
rchive
T
OULOUSE
A
rchive
O
uverte (
OATAO
)
OATAO is an open access repository that collects the work of Toulouse researchers and
makes it freely available over the web where possible.
This is an author-deposited version published in :
http://oatao.univ-toulouse.fr/
Eprints ID : 15910
To link to this article : DOI:10.1016/j.combustflame.2016.05.004
URL :
http://dx.doi.org/10.1016/j.combustflame.2016.05.004
To cite this version : Mejia, Daniel and Miguel-Brebion, Maxence
and Selle, Laurent On the experimental determination of growth and
damping rates for combustion instabilities. (2016) Combustion and
Flame, vol. 169. pp. 287-296. ISSN 0010-2180
Any correspondence concerning this service should be sent to the repository
administrator:
[email protected]
On
the
experimental
determination
of
growth
and
damping
rates
for
combustion
instabilities
D.
Mejia
∗,
M.
Miguel-Brebion,
L.
Selle
Institut de Mécanique des Fluides de Toulouse (IMFT) - Université de Toulouse, CNRS-INPT-UPS, Toulouse, France
Keywords:
Combustion instabilities Flame Transfer Function Growth rate
Damping rate
a
b
s
t
r
a
c
t
Thispaperpresentsfourexperimentalmethodsfortheevaluationofgrowthratesofcombustion insta-bilities.Asystematicinvestigationisconductedonalaminarslotburnerwithfiveoperatingpoints(two stableandthreeunstable).Theaccuracyofthemethodsisassessedbycrosscomparisonandtheuseof threedifferentflowvariablesas input:velocity,pressureand heatreleaseratefluctuations. Finally,the experimentaldeterminationsofthegrowthratesarecomparedtothepredictionofalow-orderacoustic modelfedwithaFlameTransferFunction.
1. Introduction
Combustion instabilities (CI)are a major problem for the de-sign andoperation ofpower-generation systems such as gas tur-bines, aeronautical engines androcket engines [1]. The construc-tive coupling betweenacoustic waves and unsteady heat release rateconstitutive of CI,is responsible forloss ofperformance, re-striction under operating conditions and sometimes catastrophic failures.Thechallenge forunderstandingandpredicting CIliesin the multiplicity of physical phenomena involved in the unstable loop[2]:acoustics,vortexdynamics,mixing,turbulence,chemistry, two-phase flows, etc. One ofthe canonical configurations forthe studyofCIisthelaminarpremixedflame,whichhasbeen exten-sivelyscrutinized [3–6].Despiteits apparentsimplicity,thisflame containsoneofthemainphysicalmechanismsdrivingCI:the dy-namicinteractionbetweenacoustics,vorticalstructuresintheflow fieldandtheflamefront.Comparativestudiesofconical,V-shaped and triangular flames gives insight into the mechanisms driving theoverallresponseoftheflametoacousticperturbations[7].The crux of the matter for the prediction of CI is to model this re-sponse,whichisoftenachievedthroughaso-calledFlameTransfer Function(FTF),relatingtheunsteadyheatreleaserateoftheflame,
˙
q′, to the incident acoustic velocity perturbation, v′. In many of
theabovementionedconfigurations,reasonablyaccurateanalytical models forthe FTFcan be derived [6,8]. Forrealistic combustion devices,theFTFmustbemeasuredexperimentally[9–11]or
com-∗ Corresponding author.
E-mail address: [email protected] , [email protected] (D. Mejia).
puted with high-fidelity unsteady 3D numerical simulations [12– 14].
For the design of stable combustion devices,a trial-and-error experimental approach is very costly so that alternatives using numerical simulation are sought. The first option, whichmay be calledabrute-forceapproachistosolvethereactingNavier–Stokes equationsoverthewholeconfiguration.Large-EddySimulation,for example,hasshownitspotentialforthistask[15,16].The compu-tational cost of a singlesimulation is howeverso large that the exploration of thewhole rangeof operatingconditions ordesign variations isimpractical.Analternativeistosolveonly for acous-tic perturbations and model the flamevia the FTF: theresulting tool maybe calleda thermoacousticcode.Whethertheequations be Linearized Euler or Helmholtz, in complex 3D geometries or 1D network models, the methodology is usually computationally leanandhasshownitsabilitytopredictstabilitymaps[10,17–20]. The typicaloutputofathermoacousticsolveristhreefold:(1)the frequency ofthe instability,(2)the shapeof theassociated pres-sureandvelocityfieldsand(3)thelineargrowthrateofindividual eigenmodes.
Becausetheimpactoftheflameasanactiveacousticsourceis usually small,thepredictionofeigenfrequenciesandmodeshapes is not a difficult task. The determination of the growth rates is more subtle as it requires a precise evaluation of the flame re-sponse(withaFTFforexample),thefluxesthroughtheboundaries (byspecifyingtheimpedances)andthesourcesofinternal dissipa-tion (through friction atthe wallsandtransfer fromacoustics to vorticity). And yet, a precise determination of the linear growth rateis crucialforthedesign andsafeoperationofan engine. In-deed, even if a given operating point is observed as stable, it is
Nomenclature Greeksymbols
α
Natural dampingofthesystemundernon-reactingconditions[s−1]
β
Growth/dampingrateinducedbytheflame[s−1]δ
ImpulsesignalintheIRtest[Volts]η
Anystatevariableκ
Coefficientthataccountsforthenon-linearityofthe flameresponseν
Growth/dampingrateofthesystem[s−1]ω
Angularfrequency[Rad/s]ω
0 Response/resonanceangularfrequency[Rad/s]ω
0,nr Response angular frequency under non-reactingconfiguration[Rad/s]
8
Equivalenceratio[-]φ
Phase[Rad]ϕ
PhaseoftheFTF[Rad]τ
Time delay between the velocity and heat releaseratesignals[s]
ξ
Forcingtermζ
UncorrelatedwithnoiseRomanletters
A Amplitudeofthelimitcycle
a Acceleration[G]
A0 Amplitudeofthelimitcyclewithoutstochastic
forc-ing
AIR Amplitude of the impulse signal in the IR test
[Volts]
C Combustionnoisefactor[-]
c0 Normalizedstochasticforcinglevel[-]
E Freshtoburnt-gasesdensityratio[-]
F FlameTransferFunction[-]
f Frequency[Hz]
f0 Responsefrequency[Hz]
f0,nr Responsefrequencyunderno-reactingconfiguration
[Hz]
G GainoftheFTF[-]
h Effectiveslotheight[m]
hs Slotheight[mm]
I IntensityofCH∗radical[Volts]
ls Slotlength[mm]
N Combustioninteractionindex[-]
p Acousticpressure[Pa]
˙q Heatreleaserate[∝Js−1]
r Pinchingdistance[m]
S Powerspectraldensity
Ss Slotcrosssection[m2]
t Time[s]
Tg Freshgasestemperature[°C]
Ts Slottemperature[°C]
v velocity[m/s]
vb Bulkvelocity[ms−1]
ws Slotwidth[mm]
useful toknowhow farfromstability it isso that smallchanges (manufacturing variations,aging throughmechanicalandthermal stress,variationsinfuelproperties,etc.)donottriggeraCI.
The objectiveofthepresentworkistopresent various experi-mentaltechniquesthatcanbeusedtomeasurethegrowthrateof stableor unstablemodeswiththeintent toserve asavalidation forthermoacousticsolvers.Themanuscriptisorganizedasfollows: First,inSection2ageneralmodelforasecond-orderdynamic sys-tem is presented. This model is the starting point to derive the
particularsolutionstothecorrespondingfourdamping/growthrate identificationmethods.Then,theexperimentalsetupand diagnos-ticsare presentedinSection 3.Theexperimental resultsforeach ofthe fouridentificationmethods isthen discussed inSection 4. Finally,alow-ordermodelisderivedinSection5andcomparedto theresults ofSection 4forthe validationof its abilitytopredict thelineargrowthrateofCIs.
2. Theoreticalmodel
Theobjectiveofthisworkistheevaluationofthegrowthrate for a specific mode andas explained in [19,21], around a given eigenmode of angular frequency ω 0, it is a valid assumption to
considerthatthethermoacousticsystemobeysasecond-order dif-ferentialequationoftheform:
¨
η
− f(
η
,η
˙)
+ω
02η
=ξ
(1)Thisformulationsfollowsthat of[21],where η representsany statevariableandfisanon-linearfunctionof ηanditsfirst deriva-tive
η
˙,which accountsfor internal dissipation, fluxesof acoustic energyat theboundaries andthe contribution ofunsteady com-bustion,i.e.theflame. ξ,correspondstoaforcing termduetoan externaldevicesuchasaloudspeaker.Inthepresentstudy, ηcan be the acoustic pressure p′ or acoustic velocity v′ at a given lo-cationintheexperimental rig,ortheheatreleaserateintegrated overthe entirecombustion chamber, q˙′.Following[21],thefunc-tionfmaybemodeledas:
f
(
η
,η
˙)
=η
˙(
β
−α
−κη
2)
(2)where αcorrespondstothecontributionoflinearacoustic absorp-tionin thevolume andfluxesattheboundaries, meaning that it ispositive. βisthelinearcontributionofthefeedbackinducedby theflame.Itis positivewhenthe flamedrivesthe instabilityand negative when unsteadycombustion damps acousticfluctuations. Thecoefficient κ accountsforthenon-linearityofflameresponse toacousticsandcontrolstheamplitudeofthelimitcyclereached whenthesystemislinearlyunstable.Thegrowth/dampingrate, ν, ofthesystemisdefinedas:
ν
=β
−2α
. (3)Withoutcombustion, β=0,then ν=−
α
/2,sothat thesystemis alwaysstable.Inareactingflow,if β> αthen ν>0,meaningthat thedrivingcontributionoftheflameovercomesthe linear acous-ticlossesandthesystembecomeslinearlyunstable.Ontheother hand,if β < α thesystemislinearlystable.Eqs.(1)–3providetheproperbackgroundfortheextractionof thedeterministicquantities ω 0and νfromexperimentaldata.Four
identifications methods are now presented: Harmonic Response (HR),ImpulseResponse(IR),ActiveControl(AC)andWhiteNoise (WN).
2.1. Harmonicresponsemethod(HR)
Theharmonicresponsehasbeenextensivelyusedinthestudy of combustion instabilities for non-reacting [22] and reacting
[20,23]flows.However,thistechniqueislimitedtosystems featur-ingnegative growthrates,i.e. ν < 0.Fora linearlystablesystem, thenon-linearpartofEq.(2)canbe neglected aslong as pertur-bations tothe equilibriumstate aresmallso that Eq.(1)reduces to:
¨
η
− 2ν
η
˙+ω
20
η
=ξ
(4)TakingthepowerspectraldensityofEq.(4)yields:
Sη= Sξ
(
ω
20−
ω
2)
2+4ν
2ω
2whereSη (respectivelySξ)isthepowerspectral densityof η
(re-spectively
ξ
). Eq. (5) indicates that the system has a maximum response at the angular frequencyω
=ω
0p
1−
(
ν
/ω
0)
2 with awidthatthe halfmaximum of2
ν
. Consequently,the principleof theHR methodistodetermine ω 0 and νby applyinganoptimalfitofEq.(5)tothepowerspectraldensityofexperimentally mea-suredp′,v′orq˙′.
2.2. Impulseresponsemethod(IR)
Forcombustion application, theimpulse response methodhas been lessused [20,24] thanthe HR method. Moreover, itis only suitableforlinearlystablesystems,i.e.when ν<0.Thesystemis pushedawayfromitssteadystatebyaveryshortperturbationand it subsequently behaves as a damped harmonic oscillator, which obeysthehomogeneousformofEq.(1):
¨
η
− 2ν
η
˙+ω
20
η
=0 (6)Becausenon-lineartermshavebeenneglected,Eq.(6)isonlyvalid forsmallamplitudes.Inthelimitcasewhere(
ν
/ω
0)2 <<1,whichhasbeenverifiedforallcasespresentedinthispaper,thesolution ofEq.(6)is:
η
=η
0eνtcos(
ω
0t+φ
)
(7)Thus,theprincipleoftheIRmethodistodetermine ω 0 and ν by
fittingEq.(7)tothetimetracesoftheflowvariablesp′,v′orq˙′.
2.3. Activecontrolmethod(AC)
Activecontrolofcombustioninstabilitieshasbeenusedinthe
combustion community for a while [25–29] and more recently
[30]. It was first introduced in the 1980s on a Rijke tube [31], demonstrating thatusing avery smallfraction ofthesystem en-ergy, the acoustic pressure amplitudecan be reduced by several ordersofmagnitude.Thetheorybehindactivecontrolof combus-tioninstabilitiesis outofthescopeofthisstudy,herewesimply usethistechniquewiththeintenttomeasuring ω 0and ν.
Once a systemwith a positive growth rate (
ν
> 0), is stabi-lizedby an active control method,it is possibleto stop the con-trolandstudythetemporalevolution ofthesysteminthelinear regime. Although the growthrate ispositive, the assumptions ofSection2.2stillholdsothatthesystemfollowsEq.(7).
The principle of the AC method is then the same as the IR method:recovering ω 0 and ν byfittingEq.(7)tothetimetraces
ofp′,v′orq˙′.Careneedstobetakenregardingtheassumptionof
linearityoftheflameresponsemeaningthatonlysmallamplitudes shouldbeconsidered.
2.4. Whitenoisemethod(WN)
Stochastic whitenoise was used in [21,32] to retrievethe de-terministic parameters of a second-order dynamic system andin
[13]tocalculatethe FTFofaswirl burnerin aLESsimulation.In
[21],theforcingoriginatedfromturbulentfluctuationsorfrom ac-tuators excited by a signal generator. Unlike other methods, WN is adequate for both stableand unstable cases.However, asit is basedontheprocessingofstochasticdata,longtemporalsamples areneededtoobtainaccurateresults.
When thesystemfeaturesa negativegrowthrate(
ν
< 0),the assumptionofSection2.1stillhold.ThedifferencebetweentheHR andWN methods lies inthe natureof theforcing, which is har-monic fortheformerandnon-coherentstochastic whitenoisefor thelatter.Theprocedureforthedeterminationof ω 0and νisthenthesameasfortheHRmethod:fittingEq.(5)tothepower spec-traldensityofexperimentallymeasuredp′,v′orq˙′.
Table 1
Summary of the different methods and the configuration to which they apply.
Model equation Configuration
HR S η(ω) = Sξ (ω2 0−ω2)2+4ν2ω2 Stable IR η(t) = η0 e νt/2 cos (ω0 t + φ) Stable AC η(t) = η0 e νt/2 cos (ω0 t + φ) Unstable WN a S η(ω) = (ω2 Sξ 0−ω2)2+4ν2ω2 Stable WN b S A′(ω) = A 2 0 πω2+(2cν0+c0)2 Unstable
The case of a linearly unstable system featuring a positive growth rate (
ν
> 0) is now considered. As lucidly explained in[21]theamplitude, A,ofthelimit cyclefluctuatesarounda mean value, A¯, because of the stochastic perturbations from
ξ
. These fluctuations are denoted A′ andfollow the first-orderdifferential equation:˙
A′=−
(
2ν
+c0
)
A′+ζ
(8)where c0=
π
Sξ/2ω
20A20, A0 is the amplitude of the limit cyclewithout stochastic forcing1 and ζ is an uncorrelated whitenoise withanintensityrelatedtothatof ξ throughSζ=Sξ/2
ω
20.Taking
thePSDofEq.(8)yields:
SA′= A2 0
π
c0ω
2+(
2ν
+c 0)
2 (9) The principleoftheWNmethodforanunstableflameconsistsin fittingEq.(9)toexperimentaldata.Asnotedin[21]thismethodis validonlyifthelimitcycleisweaklyperturbedbyadditive white noise,i.e. ν≫ c0.The various methods proposed for the determination of
the growth rate of combustion instabilities are summarized in
Table 1. It should be pointedout that the methods described in
Section 2.1and Section 2.4for stablesystems assume that there isnolinearmodalinteraction,i.e.theeigenfrequenciesarenottoo closefromeachother.Otherwise,theresponsesrelatedtotwo ad-jacentmodesmayoverlap.Inthepresentwork,thisisnota prob-lem since theclosest mode isseveralhundred Hertzaway. How-ever,inannularsystemsforexample,themodaldensityisusually quitehigh,questioningtheapplicabilityofthemethods.
3. Experimentalset-up
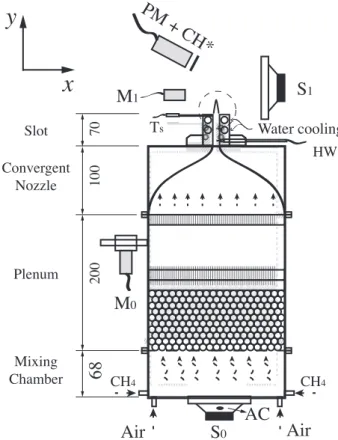
The experiment is a slot burner [20,33] with a laminar pre-mixedmethane/airflamestabilizedattheburneroutlet(cf.Fig.1).
The four main components are: a mixing chamber, a plenum, a
convergentnozzleandarectangular-cross-sectionslot(widthws=
10 mm andlength ls=100 mm)witha height hs=70 mm.The flowratesofairandmethanearecontrolledandmeasuredvia in-dividualmassflowmeters(BronkhorstF-201AV-AAD-33-V). Reac-tantsareinjectedatthebottomofthemixingchamberina cross-flowconfigurationtomaximizemixing.Thepremixedflowisthen laminarized in the plenum by an array of small glass balls and three honeycomb panels. Finally, it passes through the converg-ing nozzleandtheslot.The levelofpremixingisexcellent asthe flame shape isregular andsteadyin stableoperatingpoints. The temperatureofthe burnerrimis controlledby fourwatercooled cylindrical passages. The water temperature in the upper chan-nels can be set between1 and 99°C, with a mass flow rateup to1kg/min.Inthelowerchannels,wateratambienttemperature flowsat5kg/min.Thepurposeofthisdual-channelcoolingsystem istobeabletocontrolTs,whilemaintainingthelowerpartofthe
slotandtheburnerunderambientconditions.
1 In the limit of small perturbations, one has ¯A ≈ A 0 .
Fig. 1. Sketch of the burner: transverse cut and experimental diagnostics. M 0 and M 1 are 1/4 ′′ microphones. PM + CH ∗is a photomultiplier equipped with CH ∗ fil- ter. HW corresponds to a hotwire. T s is K-type thermocouple. S 1 and S 2 are two loudspeakers. AC is an accelerometer.
3.1. Diagnostics
AK-type thermocoupleisplaced1mm belowtheburner out-let. Itgivesthetemperature, Ts,ofthe materialascloseas
possi-ble to the flame base.A hot-wire probe (Dantec Dynamics, Mini CTA equippedwitha55P16probe), labeledHW inFig.1,isused to measure the unsteady axial velocity v(t), located 55 mm up-streamoftheslotoutlet.Aphotomultiplier(Thorlabs,BialkaliPMT, PMM01), labeled PM in Fig. 1, measures the unsteady intensity,
I(t),ofspontaneousemissionofCH∗radicals.The PMisequipped with a narrow-band filtercentered ona wavelength λ= 430 nm and is placed 400 mm away fromthe flame, alignedwith the z
axis, facing the longitudinal axis of the flame, which is fully in-cluded inits field of view.It has been shownthat forlean pre-mixedflames,I(t)isproportionaltotheheatreleaserate[34].Two microphones,M0 andM1,(B&K1/4” PrepolarizedFree-field
4954-B) are usedtorecord theacoustic pressurefluctuation, p′
0
(t)
andp′
1
(t
)
, respectively. M0 is placed in a waveguide connected to apressure plughole inthe middleofthe plenum[35],while M1 is
located 300 mmaway fromthe burner.Twoloudspeakers(Focal, ISN 100),one in the interior,S0 andthe other at theexterior of
the burner,S1,areusedto generateacoustic wavesprescribedby
asignalgenerator(NationalInstruments,PCI-6052E).Moreover,an accelerometer (AllianTech, ultra miniature 3224A3 accelerometer) isplacedonthemembraneoftheloudspeakerS0inorderto
mon-itoritsdisplacement.
4. Experimentalresults
ThefouridentificationmethodsdescribedinSection2arenow applied totheburner ofFig.1inordertoestimate thefrequency,
ω
0 andgrowth/dampingrate, ν.Thisslotburnerisoperatedclosetoitsstabilitylimit.Thislimitiscontrolledbytheburner-rim
tem-Table 2
Summary of the operating points chosen for the evaluation of the characteristic parameters of the system. The identification methods applicable to each operation points are highlighted in grey.
Operating point Name 8[-] T s [ °C] HR IR AC WN
Non Reacting NR 0.00 20 N/A N/A N/A
Reacting Very Stable RVS 0.90 120 N/A N/A N/A
Reacting Stable RS 0.85 120 N/A N/A N/A
Reacting Slightly Unstable RSU 0.80 120 N/A
Reacting Unstable RU 0.80 60 N/A N/A
Reacting Very Unstable RVU 0.80 20 N/A N/A
Fig. 2. Results for the HR method for the three stable operating points, NR (left), RVS (center) and RS (right). The rows correspond to the three different state vari- ables: internal pressure p ′
0 (top row), velocity v ′ (middle row) and heat release rate ˙
q′ (bottom row).
perature,which can be used in a reliable andrepeatable way to adjustthelevelofinstability[20].Changingthecooling-water tem-perature allows to cross the stability limit so that the accuracy of each identification method can be tested. Five different com-binationsofequivalenceratio,
8
,andburnerrimtemperature,Ts,werechosenasoperatingpoints.Thebulkvelocity,
v
b=1.8ms−1,andfreshgasestemperature,Tg=27°C,arekeptconstant.Table2
presents the operating conditions: one non reacting and five re-actingcases. Twostable2 andthree unstable conditions are con-sidered. Theunstablepoints havedifferent limit-cycleamplitudes of heat release rate fluctuations, which are 3%, 7% and 12% of the mean,for the Reacting SlightlyUnstable (RSU), Reacting Un-stable(RU) and ReactingVery Unstable (RVU) cases,respectively.
Table2alsoshows, ingrey, whichidentificationmethodis appli-cableforeachoperatingpoint.
4.1. Harmonicresponse
The HR methodcan be applied to the threestable cases: NR, RVS and RS. The external loudspeaker S1 (cf. Fig. 1) delivers an
harmonicexcitation ξ=ℜ
(
ξ
0e−iωt+φ)
towardstheflame.Thefluc-tuationsof theflow variables,were characterizedforfrequencies, between f=30Hzand80Hz bysteps of
1
f=0.5Hz.The am-plitudeoftheinputsignaliskeptconstantforallfrequencies.The signalis2slongandtheresult,foreachfrequency,istheaverage of4samples.Figure2showsthenormalizedpowerspectraldensityof pres-sure(Sp′
0),velocity(Sv′)andheatreleaserate(Sq˙′)fluctuationsfor thethreecases.
2 Heat release rate fluctuations are less than 1 % of the mean during stable oper- ation.
Fig. 3. PSD of the velocity signal, S v′ : + RS operating point, fit with Eq. (5) .
Table 3
Results for the HR method applied to the stable cases, NR, RVS and RS.
NR RVS RS f0,nr [Hz] α[s −1 ] f0 [Hz] ν[s −1 ] f0 [Hz] ν[s −1 ] p′0 53.50 −23.57 58.87 −10.55 58.52 −7.47 v′ 52.35 −17.86 58.58 −9.06 58.36 −7.09 ˙ q′ – – 58.63 −9.50 58.39 −7.38 Mean 52.99 −20.71 58.69 −9.70 58.43 −7.31 std. 0.8 4.04 0.16 0.77 0.08 0.20
All variablesexhibit a peak inthemagnitudeof theresponse, typical ofa resonance,asexpected fromEq.(5).The presenceof theflamehasathreeconsequences:
1. Thepeakshiftstotherightmeaningthatunsteadycombustion slightlyincreases ω 0.
2. The width ofthe resonance peak decreases withcombustion, indicating that the flame has a destabilizing effect on the system.However, itscontributionisnotsufficienttoovercome linearacousticlossessothattheburnerremainsstable. 3. The absoluteamplitudeof theacoustic signal atthe response
frequencyincreaseswithcombustion,whichconfirmsitem(2). Therms ofpressurefluctuationsfortheNR,RVS andRScases are3.7Pa,9.7Paand12.1Pa,respectively.
It should also be pointedout that the PSDof pressure inthe NRcaseismorenoisy.Noexactexplanationforthisisavailableat themoment.However,takingintoaccountthatthesameexcitation amplitudewasusedinnon-reactingandreactingcases,thesignal to noise ratio is lower in theNR casedueto its smallergrowth rate. Nevertheless,thisdoes not elucidate whythe velocity spec-trumislessnoisythanthatofthepressure.
In order to illustrate the post-processing procedure, the PSD of velocity in the RS operating point is presented in Fig. 3, to-gether with the corresponding fit from Eq. (5). For this specific case, f0= ω 0/2
π
=58.36± 0.016Hzand ν=7.1± 0.14s−1,witha95%confidenceinterval.
TheresultsfortheHRmethodare summarizedinTable 3and theyquantifythequalitativeobservationsobtainedfromFig.2.The peak in the spectrumof the response isshifted by 10% between non-reactingandreactingcasesanditisalmostequalfortheRVS and RS cases.With the flame, ν increasesbut remains negative. Thesystemisstillstablebutclosertothestabilitylimit.Likewise, |
ν
|islargerfortheRVSthanRScase,whichisconsistentwiththe resultsof[36].4.2. Impulseresponse
TheIRmethodisnowappliedtotheNR,RVSandRSoperating points. A short impulse, δ, is delivered by the loudspeaker S0 at
Fig. 4. Typical response to an impulse delivered by S 0 for the RVS case. Top: elec- trical impulse, δ, sent to the loud speaker; Middle: velocity signal, v ; Bottom: ac- celerometer signal, a .
thebottomoftheplenum(cf.Fig.1):
δ
(
t)
=A 1 IR√π
e−(t/τIR)2 (10)
where AIR=0.94V istheamplitudeoftheelectricsignal sentto
the amplifier and τIR=0.2ms. The time traces recorded forthe
RVScaseareshowninFig.4.Att<0thesystemisstable,thenat
t=0theimpulseisgenerated.Themembraneoftheloudspeaker experiencesastrongaccelerationandreturnstoequilibriuminless than20ms.Theflowvelocityisalsoperturbedbytheimpulseand slowly returns to equilibrium, inabout 400 ms, withoscillations typical ofan under-dampedsystem. Thefactthattheloudspeaker membranereturnstoequilibriumfasterthantheacousticvelocity is a good indication that fluctuationsobserved in the flow vari-ables,correspondtotheresponseoftheburner,ratherthan resid-ual forcing.The accuracyofthismethodislimitedtohighvalues ofsignaltonoiseratio.Significanterrorsoccurwhenthesignalto noiseratiofallsbelow10withrespecttotheinitialamplitude[24]. Inordertoeliminatethehighfrequencynoiseseeninthevelocity signal ofFig.4,theimpulseisrepeated 400timesspacedof10s for each operatingpoint. Finally,the IR isaveraged over the400 samples,increasingthesignaltonoiseratiofrom11to31.
The averaged time traces for p′
0, v′ and q˙′ are presented in
Fig.5,forthethreelinearlystablecasesNR,RVSandRS.While ve-locityshowsamonotonousdecay,pressurefluctuationsinitially in-creaseaftertheimpulseforabouttwocycles.Giventheamplitude oftheexcitation,theinitialheatreleaseratefluctuationsarefairly non-linear, whichis tobe expected[22]. Likeforthe HR method (cf.Fig.2), thepressuresignal forthenon-reactingcaseisnot as cleanasfortheotheroperatingconditions.
For the fit to Eq. (7), the experimental data is restricted be-tween 80% and 10% of its peak amplitude. A typical example of thisfitfortheRVScaseispresentedinFig.6.
Table 4 summarizes the results of the IR method, which are consistentwiththeHRresultsofTable3.
4.3. Activecontrol
The AC method can in principle be applied to all unstable operatingconditions.However,becausetheamplitudeofthe fluc-tuationsareverysmallintheRSUcase,theactivecontroldoesnot bring significantreductionforthisregime.It isthereforeonly ap-pliedto theRUandRVUcases.Theactivecontrol techniqueused in this study is a fixed-coefficients closed-loop controller [26].
Fig. 5. Results for the impulse response method for the three stable operating points (NR, RVS and RS) and the three measured variables (pressure p ′0 , velocity
v′ and heat release rate ˙ q′ . All signals are normalized by their maximum value.
Fig. 6. Velocity signal for the IR method: + RVS operating point, fit with
Eq. (7) .
Table 4
Results for the IR tests applied to the stable cases, NR, RVS and RS.
NR RVS RS f0,nr [Hz] α[s −1 ] f0 [Hz] ν[s −1 ] f0 [Hz] ν[s −1 ] p′0 51.60 −15.20 58.67 −11.53 58.34 −6.67 v′ 51.68 −15.61 59.01 −11.50 58.35 −6.64 ˙ q′ – – 58.91 −11.41 58.38 −6.63 Mean 51.64 −15.41 58.90 −11.48 58.44 −6.65 std. 0.08 0.29 0.12 0.06 0.02 0.02
The signal from the plenum microphone, M0 is phase delayed,
amplified andsent to the speakerS0 mounted on the bottom of
the plenum (cf.Fig. 1). The gain and phaselag of thiscontroller areconstantandidenticalfortheRUandRVUcases.
Figure 7showsthe spectraofthe velocityfluctuationsforthe RVU case, with and without active control. When activated, AC reduces the amplitude of the fundamental frequency by almost 50dB.
The procedure for the AC measurements is based on that of
[26] and is as follows: the controller is turned on and the sys-temiskeptstableforafewseconds;thecontrolisthenturnedoff
Fig. 7. PSD of velocity fluctuations: with active control, without active control.
Fig. 8. Internal acoustic pressure, p ′
0(t) , for a RVU cycle of operation where the active control is switched OFF and ON.
Table 5
Results of the AC method for the RU and RVU operating points.
RU RVU f0 [Hz] ν[s −1 ] f0 [Hz] ν[s −1 ] p′ 0 56.02 1.80 55.00 4.91 v′ 56.01 1.84 54.99 4.93 ˙ q′ 56.01 1.61 55.00 4.38 Mean 56.01 1.75 55.00 4.74 std. 0.00 0.12 0.00 0.31
att=0 andthe instabilitygrows.Atypical time traceofplenum pressurefluctuations, p′
0isshowninFig.8.
Thisprocedureisrepeated40timesandthemeasurementsare phaseaveraged inorderto reducenoise. Figure 9showsthe cor-respondingtracesforRUandRVU,restrictedtotheintervalwhere theamplitudeisbetween20%and60%ofthelimitcycle,whichis considered forpost-processing.It isobviousthat the RVUcaseis themostunstableasittakeslesscyclestoreachtheupperbound. The quantitative results ofthe ACmethod are summarized in
Table 5. The growth rate is larger for the RVU condition, as ex-pectedfromFig.9.Resultsalsoshowverylittledispersion regard-lessofthevariableusedfortheanalysis.
4.4.Whitenoise
Forthe WN method,the stochastic non-coherentnoise is im-posedbytheplenumloudspeakerS0(seeFig.1).Theamplitudeof
Fig. 9. Averaged time traces of the AC test for RU and RVU conditions for the three flow variables, p ′
0 , v ′ and ˙ q′ .
Fig. 10. Power spectral density obtained with the WN method for the stable oper- ating points, NR, RVS and RS.
theadditive whiteGaussiannoise waschosen sothat,inthecase of a systemwithpositive growth rate, ν is atleast one orderof magnitudelargerthantheamplitudeofthenormalizedstochastic forcing level,c0,asrequiredforthe analysis(cf.Section2.4).This
amplitudewaskeptconstantforallstableandunstablecases.The processedsignalsare100slongandtheacquisitionsarerepeated tentimesforeachoperatingpoint,thisisequivalenttohaving sig-nalscontainingapproximately60,000cyclesforunstablecases.
4.4.1. Negativegrowthrate
Whenthesystemislinearlystable,itispossibletoextractthe dampingratebyfittingthepowerspectraldensityoftheflow vari-ables signals withthe second ordermodel givenin Eq.(5).Each 100slongtraceissplitin20equalpartsforwhichthePSDis cal-culated. The resulting200 PSDs are averaged to lower stochastic noiseandtheresultsofthisprocedureareshowninFig.10forthe threelinearlystablecasesNR,RVSandRS.ThePSDsarevery simi-lartotheresultsoftheHRmethod(cf.Fig.2)exceptthattheyare notassmooth.Inordertoillustratethepostprocessingprocedure,
Fig. 11. PSD of velocity fluctuations with the WN method: + RVS operating point, fit with Eq. (5) .
Table 6
Results of the WN method for the stable operating points: NR, RVS and RS.
NR RVS RS f0,nr [Hz] α[s −1 ] f0 [Hz] ν[s −1 ] f0 [Hz] ν[s −1 ] p′0 53.81 −27.12 60.33 −14.81 58.80 −7.91 v′ 51.83 −17.34 59.48 −13.23 58.56 −7.19 ˙ q′ – – 59.50 −13.48 58.53 −6.98 Mean 52.82 −22.23 59.77 −13.84 58.63 −7.63 std. 1.40 6.92 0.49 0.85 0.15 0.49
Fig.11showsthefitwithEq.(5)oftheacousticvelocityspectrum fortheRVScase.
The quantitative resultsofthe WN methodforthecases with negativegrowthratesaresummarizedinTable6.Theseresultsare consistent withthat of theHR methods (cf. Table3):the predic-tionofthefrequencyarewithin 1Hzbutthedampingis system-atically overestimatedby the WN method,especially forthe RVS casewhereitis50%larger.
4.4.2. Positivegrowthrate
For the linearly unstable conditions (RSU, RU and RVU), the
damping rate of the system is obtained with the WN method
[21] by fitting the PSD of limit-cycle amplitude variations with
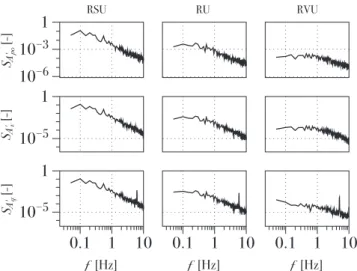
Eq.(9).SimilartothelinearlystablecasesanalyzedinSection4.4.1, each 100 s trace is split in 5 equal parts, then the PSD of the magnitudeof theanalytic signal (i.e.theoriginal signal +itimes its Hilberttransform)iscalculatedforeachinterval.Theresulting 50PSDsare averaged,whichreducesthehighfrequencynoiseby 10 dB andare presented inFig. 12 for the forthe three linearly unstable operatingpoints. Qualitatively, Fig. 12 suggests that the cut-off frequencyinthePSDofthelimit-cycleamplitudeincreases from the RSU to the RUand RVUcases. Using Eq.(9), this indi-catesthat thegrowthrateincreases.Thesharppeakaround8Hz inthespectraofheatreleaseratecorrespondstotheflickeringof the flame dueto buoyancy. Thisperturbation is restrictedto the burntgasesandthereforenotmeasuredinthepressureand veloc-itysignals.
ThepostprocessingprocedureisillustratedinFig.13,showing how the experimentalPSDof thevelocity signal forRSU isfitto
Eq.(9).
Finally, the results of the WN method applied to the linearly unstablecasesaresummarizedinTable7.ComparingwiththeAC method presented in Table 5, thepredictions of ω 0 are virtually
identical.Thegrowthratesdeterminationsaresimilarwithina15% range.
Fig. 12. PSD of the limit-cycle amplitude variations obtained with the WN method for the unstable operating points: RSU, RU and RVU.
Fig. 13. Spectrum of limit-cycle amplitude variations for the velocity: + RVU oper- ating point, fit with Eq. (9).
Table 7
Results of the WN method for the linearly unstable operating points: RSU, RU and RVU. RSU RU RVU f0 [Hz] ν[s −1 ] f0 [Hz] ν[s −1 ] f0 [Hz] ν[s −1 ] p′0 56.22 0.50 55.94 1.70 54.97 5.62 v′ 56.22 0.50 55.94 1.63 54.97 5.21 ˙ q′ 56.22 0.55 55.94 1.46 54.97 5.22 Mean 56.22 0.51 55.94 1.60 54.97 5.35 std. 0.00 0.03 0.00 0.12 0.00 0.23 4.5. Summary
The measurements of f0 and
ν
obtained with the fourtech-niques on the five operating points are summarized in Fig. 14, where each symbol corresponds to the mean value of all three flow variables foreach operatingpoint. Forthe NRcase, because the pressure PSD are noisy,the evaluationwith the HR andWN methods were discarded. All identificationmethods show consis-tent resultsfortheresonancefrequency,withadispersionusually smallerthan1Hz.Thegrowth/dampingratespredictionsarealso surprisinglygathered.Thelargestdispersionbetweenidentification methods isfoundfortheRVS casebutno specificreasonforthis largerscatterisforeseen.
Fig. 14. Summary of all measurements for the determination of the frequency and growth rate of the first eigenmode of the slot burner.
5. Validation
Atthispointitisinterestingtotryandpredictthestabilitymap ofFig.14.Forthispurpose,alow-ordermodelofthepresent slot burnerisnowgiven,basedonpreviousstudies[22,35,37].Because thecombustioninstability isherelockedon theHelmholtzmode ofthe plenum, one can derive an analytical model valid forthis specificmode.Forharmonicvelocityperturbations,
v
′=v
˜e−iωt,thesystemobeysasecond-orderequation forthepulsation ω,which maybewrittenintheform[20,36]:
£
1+Neiωτ
¤ω
2+2i
α ω
−ω
20,nr=0 (11)
where ω 0,nr isthe resonance frequencyand α the dampingrate
of the system, both under non-reacting conditions. The fact that
ω
0,nrand αcorrespondtonon-reactingconditionsstemsfromthederivationofthemodel[35–37].Theinfluenceoftheflameis mod-eled by an interaction index, N, anda time delay, τ, whichare linked to the Flame Transfer Function (FTF). The FTF, F
(
ω
)
, isa complex numbermeasuring the response ofthe flame to acous-tics,andisexpressedastheratiooftherelativeheatreleaserate fluctuations,q˙′/q,¯˙ totheincomingvelocityfluctuations,v
′/v
¯:F
(
ω
)
=q˙ ′/¯˙qv
′/v
¯ =G
(
ω
)
eiϕ (12)whereG isthegainoftheFTFand ϕ itsphase,whichislinkedto thetimedelay, τ,oftheflamethrough ϕ =
ωτ
.Then,the interac-tionindex,N,isdefinedas:N =CG
(
ω
)
(13)whereC isafactoraccountingforsoundradiationfromtheflame, depending onthe burner geometryandtheoperating conditions. FollowingtheworkofPriceetal.[34]:
C= 1 4
π
Ss h E− 1 r (14)whereSs=10−3 m2 istheslot crosssection,h
=0.106mthe ef-fective height of the slot3 andE is the ratio of the fresh to the burnt-gasesdensity.Echangesbecausetheequivalenceratioisnot thesameforallcases.Itiscomputedbyanequilibriumcalculation withtheCanterasoftware.Thedistancebetweenthenoisesource
3 Two corrections must be applied to h in order to account for the converging section upstream of the slot and the classical end-correction at the exit [36] .
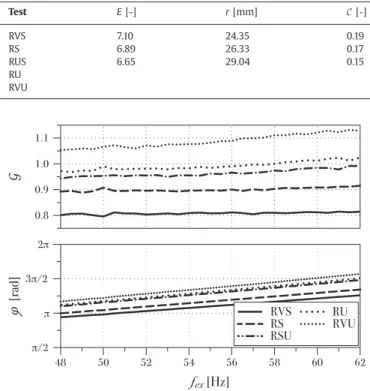
Table 8
Combustion noise parameters for the various operating conditions.
Test E [-] r [mm] C[-] RVS 7.10 24.35 0.19 RS 6.89 26.33 0.17 RUS 6.65 29.04 0.15 RU RVU
Fig. 15. FTF of the five reacting cases of Table 2 . Gain, G (top) and phase ϕ (bot- tom).
andthe burneroutletis denotedrandit isobtainedfromdirect visualizationasthelocationwheretheflamepinches[22].The nu-mericalvaluesofE,randCandarerecalledinTable8.
Thestabilityofthesystemisdeterminedbythecomplexroots,
ω
=ω
0+iν
, of Eq.(11),which can be solved once the valuesofN, τ, ω 0,nr and α are known. This is the classical paradigm of
stabilitymappredictionwithanacousticsolver:onemustknowa priori theresponseoftheflameandtheacousticdampingrateof thesetup.Therequirementtoknow ω 0,nrisspecifictothepresent
model,whichisvalidfora flamelockedonaHelmholtzmode.A moregeneric methodology, usingforexamplea Helmholtzsolver does notrequiretheapriori knowledgeoftheeigenmodes.Using theresultsofSection4intheNRcase,thevalues f0,nr=52.50Hz
and α=16.94s−1areused.
Finally,theFTFareobtainedbytheclassicalprocedureof send-ing a small amplitude harmonic signal through the speaker S0.
The flamemustbestableinordertomeasuretheFTFandas ex-plained in[36],asimplewaytostabilizethissetup istoincrease the height oftheslot. Thismodification does not alter theflame but shifts down the frequency of the Helmholtz mode. For the measurement ofthe FTFin theRSU,RU andRVUconditions,the height is increasedto150 mm,resulting instablecombustion. It wascheckedforthestableoperatingpointsthattheFTFsmeasured with a 150mm slot and70 mm slotare identical. Onlythe fre-quencyrange[48,62]Hzisneededforthisstudy.Heatreleaserate andvelocityfluctuationsare recordedsimultaneouslybythe pho-tomultiplier andthe hot-wire probe, respectively (cf. Fig. 1). The levelofrmsvelocityfluctuationiskeptconstantat10%ofthebulk velocity(
v
b=1.8m/s)forallfrequencies.Figure15showsthegainandthephaseoftheFTFforthefivereactingoperatingpoints,RVS, RS, RSU, RU,RVU. Because inthe range ofinterest both the gain andthe phaseof theFTFvary linearlywith ω,forthenumerical resolutionofEq.(11),theywereinterpolatedwithlinearfunctions. It should be pointedout that, for all operatingpoints, the phase oftheFTFisbetween[
π
,2π
]atthefrequencyoftheeigenmode,Fig. 16. Validation of Eq. (11) for the prediction of the frequency, f 0 and growth rate, νof the eigenmode of the slot burner.
i.e. [57,59]Hz. Thus, the necessarycondition foran instability to develop,resultingfromtheRayleighcriterionisfulfilled[22]. Nev-ertheless, only RSU RU RVS are unstable. The reason isthat this condition isnecessarybutnosufficient:inordertotriggeran in-stabilitythegainoftheFTFmustbelargeenoughtoovercomethe various acousticlosses, which is not the casefor the RVS an RS conditions.
ThesolutionsofEq.(11)arepresentedinFig.16.Itisclearthat thepredictionsofEq.(11)closelyfollowtheexperimentaldataand always recover the proper stability of the eigenmode. While the frequencies typically matchbylessthan 5%,the growthratesare systematicallyoverestimatedbyafewHzforthereactingcases.
6. Conclusion
Four methods werepresented forthe experimental evaluation ofthegrowth(ordamping)rateassociatedwithanacoustic eigen-mode. The objectiveis thedetailed analysisofcombustion insta-bilities, either for the mitigation of unstable modes, or the as-sessment ofthe distanceto the stability limit fora stablemode. These methodswere testedon fiveoperating points ofa laminar slot burner: two stableandthree unstable.The evaluationofthe frequencyandgrowthratewereconsistent betweenthemethods, givingconfidencefortheirapplication.
Then a low-order model of the slot burner was derived for
the predictionofits stability.Themodelwasfed byFlame Trans-ferFunctionsobtainedexperimentallyanditssolutionswere com-paredtothe experiment.Boththefrequencyandthegrowthrate of the eigenmode were predicted with good accuracy for stable and unstable operating conditions.These results give a clear in-dicationthattheoverallmethodologyoffeedinglow-ordermodels oracousticsolversbyFTFissoundandaccurate,evenclosetothe stabilitylimit.
Itissuggestedthatthesemethodsbeusedmoresystematically onlaboratoryandindustrialburnersbecausetheyprovidethe dis-tancetothestabilitylimit,whichisveryusefulfortheassessment oftherobustness ofagivendesign.Nevertheless,notallmethods are suitable forall systemsandsome practical limitationsshould be discussed.Forexample,installing actuatorssuchas loudspeak-ersinside combustionchambersisnotalways possible,especially on industrialburnerswithcompactgeometries. Insuch situation, iftheflowisturbulent,theWNmethodpresentedinSection2.4is a goodoption.Also,theHR andWNamethodsassume thatthere
to be sufficientlyfarfromeach other.Thismaylimit theiruse in systemswherethemodaldensityishigh.InthesecasestheIR,AC orWNbmethodsmaybetried.
Acknowledgments
Theresearchleadingtotheseresultshasreceivedfundingfrom the European Research Council under the European Union’s Sev-enth Framework Programme (FP/2007-2013) / ERC Grant Agree-mentERC-AdG319067-INTECOCIS.
References
[1] T.C. Lieuwen , Unsteady combustor physics, Cambridge University Press, 2012 .
[2] F. Culick , Unsteady motions in combustion chambers for propulsion systems, NATO/RTO-AG-AVT-039, 2006 .
[3] L. Boyer , J. Quinard , On the dynamics of anchored flames, Combust. Flame 82 (1) (1990) 51–65 .
[4] T. Schuller , D. Durox , S. Candel , Dynamics of and noise radiated by a perturbed impinging premixed jet flame, Combust. Flame 128 (1-2) (2002) 88–110 .
[5] H.Y. Wang , C.K. Law , T. Lieuwen , Linear response of stretch-affected premixed flames to flow oscillations, Combust. Flame 156 (4) (2009) 889–895 .
[6] R.S. Blumenthal , P. Subramanian , R. Sujith , W. Polifke , Novel perspectives on the dynamics of premixed flames, Combust. Flame 160 (7) (2013) 1215– 1224 .
[7] T. Schuller , D. Durox , S. Candel , A unified model for the prediction of laminar flame transfer functions comparisons between conical and V-flame dynamics, Combust. Flame 134 (1-2) (2003) 21–34 .
[8] A. Cuquel , D. Durox , T. Schuller , Impact of flame base dynamics on the non– linear frequency response of conical flames, Comptes Rendus Mécanique 341 (1-2) (2013) 171–180 .
[9] K. Kim , J. Lee , B. Quay , D. Santavicca , Response of partially premixed flames to acoustic velocity and equivalence ratio perturbations, Combust. Flame 157 (9) (2010) 1731–1744 .
[10] D. Durox , J.P. Moeck , J.-F. Bourgouin , P. Morenton , M. Viallon , T. Schuller , S. Candel , Flame dynamics of a variable swirl number system and instability control, Combust. Flame 160 (9) (2013) 1729–1742 .
[11] B. ´Cosi ´c , S. Terhaar , J.P. Moeck , C.O. Paschereit , Response of a swirl-stabilized flame to simultaneous perturbations in equivalence ratio and velocity at high oscillation amplitudes, Combust. Flame 162 (2014) 1046–1062 .
[12] A. Giauque , L. Selle , L. Gicquel , T. Poinsot , H. Buechner , P. Kaufmann , W. Krebs , System identification of a large-scale swirled partially premixed combustor us- ing LES and measurements, J. Turbul. 6 (February 2012) (2005) N21 .
[13] L. Chong , T. Komarek , R. Kaess , S. Föller , W. Polifke , Identification of flame transfer functions from LES of a premixed swirl burner, Proceedings of the ASME Turbo Expo 2010 Power Land, Sea Air, ASME, Glasgow (2010) .
[14] X. Han , J. Li , A.S. Morgans , Prediction of combustion instability limit cycle os- cillations by combining flame describing function simulations with a thermoa- coustic network model, Combust. Flame 162 (10) (2015) 1–16 .
[15] P. Wolf , G. Staffelbach , L.Y. Gicquel , J.-D. Müller , T. Poinsot , Acoustic and large Eddy simulation studies of azimuthal modes in annular combustion chambers, Combust. Flame 159 (11) (2012) 3398–3413 .
[16] L. Selle , R. Blouquin , M. Théron , L.-H. Dorey , M. Schmid , W. Anderson , Pre- diction and analysis of combustion instabilities in a model rocket engine, J. Propuls. Power 30 (4) (2014) 978–990 .
[17] N. Noiray , D. Durox , T. Schuller , S. Candel , A unified framework for nonlinear combustion instability analysis based on the flame describing function, J. Fluid Mech. 615 (2008) 139 .
[18] J. Pieringer , T. Sattelmayer , F. Fassl , Simulation of combustion instabilities in liquid rocket engines with acoustic perturbation equations, J. Propuls. Power 25 (5) (2009) 1020–1031 .
[19] C.F. Silva , F. Nicoud , T. Schuller , D. Durox , S. Candel , Combining a Helmholtz solver with the flame describing function to assess combustion instability in a premixed swirled combustor, Combust. Flame 160 (9) (2013) 1743–1754 .
[20] D. Mejia , L. Selle , R. Bazile , T. Poinsot , Wall-temperature effects on flame re- sponse to acoustic oscillations, Proc. Combust. Inst. 35 (3) (2015) 3201–3208 .
[21] N. Noiray , B. Schuermans ,Deterministic quantities characterizing noise driven Hopf bifurcations in gas turbine combustors, Int. J. Non. Linear. Mech. 50 (2013) 152–163 .
[22] T. Schuller , D. Durox , S. Candel , Self-induced combustion oscillations of laminar premixed flames stabilized on annular burners, Combust. Flame 135 (4) (2003) 525–537 .
[23] P. Palies , D. Durox , T. Schuller , S. Candel , Nonlinear combustion instability anal- ysis based on the flame describing function applied to turbulent premixed swirling flames, Combust. Flame 158 (10) (2011) 1980–1991 .
[24] M. Wagner , C. Jörg , T. Sattelmayer , Experimentally determining the acoustic damping rates of a combustor with a swirl stabilized lean premixed flame, Proceedings of the ASME Turbo Expo 2013 (2013), pp. 1–11 . GT2013-94844. [25] G.J. Bloxsidge , A.P. Dowling , N. Hooper , P.J. Langhorne , Active control of an
acoustically driven combustion instability, J. Mec. Theor. Appl. Suppl. 6 (1987) 161–175 .
[26] W. Lang , T. Poinsot , S. Candel , Active control of combustion instability, Com- bust. Flame 70 (3) (1987) 281–289 .
[27] T. Poinsot , B. Yip , D. Veynante , A. Trouve , J.M. Samaiego , S. Candel , Active control: an investigation method for combustion instabilities, J. Phys. III 2 (7) (1992) 1331–1357 .
[28] K.R. McManus , T. Poinsot , S. Candel , A review of active control of combustion instabilities, Prog. Energy Combust. Sci. 19 (1) (1993) 1–29 .
[29] A.M. Annaswamy , M. Fleifil , J.W. Rumsey , R. Prasanth , J.P. Hathout , A.F. Ghoniem , Thermoacoustic instability: model-based optimal control designs and experimental validation, IEEE Trans. Control Syst. Technol. 8 (6) (20 0 0) 905–918 .
[30] M.R. Bothien , J.P. Moeck , C.O. Paschereit , Comparison of linear stability analy- sis with experiments by actively tuning the acoustic boundary conditions of a premixed combustor, J. Eng. Gas Turb. Power 132 (12) (2010) 121502 .
[31] M.A. Heckl , Active control of the noise from a rijke tube, J. Sound Vib. 124 (1) (1988) 117–133 .
[32] N. Stadlmair , M. Wagner , C. Hirsch , T. Sattelmayer , Experimentally determining the acoustic damping rates of a combustor with a swirl stabilized lean pre- mixed flame, Proceedings of ASME Turbo Expo 2015 (2015), pp. 1–10 . GT2015- 42683.
[33] L. Selle , T. Poinsot , B. Ferret ,Experimental and numerical study of the accuracy of flame-speed measurements for methane/air combustion in a slot burner, Combust. Flame 158 (1) (2011) 146–154 .
[34] R. Price , I. Hurle , T. Sugden , Optical studies of the generation of noise in tur- bulent flames, Symp. Combust. 12 (1) (1969) 1093–1102 .
[35] D. Durox , T. Schuller , N. Noiray , A. Birbaud , S. Candel , Rayleigh criterion and acoustic energy balance in unconfined self-sustained oscillating flames, Com- bust. Flame 156 (1) (2009) 106–119 .
[36] D. Mejia , Wall-temperature effects on flame response to acoustic oscillations, Université de Toulouse, 2014 Ph.D. thesis .
[37] D. Durox , T. Schuller , S. Candel , Self-induced instability of a premixed jet flame impinging on a plate, Proc. Combust. Inst. 29 (2002) 69–75 .