Disentangling the Quebec fertility paradox:
The recent evolution of fertility within marriage
and consensual union in Quebec and Ontario
Benoît Laplante
1Ana Laura Fostik
AbstractThis article analyzes the relation between conjugal status and fertility in Quebec. We use data from three censuses to estimate a series of fertility measures within marriage and within co-habitation. We use a comparative approach and look at the relationship between conjugal status and fertility within groups defined by language, place of birth, and place of residence. Results show that childbearing within cohabitation is typical of French-speaking Quebeckers, and that in this group, fertility is now mainly concentrated among cohabiting couples. Given that fertility is now currently slightly higher in Quebec than in Ontario, cohabitation cannot be deemed the cause of low fertility.
Keywords: fertility; marriage; cohabitation; Quebec (province); Total Fertility Rate. Résumé
Cet article cherche à élucider la relation entre la situation conjugale et la fécondité au Québec. Nous estimons une série de mesures de la fécondité du mariage et de l’union libre à partir des données de trois recensements. Nous comparons la relation entre la situation conjugale et la fé-condité au sein de groupes définis par la langue, le lieu de naissance et le lieu de résidence. Avoir un enfant au sein de l’union libre est typique des Francophones du Québec. Dans ce groupe, la fécondité est aujourd’hui principalement concentrée parmi les couples qui vivent en union libre. Comme la fécondité est maintenant légèrement plus élevée au Québec qu’en Ontario, on ne peut plus soutenir que l’union libre explique la faible fécondité.
Mots-clés : fécondité; mariage; union libre; Québec (province); indice synthétique de fécondité.
Introduction
Since the mid-1980s, the importance of consensual union has joined civil law and French as the majority language among the features that single out Quebec from the rest of Canada. Consensual union was already more common in Quebec than in most other provinces in 1981, when census data were first used to estimate heterosexual “common-law” relationships, but not much more than in
1. Benoît Laplante, Centre Urbanisation Culture Société, Institut national de la recherche scientifique, 385, rue Sherbrooke Est, Montréal PQ H2X 1E3. Email: Benoit.Laplante@UCS.INRS.Ca; Ana Laura Fostik, Centre Urbanisation Culture Société, Institut national de la recherche scientifique.
Canadian Studies in Population 42, no. 1–2 (2015)
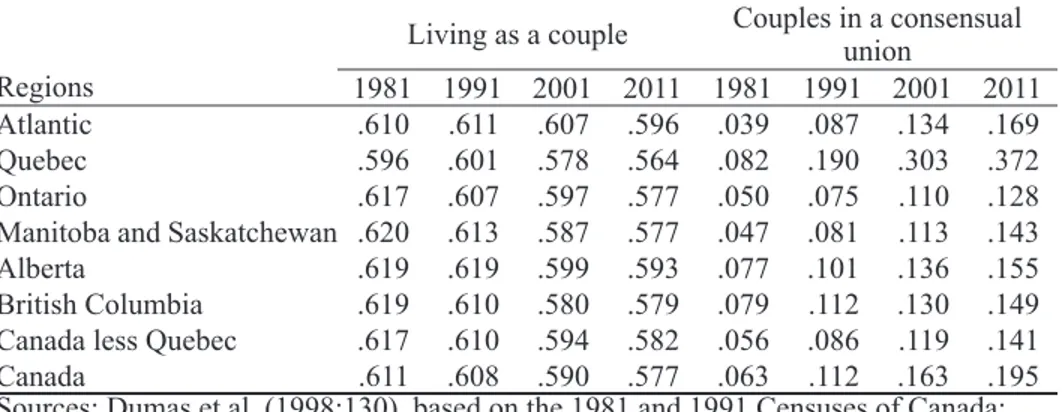
British Columbia or Alberta. However, the gap between Quebec and the rest of Canada was clear by the 1986 Census, and has become wider since (Table 1).
Since the mid-1990s, most children born in Quebec are born to women living in a consensual union. Given the spread of consensual union in the province, this does not come as a surprise. Still, something is intriguing. After a few decades during which fertility was lower in Quebec than in neighbouring Ontario, it is now slightly higher. However, conventional wisdom, at least in Canada, is that fertility is lower within consensual unions than within marriages. This notion cannot be easily reconciled with fertility being currently higher in Quebec than in Ontario, which leads to a paradox.
This article is an attempt at disentangling the relation between conjugal status and fertility in Quebec. We use data from three censuses to estimate a series of fertility measures for the various states of conjugal status, i.e., living alone, living in a consensual union, and living with one’s spouse. Given that previous research has stressed the importance of cultural channels and boundaries in the spread of consensual union in Quebec and Canada, we use a comparative approach and look at the relationship between conjugal status and fertility within groups defined by language, place of birth, and place of residence.
Context
Canada is among the few Western countries that have fully turned consensual union into a social, legal, and statistical institution. A series of rulings of the Supreme Court, changes in statute law in the common-law provinces, and to statute law and the Civil Code in Quebec have progressively re-duced the differences between married and unmarried couples. In their dealings with the State and with other parties (employers, insurance companies, etc.), married and unmarried couples are treated in the same way. Legal rights and obligations between parents and children depend solely on filiation, not on the circumstances of birth. This legal recognition is extended to foreigners: Canadian immi-gration law handles married couples and couples living in a consensual union the same way. Statistics Canada has gathered and published information on consensual unions since the mid-1980s, using the terms living common-law in English and union libre in French. The remaining differences between married and unmarried couples are mainly limited to the degree of economic dependence between
Table 1. Proportion of the population aged 15 or more living as a couple and of couples in consensual union, Canada and regions, decennial censuses, 1981–2011.
Regions
Living as a couple Couples in a consensual union 1981 1991 2001 2011 1981 1991 2001 2011
Atlantic .610 .611 .607 .596 .039 .087 .134 .169
Quebec .596 .601 .578 .564 .082 .190 .303 .372
Ontario .617 .607 .597 .577 .050 .075 .110 .128
Manitoba and Saskatchewan .620 .613 .587 .577 .047 .081 .113 .143
Alberta .619 .619 .599 .593 .077 .101 .136 .155
British Columbia .619 .610 .580 .579 .079 .112 .130 .149 Canada less Quebec .617 .610 .594 .582 .056 .086 .119 .141
Canada .611 .608 .590 .577 .063 .112 .163 .195
Sources: Dumas et al. (1998:130), based on the 1981 and 1991 Censuses of Canada; author’s estimation based on the 2.7 per cent sample Public Use Microdata File of the 2001 Census of Canada; authors’ estimation based on Statistics Canada’s Topic-based tabulation 98-312-XCB2011039 of the 2011 Census of Canada.
Laplante and Fostik: The recent evolution of fertility within marriage and consensual union in Quebec and Ontario the two persons who live together, and they are a consequence of competing visions of individual autonomy within the couple rather than a form of discrimination (see Leckey 2014; Laplante 2014b, 2014c).
Despite many aspects of the legal treatment of consensual union being the same throughout Canada, consensual union is more widespread in Quebec than in the rest of the country. Research shows that it also has a different social meaning in Quebec than elsewhere in Canada. Kerr et al. (2006) established that in Quebec, living in a consensual union is not associated with low income the way it is in the rest of Canada, or typically is in the USA. Stalker and Ornstein (2013) reported that outside Quebec, unmarried parents of pre-school children are predominantly young and poor, whereas in Quebec, they are far more diverse and less different from married parents. Other studies have shown that in Quebec, marriage and consensual union do not differ in some of their outcomes in the way they do, or are assumed to do, in the rest of Canada. For instance, Laplante and Flick (2010) showed that while in Ontario married people are prone to be in better health than people living in a consensual union, there is little difference between the two groups in Quebec. Lardoux and Pelletier (2012) showed that for boys, there is no association between school success and having parents living in a consensual union, whereas for girls, the association is positive (sic).
Many studies on the diffusion of consensual union in Quebec have acknowledged or emphasised its relation with language without exploring the relation further (e.g., Turcotte and Bélanger 1997; Pollard and Wu 1998; Ravanera et al. 1998; Turcotte and Goldscheider 1998; Bélanger and Turcotte 1999; Wu 2000). However, some have explored the matter further, and clearly stated that within Que-bec, consensual union is concentrated among the native French-speaking (Lachapelle 2007; Laplante 2014a), and that the reasons why this is so have to do with historical, social, legal, and cultural factors rather than with education or economic factors (Le Bourdais and Lapierre-Adamcyk 2004; Laplante 2006; Laplante, Miller, and Malherbe 2006). We follow the latter line and focus our study of fertility within marriage and consensual union on the differences between groups defined by characteristics related to culture. Among the groups that make up the Quebec population besides the French-speaking majority—i.e., the native English-French-speaking, internal migrants from elsewhere in Canada and
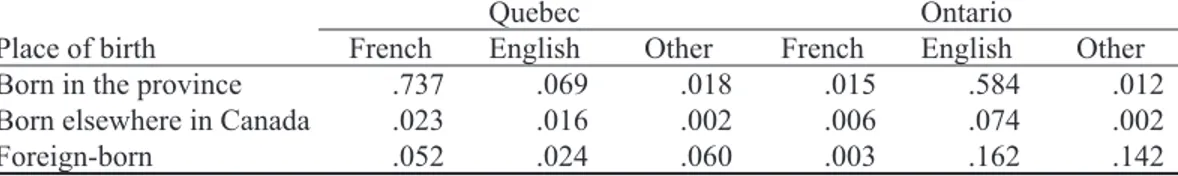
Table 2. Composition of the population of women aged 15–49 according to main language spoken at home and place of birth, Quebec and Ontario, 2006.
Quebec Ontario
Place of birth French English Other French English Other
Born in the province .737 .069 .018 .015 .584 .012
Born elsewhere in Canada .023 .016 .002 .006 .074 .002
Foreign-born .052 .024 .060 .003 .162 .142
Source: Census of Canada 2006, 20 per cent sample. Weighted estimation.
Reading: .737 of Quebec women aged 15-49 are born in Quebec and mainly speak French at home. Table 3. Proportion of the population of women aged 15–49 living in a consensual union by place of birth, Quebec and Ontario, main language spoken at home, 2006.
Quebec Ontario
Place of birth French English Other French English Other
Born in the province .324 .108 .126 .132 .105 .049
Born elsewhere in Canada .301 .175 .187 .210 .141 .114
Foreign-born .142 .086 .044 .066 .065 .027
Source: Census of Canada 2006, 20 per cent sample. Weighted estimation.
Reading: .324 of Quebec women aged 15-49 born in Quebec and mainlying speak French at home live in a consensual union.
Canadian Studies in Population 42, no. 1–2 (2015)
immigrants—consensual union is no more common than in the rest of Canada (see Tables 2 and 3). The renewed interest for culture in demography (Bachrach 2014) provides an opportunity for a detailed examination of the relation between demographic behaviour and cultural attributes.
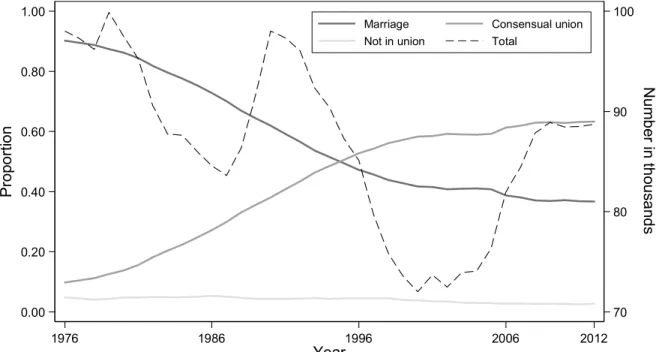
A rather obvious consequence of the importance of consensual union in Quebec is that since the mid-1990s, more than half of children are born to unmarried parents (see Figure 1). A more intriguing consequence is that since the beginning of the diffusion of consensual union in Quebec, the increase in the proportion of women in their reproductive years who live in a consensual union seems completely unrelated to the evolution of fertility as measured by the total fertility rate (TFR). Even more intriguing, from the mid-1980s, when consensual union started to become widespread, until the late 2000s, the TFR of Quebec does not seem to have behaved very differently from the TFR of Ontario, where it had been decreasing since the late 1950s (see Figure 2). Furthermore, since the late 2000s, age-specific fertility rates have increased in Quebec much in the same way they have in the rest of Canada (Statistics Canada 2012) and in other developed countries (Goldstein et al. 2009), and are now higher in Quebec than in Ontario. The rise in both Quebec and Ontario TFR could be largely a consequence of the decline in the pace of fertility postponement, as Bongaarts and Sobotka (2012) suggested it is in Europe, but the Quebec TFR not being lower than that of Ontario remains at odds with conventional wisdom. Evidence points to the fact that, in Quebec, the high level of consensual union has little or no negative effect on fertility.
The lack of strong differences between the evolution of fertility in Quebec and Ontario runs contrary to what has long and is still being taken for granted, at least in Canada: fertility is sup-posed to be lower within consensual union than within marriage. In her study of Quebec women’s reproductive life, Rochon (1989) found that within age groups, women who live or have lived in a consensual union had fewer children, on average, than women who were married or had been
mar-Figure 1. Proportion of births according to the conjugal status of the mother (left scale) and total number of births (right scale), Quebec, 1976-2012.
Source: Births according to marital status of parents, Quebec, 1951–2012 [Naissances selon l’état matrimonial des parents, Québec, 1951-2012], Institut de la statistique du Québec.
21
Figure 1. Proportion of births according to the conjugal status of the mother (left scale)
and total number of births (right scale), Quebec, 1976-2012.
Source: Births according to marital status of parents, Quebec, 1951–2012 [Naissances
selon l’état matrimonial des parents, Québec, 1951-2012], Institut de la statistique du Québec. 70 80 90 100 N umb er in t hou sa nd s 0.00 0.20 0.40 0.60 0.80 1.00 P ro port ion 1976 1986 1996 2006 2012 Year
Marriage Consensual union
Not in union Total
21
Figure 1. Proportion of births according to the conjugal status of the mother (left scale)
and total number of births (right scale), Quebec, 1976-2012.
Source: Births according to marital status of parents, Quebec, 1951–2012 [Naissances selon l’état matrimonial des parents, Québec, 1951-2012], Institut de la statistique du Québec. 70 80 90 100 N umb er in t hou sa nd s 0.00 0.20 0.40 0.60 0.80 1.00 P ro port ion 1976 1986 1996 2006 2012 Year
Marriage Consensual union Not in union Total
Laplante and Fostik: The recent evolution of fertility within marriage and consensual union in Quebec and Ontario
ried. According to Caldwell (1991) and Caldwell et al. (1994), the high proportion of consensual unions among Quebec women born between 1952 and 1956 and the instability of their chosen form of union explained their high level of childlessness. Dumas et al. (1998) concluded that fertility is lower within consensual union than within marriage. Krull and Trovato (2003) found that low mar-riage rates among Quebec women were a key factor of Quebec’s low fertility in the 1990s. Lapierre-Adamcyk and Lussier (2003) also found that the overall impact of consensual union in Quebec is to reduce general fertility. Caron-Malenfant and Bélanger (2006: 88) reported results in which fertility is lower for women living in a consensual union than for married women, as did more recent research (St-Amour 2013). If common wisdom holds, given the importance of consensual union in Quebec, its TFR should be lower than that of Ontario.
The recent rise in Quebec fertility also made obsolete the notion that immigration was a key fac-tor in explaining the difference in fertility between the two provinces. Gauthier (1989) tried to make a case for that explanation, basing it on fertility estimations of immigrant women that showed it to be higher than that of native women. True, immigration was and is still higher in Ontario than in Quebec: according to the 2011 National Household Survey (Statistics Canada 2013), the proportion of the foreign-born is 28.5 per cent in Ontario and only 12.6 per cent in Quebec. However, recent research shows that fertility among immigrant women, usually estimated using census data and the TFR, is overestimated, as most immigrant women delay the birth of their next child until after land-ing in their new country. Because of this delay, the TFR systematically overestimates immigrants’ completed fertility (Toulemon 2004, 2006; Toulemon and Mazuy 2004). Other research shows that this result holds for Quebec (Street and Laplante 2014).22
Figure 2. Total fertility rate, Quebec and Ontario, 1976–2011.
Source: Statistics Canada (1997),Births and Deaths, 1995, Table 3.5, 84-210-XPB;
Statistics Canada (2003), Report on the Demographic Situation in Canada 2002: Current Demographic Analysis for Canada, 2002, Table A.6, 91-209-XIE; Statistics Canada, CANSIM Table 102-4505 - Crude birth rate, age-specific and total fertility rates (live births), Canada, provinces and territories, annual (rate).
1.40 1.50 1.60 1.70 Tota l fe rtil ity ra te 1976 1981 1986 1991 1996 2001 2006 2011 Year Quebec Ontario 22
Figure 2. Total fertility rate, Quebec and Ontario, 1976–2011.
Source: Statistics Canada (1997),Births and Deaths, 1995, Table 3.5, 84-210-XPB;
Statistics Canada (2003), Report on the Demographic Situation in Canada 2002: Current Demographic Analysis for Canada, 2002, Table A.6, 91-209-XIE; Statistics Canada, CANSIM Table 102-4505 - Crude birth rate, age-specific and total fertility rates (live births), Canada, provinces and territories, annual (rate).
1.40 1.50 1.60 1.70 Tota l fe rtil ity ra te 1976 1981 1986 1991 1996 2001 2006 2011 Year Quebec Ontario
Figure 2. Total fertility rate, Quebec and Ontario, 1976–2011.
Sources: Statistics Canada (1997),Births and Deaths, 1995, Table 3.5, 84-210-XPB; Statistics Canada (2003), Report on the Demographic Situation in Canada 2002: Current Demographic Analysis for Canada, 2002, Table A.6, 91-209-XIE; Statistics Canada, CANSIM Table 102-4505 - Crude birth rate, age-specific and total fertility rates (live births), Canada, provinces and territories, annual (rate).
Canadian Studies in Population 42, no. 1–2 (2015)
The Quebec fertility rise fostered interest in explanations of a different nature. Beaujot and Wang (2010) and Beaujot et al. (2013) focused on the economic factors involved in the decision to have a child. They acknowledged the rise in fertility that occurred in Quebec, and stressed the role that the family policy developed in Quebec by successive governments since the end of the 1980s and roughly inspired by the Nordic model—mainly subsidized low-cost child care and more flexible and generous parental leaves than in the rest of Canada—may have played in that rise. They mentioned that consensual union is more common in Quebec than in Ontario, but did not discuss its relation with fertility, and apparently did not realise that their explanation implies that policies should have the same effect on married and unmarried couples, but also that fertility should be the same within consensual union and marriage.
The prevalence of consensual union and the level of fertility within consensual union are two related but different questions. Although it may seem straightforward to suppose fertility within consensual union to be similar to that of marriage in contexts where consensual union is widespread and an accepted form of family living, it is not necessarily the case. In Latin American countries, for instance, fertility within marriage and consensual union has been similar for several decades, even before the spread of consensual union (Esteve et al. 2012; Laplante et al. 2015). However, fertility may be higher within consensual union than in marriage if women who live in consensual union have limited access to contraception because of poor education or lack of resources (Verdugo Lazo 1994).
We know from Table 3 that overall, consensual union is more common among French-speaking Quebeckers than among other Canadians: the proportion of women aged 15–49 living in a consen-sual union is 32.4 per cent among French-speaking Quebeckers, about the same among the English-speaking in Quebec (10.8 per cent) and in Ontario (10.5 per cent), and not much higher among French-speaking Ontarians (13.2 per cent). However, a detailed analysis of the evolution of the for-mation of the first union through marriage or consensual union showed that entering into the first union through consensual union has become more common among the Quebec English-speaking Protestants than among the Ontario English-speaking Protestants, and more common among the Ontario French-speaking Catholics than among the Ontario English-speaking Catholics (Laplante 2014a). Thus, despite the differences between French-speaking Quebeckers and other groups in the prevalence of consensual union, some structural factors may favour the dissemination of norms or patterns common among French-speaking Quebeckers to other groups. Two such factors are of special interest: law and language.
The spread of consensual union in Quebec is related, among other things, to an amendment to the Civil Code enacted at the end of the 1980s that entrenched a very strict definition and a very broad conception of common property within marriage, even for spouses who choose to keep their property separate (sic).2 In Quebec, the main difference between the two forms of marital union is
that marriage is used to legally uphold economic dependence between the spouses, especially after 2. In civil law, a marriage is a contract. The contract states how property is owned. There are two “regimes”
of property ownership: “partnership of acquests” (société d’acquêts) and “separation as to property” (séparation de biens). Unless they choose otherwise in a written contract registered with a notary—not a notary public, but a civil law notary, i.e., a professional specialized in non-contentious law, member of the professional corporation—spouses live under the partnership of acquests regime. To put it simply, all property acquired from the wedding onwards is deemed common, except inheritance. If they choose to keep their property separate––which is known as the separation as to property regime, each spouse keeps their property separate. In 1989, the Civil Code was amended to define that most of what entails “property” for most people—home and second home, cars, any form of retirement savings or plan, etc.—is dubbed “family patrimony” and is treated as if it were an acquest, even for people who choose to keep their property separate.
Laplante and Fostik: The recent evolution of fertility within marriage and consensual union in Quebec and Ontario breakdown, whereas consensual union leaves to the partners all decisions regarding their level of economic dependence while they live together and does not impose any obligation after breakdown. In Ontario, as in all common-law provinces, the level of economic dependence within the couple is not so different between marriage and consensual union, and it is actually more a continuum, with room for tailored arrangements for individual couples, whether married or living in a consensual union (Laplante 2014b, 2014c). All Quebec residents are subject to the provisions of the Civil Code and, in theory, non-French-speaking Quebeckers could well react to this legal framework in the same way the French-speaking do, and shy away from marriage.
However, language creates channels and boundaries of its own. In advanced societies, the mass media—from books to television—are central in the dissemination of norms and patterns. French-speaking Canada and English-French-speaking Canada are very different in their relation to the mass media. Sharing a common language with the USA, English Canada is a heavy consumer of American cultural products. This is especially striking for television: American networks are broadly available all across Canada, and in a typical week, audience reports show that except for news and some sports, all of the top thirty television programs watched in English-Canada on Canadian stations are from the US (see Table A1 in the Appendix for an example). However, in a typical week, audience reports show that almost all of the top 30 programs watched by the French-speaking Quebec audience on Canadian stations are produced in Quebec—and, of course, in French (Table A2). Most of these programs are drama or sitcoms of various styles and genres, with stories located in Quebec and characters who are French-speaking Quebeckers. Other programs are talk shows with gossip content. These local pro-ductions, as well as written fiction and women’s magazines, disseminate and reinforce ideas and pat-terns—or sets of norms, beliefs, and attitudes—about family and conjugal life that exist and evolve with little interference from the ideas and patterns typical of English-speaking Canadians, who may live next door but actually live in a very different normative world. The linguistic channels and bar-riers we are suggesting are akin to the structures and mechanisms that support the “communication communities” introduced by Szreter (1996) in his study of fertility decline in the UK. Closer to our topic, recent research by Le Goff (2013) illustrates that linguistic channels and barriers have played a key role in the diffusion of out-of-wedlock births in Switzerland. The social significance of this dif-ference should not be underestimated: it even shapes space. Within the Montreal metropolitan area, immigrants, internal migrants from elsewhere in Canada, and native English-speakers tend to locate towards the middle, with a high concentration in the western part of the Island of Montreal. Con-sequently, the spatial distribution of families with children, in which parents are living in a consensual union, closely matches the spatial distribution of French as the main language spoken at home. Such a distribution suggests that schooling, which is organised along linguistic and geographical bound-aries, is also likely to reinforce this difference between language groups, as children are exposed to very different distribution of family forms depending on their language and place of residence.
Hypotheses
As we suggest in the previous section, adopting norms, beliefs, and attitudes about family life and conjugal life is largely a matter of socialization. The Canadian population includes a fair amount of immigrants and internal migrants from elsewhere in Canada. Our view rests upon the notion that people belong to groups that devise and hand down sets of norms, beliefs, and attitudes through their daily life, but also through the political processes that lead to legislation—which is likely more important in a society where the main source of private law is the legislative power, not the
judi-Canadian Studies in Population 42, no. 1–2 (2015)
ciary—and the mass media. Thus, taken together, the language people speak and where they were socialized are the main factors that define the “normative group” they belong to (Laplante 2014a).
Individuals are more likely to share a given set of norms, beliefs, and attitudes if they have been socialized within it and still live within it. We thus focus the analysis on comparing groups made up of people who, at the time of the census, were residents of the province in which they were born. How migrants negotiate the differences between the norms, beliefs, and attitudes from the society they were born in and the ones of the groups that make up the society in which they landed is an interesting question, but a very different one.
The straightforward hypothesis is that among French-speaking Quebeckers, fertility was lower within consensual union before it became widespread, but is now the same as fertility within mar-riage. This view is probably too simplistic, but we use it as a heuristic hypothesis.
We do not expect the same in other groups, where fertility is likely to be lower within consensual union than in marriage. However, we are interested in contrasting groups according to law and lan-guage, in an attempt at assessing whether they act as channels and boundaries in the diffusion of the norms and patterns typical of French-speaking Quebeckers. Specifically, apart from French-speaking Quebeckers, we are interested in three groups: English-speaking Ontarians, English-speaking Que-beckers, and French-speaking Ontarians. English-speaking Ontarians live under Ontario law, where there is much less difference between marriage and consensual union in the level of economic de-pendence within the couple, and have little exposure to the Quebec French-speaking cultural chan-nels that would put them in contact with the set of norms and patterns typical of French-speaking Quebec. The Quebec English-speaking live under Quebec law, but have no more exposure to the Quebec French-speaking mass media than English-speaking Ontarians. Finally, French-speaking On-tarians live under Ontario law, but have access to a large fraction of Quebec French-speaking mass media.
We expect the difference between French-speaking Quebeckers and English-speaking Ontarians to be the largest, and the two other groups to fall between the two extremes. This set of contrasts does not really amount to a natural experiment, but is likely the closest approximation possible for such a topic.
Data and method
We use individual data from the 20-per-cent sample of the Canadian population that answered the 1986, 1996, and 2006 long form of the census. The 1981 Census did not include questions that clearly allowed couples to declare a common-law union, and therefore the estimates reported in Table 1 are reasonable approximations for a population, but using them as individual characteristics could be inappropriate. The 2011 Census and National Household Survey microdata were not yet available to researchers when the analyses were conducted.
Canadian official statistics classify persons according to conjugal status in three categories that are states of a state space: (1) not living with a spouse or partner; (2) married and not separated; or (3) “living common-law.” Within these parameters we estimate five different measures: the proportion of women in each conjugal situation by age, age-specific fertility rates by conjugal status, cumula-tive fertility by conjugal status, contribution of each conjugal status to age-specific fertility rates, and contribution of each conjugal status to cumulative fertility. Each measure is computed for each of the three censuses. For each census, each measure is computed for each of the four cultural groups we compare: Quebec French-speaking born in the province, Ontario English-speaking born in the
Laplante and Fostik: The recent evolution of fertility within marriage and consensual union in Quebec and Ontario province, Quebec English-speaking born in the province, and Ontario English-speaking born in the province. Results are reported as figures.
Our estimations of fertility are based on the own-children method, which is an indirect technique for the estimation of fertility by age using census data (Cho et al. 1986). Its original form uses the distribution of the number of children less than five years old in the household, conditional on the age of mothers aged between 15 and 49, who are grouped into five-year classes. It was developed for the USA census, mainly to relate fertility measures with characteristics available in the census, but not in the sources of vital statistics. The most obvious difficulties and limitations of this method are establishing the relationship between mother and child from census records, census undercoverage of children and women, infant mortality, and children who do not live with their mother (Grabill and Cho 1965). Rindfuss (1976) compared estimates of USA fertility based on vital statistics with estimates based on census data and the own-children method. He concluded that the own-children estimations reproduced the trends in fertility, despite not reproducing the levels of vital statistics.
Age-specific fertility rates (ASFRs), cumulative fertility, and total fertility rate are well-known measures of
fertility whose meaning and properties are also well known. They are usually computed for all women in their reproductive years, commonly women aged between 15 and 49 years. They are sometimes used in the study of differential fertility and computed for subgroups of women defined by some relevant characteristic, such as ethnic group or place of residence. Technically, nothing prevents com-puting them within groups defined by a time-varying characteristic, such as conjugal status. Actually, they had long been computed separately for married women, as indicators of legitimate fertility. Pressat
explicitly presents age-specific fertility rates computed for unmarried women as indicators of illegitim-ate fertility (Pressat 1973: 179). In our case, the age-specific rillegitim-ates are the rillegitim-ates of giving birth at a given
age while being either married and living with one’s spouse, living in a consensual union, or not living in a union. Laplante et al. (2015) provide an example of such a use, and a review of methods used in the comparative study of fertility within different forms of marital union.
The contribution of each conjugal status to age-specific fertility rates (CASR) is computed as the product of the age-specific rate and the proportion of women of the same age living in a given conjugal status. The sum of the contributions of each conjugal status to age-specific fertility rates is the age-specific rate. The contribution of each conjugal status to cumulative fertility (CCF) is the sum over age of the contributions of each conjugal status to age-specific fertility rates. The sum of the contributions of each conjugal status to cumulative fertility is the cumulative fertility.
Although CASR and CCF are quite straightforward to define and to compute, we are not aware of any previous use of them in the comparative study of fertility within consensual union and mar-riage. Laplante and Fostik (2015) provide a formal presentation of these quantities.
We use within-conjugal-status ASFRs and cumulative fertility to compare fertility patterns across conjugal status in a given group. If the distribution of ASFRs and cumulative fertility within marriage and within consensual union are similar, both states are likely to be acceptable for childbearing and child rearing for the individuals who belong to that group, as well as to the group.
We use the contribution of each conjugal status to ASFRs and the contribution of each conjugal status to cumulative fertility to appreciate the respective contributions of marriage and consensual union in the overall fertility of the group.
Finally, we compare the ASFRs and the TFR across censuses as a way to assess the extent to which the social acceptance of consensual union as a setting for childbearing and child rearing in-creased over time, and we compare in the same fashion contributions to ASFRs and to TFR to assess variation in the contribution of consensual union and marriage to overall fertility over time.
Canadian Studies in Population 42, no. 1–2 (2015)
Results
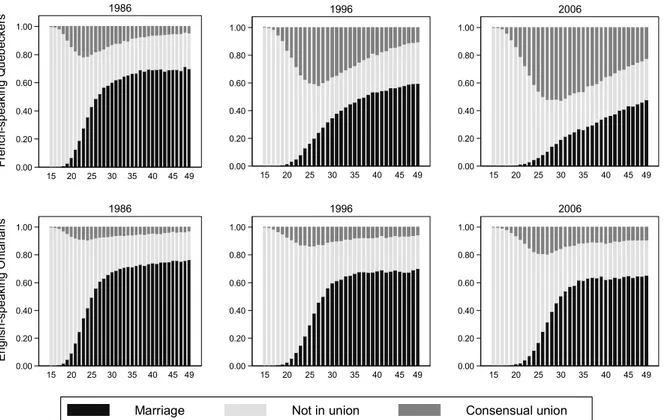
Figure 3 reports the distribution of women aged 15–49 according to their conjugal status at the time of census among the linguistic majority groups of Quebec and Ontario in 1986, 1996, and 2006. The spread of consensual union among Quebec French-speaking women from the first to the last census is noticeable. In 1986, consensual union was at its peak—about 20 per cent— among women in their early twenties. In 2006, the peak was higher and located among somewhat older women: about half of Quebec French-speaking women aged between 25 and 30 years were living in a consensual union. The proportion of women in their late twenties who did not live in a marital union increased somewhat from the first to the most recent census, but among older women this proportion is stable. The growth in the proportion of women living in a consensual union came from a decrease in the proportion of married women, not from a decrease in the proportion of women living alone. Things are different among On-tario English-speaking women, where the spread of consensual union was much slower. The distribu-tion of consensual union by age among Ontario English-speaking women in 2006 is very close to what it was in Quebec twenty years earlier: the peak is the same, about 20 per cent, but it is located around age 25. As among Quebec French-speaking women, though, the increase in the proportion living in a consensual union after the late twenties came from a reduction in the proportion of married women.
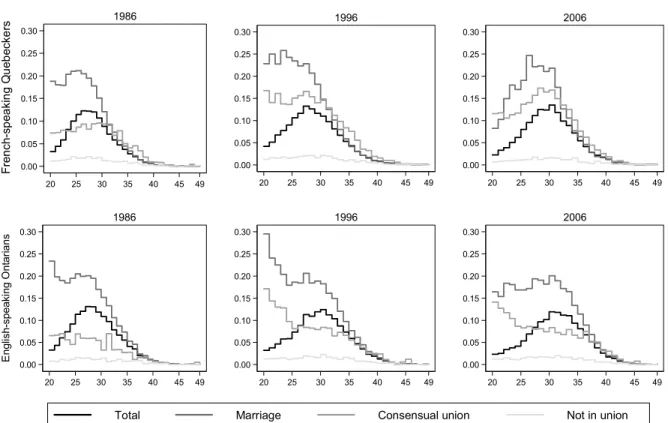
Figure 4 reports the age-specific fertility rates of women aged 20–49 by conjugal status within the same two groups. Before age 20, few women live in a consensual union, and even fewer are married, but ASFRs are very high among them. This is a known feature of legitimate fertility (see Pressat 1973: 179). The contribution of births to women aged under 20 to overall fertility is negligible, whether
mar-23
Figure 3. Conjugal status of women by age, women aged 15–49, French-speaking Quebeckers born in the province and English-speaking Ontarians born in the province, 1986, 1996 and 2006. Census data, 20 per cent sample from the long form. 0.00 0.20 0.40 0.60 0.80 1.00 15 20 25 30 35 40 45 49 Fre nch -sp ea ki ng Q ue be cke rs 1986 0.00 0.20 0.40 0.60 0.80 1.00 15 20 25 30 35 40 45 49 1996 0.00 0.20 0.40 0.60 0.80 1.00 15 20 25 30 35 40 45 49 2006 0.00 0.20 0.40 0.60 0.80 1.00 15 20 25 30 35 40 45 49 E ng lis h-spe ak in g O nt ar ia ns 1986 0.00 0.20 0.40 0.60 0.80 1.00 15 20 25 30 35 40 45 49 1996 0.00 0.20 0.40 0.60 0.80 1.00 15 20 25 30 35 40 45 49 2006
Marriage Not in union Consensual union
Figure 3. Conjugal status of women by age, women aged 15–49, French-speaking Quebeckers born in the province and English-speaking Ontarians born in the province, 1986, 1996 and 2006. Census data, 20 per cent sample from the long form.
Laplante and Fostik: The recent evolution of fertility within marriage and consensual union in Quebec and Ontario
ried or in a consensual union (see Figure 7), but displaying the corresponding ASFRs in a graph would dwarf its most relevant portion. Among Quebec French-speaking women, the peak of the distribution of age-specific rates remains at the same level from the first census to the last one, but its location shifts from left to right. In all censuses, the rates are consistently much higher within marriage than within consensual union up to age 30, but similar or slightly higher in consensual union between age 30 and 40. From the first census to the most recent, rates increase somewhat within consensual union. In 1986 and 1996, the distribution of rates was almost flat until the late twenties within marriage as well as within consensual union. In 2006, they increase within both from age 20 to 30.
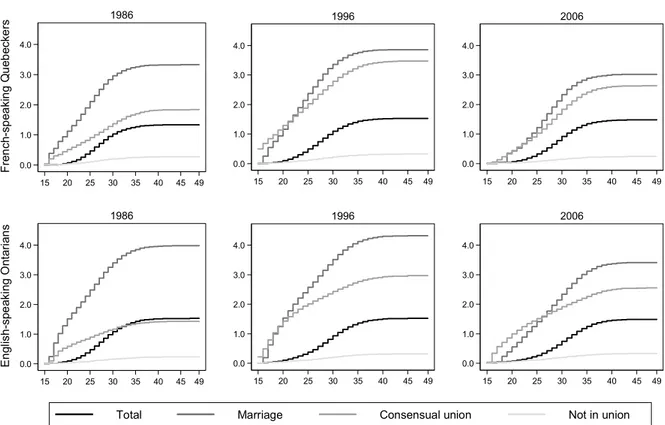
Figure 5 reports the cumulative fertility rates by conjugal status for the same two groups. Among French-speaking Quebeckers, cumulative fertility is higher within marriage than within consensual union in all censuses. However, from the first to the last census, it decreases within marriage but in-creases within consensual union. In all three censuses, the maximum difference is reached at age 30. Some features are the same among English-speaking Ontarians: cumulative fertility within marriage decreases from the first to the last census, and cumulative fertility is always lower within consensual union. There are some noticeable differences. In all censuses, the maximum difference is reached a few years later than among French-speaking Quebeckers. The most salient difference is that cumula-tive fertility is higher within consensual union than within marriage until age 25.
Figure 6 reports the contribution of each conjugal status to age-specific fertility rates for the same two groups. The striking difference is the radical change among French-speaking Quebeckers from the 1986 census to the 2006 one. In 1986, marriage had by far the largest contribution to overall fertility. In 2006, the status was reversed. In 1996 and 2006, the contributions of marriage reach their
24
Figure 4. Age-specific fertility rates by conjugal status, women aged 20–49, French-speaking Quebeckers born in the province and English-speaking Ontarians born in the province, 1986, 1996 and 2006. Census data, 20 per cent sample from the long form.
0.00 0.05 0.10 0.15 0.20 0.25 0.30 20 25 30 35 40 45 49 Fre nch -sp ea ki ng Q ue be cke rs 1986 0.00 0.05 0.10 0.15 0.20 0.25 0.30 20 25 30 35 40 45 49 1996 0.00 0.05 0.10 0.15 0.20 0.25 0.30 20 25 30 35 40 45 49 2006 0.00 0.05 0.10 0.15 0.20 0.25 0.30 20 25 30 35 40 45 49 E ngl is h-speaki ng O nt ar ians 1986 0.00 0.05 0.10 0.15 0.20 0.25 0.30 20 25 30 35 40 45 49 1996 0.00 0.05 0.10 0.15 0.20 0.25 0.30 20 25 30 35 40 45 49 2006
Total Marriage Consensual union Not in union
Figure 4. Age-specific fertility rates by conjugal status, women aged 20–49, French-speaking Quebeckers born in the province and English-speaking Ontarians born in the province, 1986, 1996, and 2006. Census data, 20 per cent sample from the long form.
Canadian Studies in Population 42, no. 1–2 (2015)
92
25
Figure 5. Cumulative fertility rates by conjugal status, women aged 15–49, French-speaking Quebeckers born in the province and English-speaking Ontarians born in the province, 1986, 1996 and 2006. Census data, 20 per cent sample from the long form.
0.0 1.0 2.0 3.0 4.0 15 20 25 30 35 40 45 49 Fre nch -sp ea ki ng Q ue be cke rs 1986 0.0 1.0 2.0 3.0 4.0 15 20 25 30 35 40 45 49 1996 0.0 1.0 2.0 3.0 4.0 15 20 25 30 35 40 45 49 2006 0.0 1.0 2.0 3.0 4.0 15 20 25 30 35 40 45 49 E ng lis h-spe ak in g O nt ar ia ns 1986 0.0 1.0 2.0 3.0 4.0 15 20 25 30 35 40 45 49 1996 0.0 1.0 2.0 3.0 4.0 15 20 25 30 35 40 45 49 2006
Total Marriage Consensual union Not in union
25
Figure 5. Cumulative fertility rates by conjugal status, women aged 15–49, French-speaking Quebeckers born in the province and English-speaking Ontarians born in the province, 1986, 1996 and 2006. Census data, 20 per cent sample from the long form.
0.0 1.0 2.0 3.0 4.0 15 20 25 30 35 40 45 49 Fre nch -sp ea ki ng Q ue be cke rs 1986 0.0 1.0 2.0 3.0 4.0 15 20 25 30 35 40 45 49 1996 0.0 1.0 2.0 3.0 4.0 15 20 25 30 35 40 45 49 2006 0.0 1.0 2.0 3.0 4.0 15 20 25 30 35 40 45 49 E ng lis h-spe ak in g O nt ar ian s 1986 0.0 1.0 2.0 3.0 4.0 15 20 25 30 35 40 45 49 1996 0.0 1.0 2.0 3.0 4.0 15 20 25 30 35 40 45 49 2006
Total Marriage Consensual union Not in union
Figure 5. Cumulative fertility rates by conjugal status, women aged 15–49, French-speaking Quebeckers born in the province and English-speaking Ontarians born in the province, 1986, 1996, and 2006. Census data, 20 per cent sample from the long form.
26
Figure 6. Contribution of each state of conjugal status to age-specific fertility rates, women aged 15–49, French-speaking Quebeckers born in the province and English-speaking Ontarians born in the province, 1986, 1996 and 2006. Census data, 20 per cent sample from the long form.
0.00 0.05 0.10 0.15 15 20 25 30 35 40 45 49 Fre nch -sp ea ki ng Q ue be cke rs 1986 0.00 0.05 0.10 0.15 15 20 25 30 35 40 45 49 1996 0.00 0.05 0.10 0.15 15 20 25 30 35 40 45 49 2006 0.00 0.05 0.10 0.15 15 20 25 30 35 40 45 49 E ngl is h-speaki ng O nt ar ians 1986 0.00 0.05 0.10 0.15 15 20 25 30 35 40 45 49 1996 0.00 0.05 0.10 0.15 15 20 25 30 35 40 45 49 2006
Marriage Consensual union Not in union
Figure 6. Contribution of each state of conjugal status to age-specific fertility rates, women aged 15–49, French-speaking Quebeckers born in the province and English-speaking Ontarians born in the
Laplante and Fostik: The recent evolution of fertility within marriage and consensual union in Quebec and Ontario
peak at a later age than the contributions of consensual union. This underlines that although ASFRs are higher within marriage than within consensual union in general, and especially in younger ages, few women are married at such ages. Among English-speaking Ontarians, the contributions of mar-riage are overwhelming in all censuses. The contributions among English-speaking Ontarians in 2006 are very similar to those of French-speaking Quebeckers in 1986.
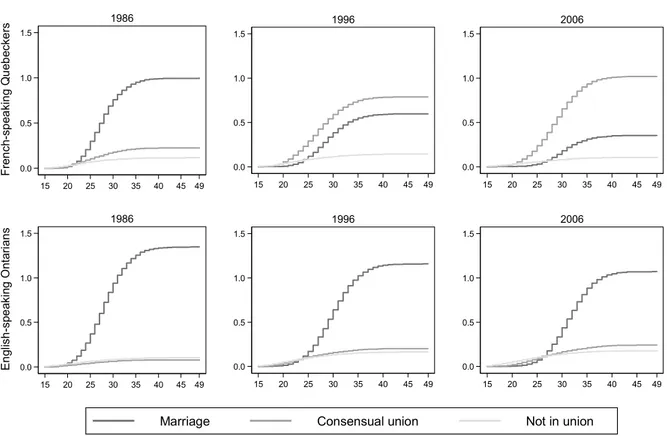
Figure 7 reports the contribution of each conjugal status to cumulative fertility for the same two groups. Among French-speaking Quebeckers, since 1996 consensual union accounts for the largest share of the cumulative fertility from the early twenties onwards. In 2006, about 70 per cent of the overall fertility as measured by the TFR comes from births within consensual union. Among English-speaking Ontarians, the contribution of marriage to overall fertility is overwhelming. Again, the picture among this group is very similar to that of French-speaking Quebeckers twenty years earlier.
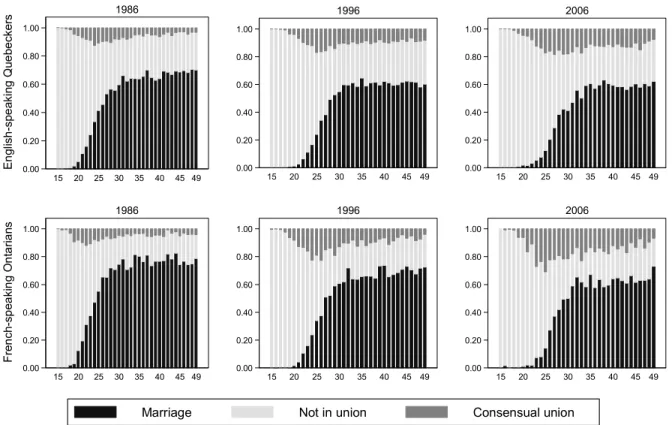
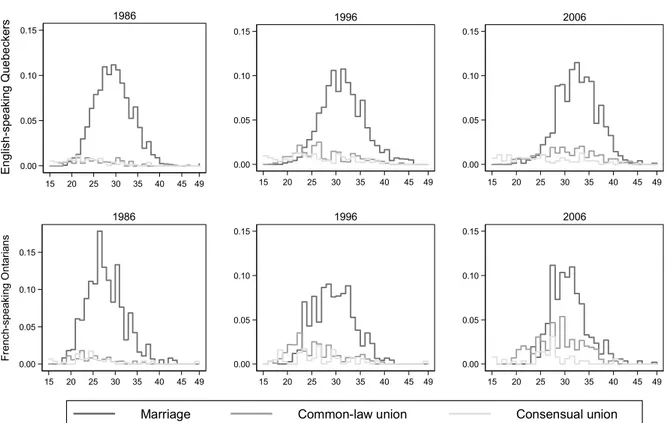
Figures 8, 9, and 10 report respectively the conjugal status by age, the contribution of each con-jugal status to age-specific fertility rates, and the contribution of each concon-jugal status to cumulative fertility among English-speaking Quebeckers and among French-speaking Ontarians. In both groups and in all censuses, marriage outnumbers consensual union, although the latter is slowly becoming more common. The contribution of marriage to age-specific rates is overwhelming in all censuses within both groups, although the contribution of consensual union is higher among French-speaking Ontarians. The contribution of marriage to cumulative fertility is overwhelming in both groups and in all three censuses. There is one noticeable difference: in the 1986 census and more clearly in the 2006 one, among French-speaking Ontarians the contribution of consensual union to cumulative fertility is higher than that of marriage, until the mid-twenties.
27
Figure 7. Contribution of each state of conjugal status to cumulative fertility, women aged 20–49, French-speaking Quebeckers born in the province and English-speaking Ontarians born in the province, 1986, 1996 and 2006. Census data, 20 per cent sample from the long form.
0.0 0.5 1.0 1.5 15 20 25 30 35 40 45 49 Fre nch -sp ea ki ng Q ue be cke rs 1986 0.0 0.5 1.0 1.5 15 20 25 30 35 40 45 49 1996 0.0 0.5 1.0 1.5 15 20 25 30 35 40 45 49 2006 0.0 0.5 1.0 1.5 15 20 25 30 35 40 45 49 E ng lis h-spe ak in g O nt ar ia ns 1986 0.0 0.5 1.0 1.5 15 20 25 30 35 40 45 49 1996 0.0 0.5 1.0 1.5 15 20 25 30 35 40 45 49 2006
Marriage Consensual union Not in union
Figure 7. Contribution of each state of conjugal status to cumulative fertility, women aged 20–49, French-speaking Quebeckers born in the province and English-speaking Ontarians born in the province, 1986, 1996 and 2006. Census data, 20 per cent sample from the long form.
Canadian Studies in Population 42, no. 1–2 (2015)
Discussion and conclusion
The relation between fertility and conjugal status has changed in a profound way among French-speaking Quebeckers from the onset of the spread of consensual union, in the early to mid-1980s, until 2006. Over this period, age-specific fertility rates and cumulative fertility have decreased within marriage and increased within consensual union. At the end of the period, both remain higher within marriage, but the difference is much smaller than at the beginning. However, the most striking differ-ence is found in the contributions of the two forms of marital union to overall fertility: in 1986, overall fertility was by far and away only fertility within marriage, whereas in 2006, overall fertility is mainly fertility within consensual union. The apparent contradiction between higher age-specific rates and cumulative fertility within marriage (even in 2006) and the higher contribution of consensual union to overall fertility and overall cumulative fertility boils down to two things. First, most women in their reproductive years live in a consensual union rather than in a marriage. Second, age-specific rates are higher within marriage for ages at which more women are living in a consensual union rather than married. In other words, the conclusion that fertility is higher within marriage than within consensual union is reached by comparing two synthetic cohorts and interpreting their respective TFR as if they were the completed fertility of the average married woman and of the average woman who lives in a consensual union. This interpretation is convenient and reasonably realistic when comparing TFRs computed within groups defined by a fixed characteristic, but truly misleading when comparing groups defined by a time-varying characteristic. This limitation is general: it would occur using cohort rather than period data, as people may move between consensual union and marriage over the life course.
28
Figure 8. Conjugal status of women by age, women aged 15–49, English-speaking Quebeckers born in the province and French-speaking Ontarians born in the province, 1986, 1996 and 2006. Census data, 20 per cent sample from the long form. 0.00 0.20 0.40 0.60 0.80 1.00 15 20 25 30 35 40 45 49 En gl ish -sp ea ki ng Q ue be cke rs 1986 0.00 0.20 0.40 0.60 0.80 1.00 15 20 25 30 35 40 45 49 1996 0.00 0.20 0.40 0.60 0.80 1.00 15 20 25 30 35 40 45 49 2006 0.00 0.20 0.40 0.60 0.80 1.00 15 20 25 30 35 40 45 49 Fr enc h-spe ak ing O nt ar ian s 1986 0.00 0.20 0.40 0.60 0.80 1.00 15 20 25 30 35 40 45 49 1996 0.00 0.20 0.40 0.60 0.80 1.00 15 20 25 30 35 40 45 49 2006
Marriage Not in union Consensual union
Figure 8. Conjugal status of women by age, women aged 15–49, English-speaking Quebeckers born in the province and French-speaking Ontarians born in the province, 1986, 1996 and 2006. Census data, 20 per cent sample from the long form.
Laplante and Fostik: The recent evolution of fertility within marriage and consensual union in Quebec and Ontario
29
Figure 9. Contribution of each state of conjugal status to age-specific fertility rates, women aged 15–49, English-speaking Quebeckers born in the province and French-speaking Ontarians born in the province, 1986, 1996 and 2006. Census data, 20 per cent sample from the long form.
0.00 0.05 0.10 0.15 15 20 25 30 35 40 45 49 En gl ish -sp ea ki ng Q ue be cke rs 1986 0.00 0.05 0.10 0.15 15 20 25 30 35 40 45 49 1996 0.00 0.05 0.10 0.15 15 20 25 30 35 40 45 49 2006 0.00 0.05 0.10 0.15 15 20 25 30 35 40 45 49 Fr ench-speaki ng O nt ar ians 1986 0.00 0.05 0.10 0.15 15 20 25 30 35 40 45 49 1996 0.00 0.05 0.10 0.15 15 20 25 30 35 40 45 49 2006
Marriage Common-law union Consensual union
Figure 9. Contribution of each state of conjugal status to age-specific fertility rates, women aged 15–49, English-speaking Quebeckers born in the province and French-speaking Ontarians born in the province, 1986, 1996 and 2006. Census data, 20 per cent sample from the long form.
30
Figure 10. Contribution of each conjugal situation to cumulative fertility, women aged 15–49, English-speaking Quebeckers born in the province and French-speaking Ontarians born in the province, 1986, 1996 and 2006. Census data, 20 per cent sample from the long form.
0.0 0.5 1.0 1.5 15 20 25 30 35 40 45 49 En gl ish -sp ea ki ng Q ue be cke rs 1986 0.0 0.5 1.0 1.5 15 20 25 30 35 40 45 49 1996 0.0 0.5 1.0 1.5 15 20 25 30 35 40 45 49 2006 0.0 0.5 1.0 1.5 15 20 25 30 35 40 45 49 Fr enc h-spe ak ing O nt ar ian s 1986 0.0 0.5 1.0 1.5 15 20 25 30 35 40 45 49 1996 0.0 0.5 1.0 1.5 15 20 25 30 35 40 45 49 2006
Marriage Consensual union Not in union
Figure 10. Contribution of each conjugal situation to cumulative fertility, women aged 15–49, English-speaking Quebeckers born in the province and French-speaking Ontarians born in the
Canadian Studies in Population 42, no. 1–2 (2015)
The results found in Ontario and in Quebec are very different from those found in Latin Amer-ican countries where consensual union is now spreading or already widespread. In these countries, the distribution of age-specific rates basically depends solely on age and not on the form of the marital union: they tend to be very similar within marriage and within consensual union (Laplante et al. 2013). Among French-speaking Quebeckers, age-specific rates are still higher within marriage up to the mid-thirties. However, given the high prevalence of consensual union and the small differences between age-specific rates within marriage and within consensual union, the fertility within consen-sual union may account for the largest portion of overall fertility and the fact that overall fertility is somewhat higher in Quebec than in Ontario.
This leads us to conclude that the traditional way of thinking about differential fertility may not suit all contexts well. This also leads us to conclude that fertility is “high enough” within consensual union so that overall fertility is higher in Quebec than in Ontario, despite the large proportion of women living in a consensual union in Quebec.
English-speaking Ontarians basically maintain traditional fertility patterns with very little change. The similarity between the patterns of English-speaking Ontarians in 2006 to those of French-speaking Quebeckers in 1986 is interesting, but the change over these twenty years is so small that extrapolating a trend from it would be very hazardous. The concentration at young ages of fertility within consensual union is likely a reflection of the association between youth, consensual union, and poverty (see Stalker and Ornstein 2013).
There is very little diffusion, if any, of the patterns typical of French-speaking Quebeckers to English-speaking Quebeckers, despite them sharing the same law and the same space, at least in parts of the Island of Montreal. We see no more diffusion to French-speaking Ontarians, either, despite their access to French-speaking media. On the contrary, among the former, fertility within consensual union seems to be associated with youth and probably poverty, as it is among English-speaking Ontarians. In a nutshell, fertility within consensual union seems to have a very distinctive pattern among French-speaking Quebeckers that singles them out from the rest of Canadians, as does their high level of consensual union itself. From a broader perspective, they are different as well from the people of the USA, but maybe not so much from other people with whom they share the heritage of Catholicism and Civil Law. Consensual union is spreading in Latin America (Esteve et al. 2012); consensual unions and out-of-wedlock births, largely driven by the increasing number of people living in a consensual union, are also on the rise in Spain (Domínguez-Folgueras and Castro-Martín 2013).
The conclusion that fertility is “high enough” within consensual union in Quebec so that over-all fertility is higher in Quebec than in Ontario despite the importance of consensual union leads to new questions about the mechanism that leads to a relatively high level of fertility in a society which has seemingly broken away from the traditional ideas and patterns that were associated with childbearing and child rearing. Exploring this topic is beyond the scope of this article, but it may be reasonable to suggest that there may be a relation between the breaking away from traditional patterns, the high level of consensual union, relatively higher level of fertility, high level of women’s labour force participation, and higher levels of gender equality within and outside of the household and family policies, such as subsidised low-cost daycare and flexible as well as relatively generous parental leaves. The “new” family policies would be adapted to a society that has broken away from traditional norms, and aimed at regaining a level of fertility that allows population replacement. If this were true, it would not come as a surprise that such policies foster fertility within consensual union as well as within marriage.
Laplante and Fostik: The recent evolution of fertility within marriage and consensual union in Quebec and Ontario
References
Bachrach, C.A. 2014. Culture and demography: From reluctant bedfellows to committed partners.
Demography 51(1):3–25.
Beaujot, R., and J. Wang. 2010. Low fertility in Canada: The Nordic model inQuebec and the US model in Alberta. Canadian Studies in Population 37(3–4):411–43.
Beaujot, R., C.J. Du,and Z. Ravanera. 2013. Family policies in Quebec and the rest of Canada:
Implications for fertility, child-care, women’s paid work, and child development indicators. Canadian Public Policy 39(2):221–40.
Bélanger, A., and P. Turcotte. 1999. L’influence des caractéristiques sociodémographiques sur le début de la vie conjugale des Québécoises. Cahiers québécois de démographie 28(1–2):173–97.
Bongaarts, J., and T. Sobotka. 2012. A demographic explanation for the recent rise in European fertility. Population and Development Review 38(1):83–120.
Caldwell, G. 1991. Childbearing, in Recent social trends in Québec, 1960-1990, edited by S. Langlois, J.-P. Baillargeon, G. Caldwell, G. Fréchet, M. Gauthier, and J.-P. Simard. Frankfurt am Main: Campus Verlag; Montreal and Kingston: McGill-Queen’s University Press, p. 102–05.
Caldwell, G., K. Stiehr, J. Modell, and S. Del Campo. 1994. Differing levels of low fertility, in Convergence or divergence? Comparing recent social trends in industrial societies, edited by S. Langlois, T. Caplow, H. Mendras, and W. Glatzer. Frankfurt am Main: Campus Verlag; Montreal and Kingston: McGill-Queen’s University Press, p. 43–87.
Caron-Malenfant, É., and A. Bélanger. 2006. The fertility of visible minority women in Canada, in Report on the Demographic Situation in Canada 2003 and 2004, edited by A. Bélanger. Ottawa: Statistics Canada, p. 79–94 (Catalogue number 91-209-XIE).
Cho, L-J., R.D. Rutherford, and M.K. Choe. 1986. The Own-Children Method of Fertility Estimation. Honolulu: University of Hawaii Press.
Domínguez-Folgueras, M., and T. Castro Martín. 2013. Cohabitation in Spain: No longer a marginal path to family formation. Journal of Marriage and Family 75(2):422–37.
Dumas, J., A. Bélanger, and G. Smith. 1998. Common-law unions in Canada at the end of the 20th century, in Report on the Demographic Situation in Canada 1996, edited by J. Dumas, A. Bélanger, and G. Smith. Ottawa: Statistics Canada, p. 121–86 (Catalogue number 91-209-XIE).
Esteve, A., R.J. Lesthaeghe, and A. López-Gay. 2012. The Latin American cohabitation boom, 1970– 2007. Population and Development Review 38(1):55–81.
Gauthier, A.H. 1989. À propos de la différence de fécondité entre le Québec et l’Ontario. Cahiers québécois de démographie 18(1):185–94.
Goldstein, J.R., T. Sobotka, and A. Jasilioniene. 2009. The end of lowest-low fertility? Population and Development Review 35(4):663–700.
Grabill, W.H., and L.-J. Cho, 1965. Methodology for the measurement of current fertility from population data on young children. Demography 2:50–73.
Kerr, D., M. Moyser, and R. Beaujot. 2006. Marriage and cohabitation: Demographic and socioeconomic differences in Quebec and Canada. Canadian Studies in Population 33(1):83–117.
Canadian Studies in Population 42, no. 1–2 (2015)
Krull, C., and F. Trovato. 2003. Where have all the children gone? Quebec’s fertility decline: 1941–1991. Canadian Studies in Population 30(1):193–220.
Lachapelle, R. 2007. The high prevalence of cohabitation among Francophones: Some implications for exogamous couples. Paper presented at the Canadian Population Society Annual Meeting, Saskatoon, Canada (30 May–2 June).
Lapierre-Adamcyk, É., and M.-H. Lussier. 2003. De la forte fécondité à la fécondité désirée, in La démographie québécoise: Enjeux du XXIe siècle, edited by V. Piché and C. Le Bourdais. Montréal: Presses de l’Université de Montréal, p. 66–109.
Laplante, B. 2006. The rise of cohabitation in Quebec: Power of religion and power over religion. Canadian Journal of Sociology 31:1–24.
———. 2014a. Normative groups. The rise of the formation of the first union through cohabitation in Quebec: A comparative approach. Population Research and Policy Review 33(2):257–85.
———. 2014b. L’union de fait comme mariage romain: Rome, l’Église et la France d’Ancien Régime. Revue juridique Thémis 48(1):89–145.
———. 2014c. L’union de fait comme mariage romain: l’Angleterre avant 1857 et la situation actuelle en Angleterre, en France et au Québec. Revue juridique Thémis 48(2).
Laplante, B., and C. Flick. 2010. Le mariage, l’union de fait et la santé au Québec et en Ontario. Cahiers québécois de démographie 39(1):1–26.
Laplante, B., and A.L. Fostik. 2015. Two period measures for comparing the fertility of marriage and cohabitation. Demographic Research 32:421−42, published 12 February (DOI: 10.4054/ DemRes.2015.32.14).
Laplante, B., T. Castro Martín, C. Cortina, and T. Martín García. 2015. Childbearing within marriage and consensual union in Latin America, 1980–2010. Population and Development Review 41(1):85–108. Laplante, B., C. Miller, and P. Malherbe. 2006. The evolution of beliefs and opinions on matters related
to marriage and sexual behaviour of French-speaking Catholic Quebecers and English-speaking Protestant Ontarians. Canadian Studies in Population 33(2):205–35.
Lardoux, S., and D. Pelletier. 2012. Trajectoires conjugales des parents et rendement scolaire des enfants en première année du primaire. Cahiers québécois de démographie 41(2):369–412.
Le Bourdais, C., and É. Lapierre-Adamcyk. 2004. Changes in conjugal life in Canada: Is cohabitation progressively replacing marriage? Journal of Marriage and the Family 66(4):929–42.
Le Goff, J-M. 2013. The onset of out-of-wedlock births in Switzerland: A spatial diffusion analysis. Paper presented at the XXVII World Population Congress, Busan, South Korea (26–31 August). Leckey, R. 2014. Development in family law: The 2012–2013 term. Supreme Court Law Review 64:241–66. Pollard, M.S., and Z. Wu. 1998. Divergence of marriage patterns in Quebec and elsewhere in Canada.
Population and Development Review 24(2):329–56.
Pressat, R. 1973. L’analyse démographique. 3rd edn. Paris: Presses universitaires de France.
Ravanera, Z.R., F. Rajulton, and T.K. Burch. 1998. Early life transitions of Canadian women: A cohort analysis of timing, sequences, and variations. European Journal of Population 14(2):179–204.
Laplante and Fostik: The recent evolution of fertility within marriage and consensual union in Quebec and Ontario
Rindfuss, R.R. 1976. Annual fertility rates from census data on own children: Comparisons with vital statistics data for the United States. Demography 13(2):235–49.
Rochon, M. 1989. La vie reproductive des femmes d’aujourd’hui. Le cas du Québec. Cahiers québécois de démographie 18(1):15–61.
St-Amour, M. 2013. Les écarts de fécondité selon la situation conjugale au Québec. Données sociodémographiques en bref 17(2):6–9.
Stalker, G., and M. Ornstein. 2013. Quebec, daycare, and the household strategies of couples with young children. Canadian Public Policy 39(2):241–62.
Statistics Canada. 2012. Births 2009. Ottawa: Statistics Canada (Catalogue number 84F0210X).
———. 2013. Citizenship (5), Place of Birth (236), Immigrant Status and Period of Immigration (11), Age Groups (10) and Sex (3) for the Population in Private Households of Canada, Provinces, Territories, Census Metropolitan Areas and Census Agglomerations. 2011 National Household Survey Data Table. Ottawa: Statistics Canada (Catalogue number 99-010-X2011026).
Street, C., and B. Laplante. 2014. Pas plus élevée, mais après la migration! Fécondité, immigration et calendrier de constitution de la famille. Cahiers québécois de démographie 43(1):35–68.
Szreter, S. 1996. Fertility, Class and Gender in Britain 1860–1940. Cambridge: Cambridge University Press. Toulemon, L. 2004. La fécondité des immigrées : nouvelles données, nouvelle approche. Population et
Sociétés 400:1–4.
———. 2006. Fertility among immigrant women in France: New data, a new approach. Population Association of America Annual Meeting, Los Angeles (March 30–April 1).
Toulemon, L., and M. Mazuy. 2004. Comment prendre en compte l’âge à l’arrivée et la durée de séjour en France dans la mesure de la fécondité des immigrants? Document de travail no. 120. Paris: INED.
Turcotte, P., and A. Bélanger. 1997. Moving in together: The formation of first common-law unions. Canadian Social Trends 47:7–10.
Turcotte, P., and F. Goldscheider. 1998. Evolution of factors influencing first union formation in Canada. Canadian Studies in Population 25(2):145–73.
Verdugo Lazo, A. 1994. Marital Fertility in Brazil: Differential by Type of Union and its Importance in the Fertility Transition, 1976–1991. DHS Working Papers no. 15. Calverton MD: Macro International Inc.
Canadian Studies in Population 42, no. 1–2 (2015)
Table A1. Top programs, English-speaking Canada, February 4 to February 10, 2013.
Rank Programme “Broadcast outlet” Type Origin
1 Big Bang Theory CTV Fiction USA
2 Grammy Awards Global Variety USA
3 NCIS Global Fiction USA
4 Hockey Night in Canada (Prime East) CBC Sports Canada
5 Two and a Half Men CTV Fiction USA
6 C.S.I. CTV Fiction USA
7 CTV Evening News CTV News Canada
8 Grey’s Anatomy CTV Fiction USA
9 NCIS: Los Angeles Global Fiction USA
10 American Idol 12th season CTV Reality USA
11 C.S.I. New York CTV Fiction USA
12 Blue Bloods CTV Fiction USA
13 Criminal Minds CTV Fiction USA
14 Castle CTV Fiction USA
15 Bones Global Fiction USA
16 Hawaii Five-O Global Fiction USA
17 Hockey Night in Canada (Prime West) CBC Sports Canada
18 Big Bang Theory (sic) CTV Fiction USA
19 The Following CTV Fiction USA
20 Elementary Global Fiction USA
21 Arrow CTV Fiction USA
22 CTV Evening News (Week-end) CTV News Canada
23 Once Upon a Time CTV Fiction USA
24 Vegas Global Fiction USA
25 Big Bang Theory CTV Fiction USA
26 CTV National News CTV News Canada
27 American Idol 12th season (sic) CTV Two Reality USA
28 Marketplace CBC News Canada
29 Person of Interest City Fiction USA
30 Hockey Night in Canada (Saturday afternoon) CBC Sports Canada
Sources: BBM Canada and Sondages BBM for ranking, programme, and “broadcast outlet.” Own research for type and origin.
Laplante and Fostik: The recent evolution of fertility within marriage and consensual union in Quebec and Ontario
Table A2. Top programs, French-speaking Quebec, February 4 to February 10, 2013.
Rank Programme “Broadcast outlet” Type Origin
1 La voix TVA Reality Quebec
2 Unité nº 9 SRC Fiction Quebec
3 La voix TVA Reality Quebec
4 19-2 SRC Fiction Quebec
5 LOL :-) TVA Fiction Quebec
6 Yamaska TVA Fiction Quebec
7 Les enfants de la télé SRC Variety Quebec
8 Accès illimité TVA Variety Quebec
9 Toute la vérité TVA Fiction Quebec
10 Vlog TVA Variety Quebec
11 Les Parent SRC Fiction Quebec
12 Tranches de vie TVA Fiction Quebec
13 On connaît la chanson TVA Quiz Quebec
14 L’auberge du chien noir SRC Fiction Quebec
15 La poule aux œufs d’or, La TVA Quiz Quebec
16 Tout le monde en. parle SRC Variety Quebec
17 Le tricheur TVA Quiz Quebec
18 Mémoires vives SRC Fiction Quebec
19 TVA Nouvelles (18h - Weekdays) TVA News Quebec
20 Trauma SRC Fiction Quebec
21 La facture SRC News Quebec
22 Destinées TVA Fiction Quebec
23 O’ TVA Fiction Quebec
24 Le hockey des Canadiens (Week-end) RDS+ Sports Quebec
25 Qui perd gagne TVA Reality USA
26 TVA Nouvelles (17h) TVA News Quebec
27 Découverte SRC Science Quebec
28 TVA Nouvelles (18h – Week-end) TVA News Quebec
29 Prière de ne pas envoyer de fleurs SRC Variety Quebec
30 En direct de l’univers SRC Variety Quebec
Sources: BBM Canada and Sondages BBM for ranking, programme, and “broadcast outlet.” Own research for type and origin.