THÈSE
En vue de l'obtention du
DOCTORAT DE L’UNIVERSITÉ DE TOULOUSE
Délivré par l’Université Toulouse 3 – Paul Sabatier Discipline ou spécialité : Informatique
JURY
Jean-Charles Fabre (examinateur) Terje Aven (rapporteur) Leslie Walls (rapporteur) Douglas Owen (examinateur) Philippe Palanque (directeur de thèse)
Christopher Johnson (co-encadrant)
Ecole doctorale: Mathématiques Informatique et Télécommunications de Toulouse (MITT) Unité de recherche: IRIT – UMR 5505
Directeur(s) de Thèse: Philippe Palanque et Christopher Johnson Rapporteurs: Terje Aven et Leslie Walls
Présentée et soutenue par Jari Nisula Le 1 Mars 2018
I would like to dedicate this work to front line operators in safety critical systems: people like pilots, sea captains, train drivers and doctors. They need to take critical decisions in situations that are characterized by uncertainty, complexity and time pressure. These people inherit the latent problems in the system and must adapt and stretch to produce resilience and success on good and bad days - and nights. I count among these people my sister, an anesthesiologist working with intensive care patients, and my late father who flew a full career as an airline pilot, carrying hundreds of thousands of people safely to their destinations.
Professors Philippe Palanque and Christopher Johnson guided me through the whole academic journey during more than four years. A big thanks to them for all the help including the very valuable and record-fast feedback on the draft versions of the dissertation.
I would like to extend my thanks also to the whole team around Prof. Palanque at IRIT, in the Paul Sabatier university of Toulouse, and recognize especially the help from Dr. Célia Martinie and Dr. Camille Fayollas. The advice and support on the administrative side by Martine Labruyère and Agnès Requis was tremendously appreciated, as well as the technical support by Jean-Francois Gendet and Thierry Bichot from IRIT.
I am very grateful to the members of the Jury for their time, expertise and willingness to be part of this academic project.
The whole journey would not have taken off without the engagement of the Finnish Transport Safety Agency, Trafi. Daring to make a two-year investment to create a new unconventional approach for running their activity was bold. My thanks go to all the 70+ people in Trafi who actively participated in the project and especially to the multi-modal team of the analysis department in the heart of the project. I am particularly grateful to Mrs. Heli Koivu and DG Aviation Capt. Pekka Henttu for their invaluable support at every level and every stage of the project. Mrs. Marita Löytty deserves special thanks for helping me get access to relevant material and Mr. Ilkka Kaakinen for carrying out the final interviews and their analysis together with me.
I would like to thank Professors David D. Woods and Erik Hollnagel for the interviews and discussions I was privileged to have with them during a Eurocontrol event in Lisbon in 2014. Similarly, I am grateful for the exchanges I could have with Dr. René Amalberti in the early days of the project.
I would like to thank my friends and great professionals Dr. Simon Gill and Dr. Claus A. Andersen for their valuable feedback and encouragement.
The dissertation was written in parallel to having a full-time job. I am very grateful to Mr. Philippe Izart for providing a great amount of flexibility and thus making this challenge easier.
Finally, this long project has required many sacrifices and a lot patience from my family and especially from my wife Delphine. I have received their full support and love all this time and I am deeply grateful for that.
Table of content ... 5
List of figures ... 9
List of tables ... 11
Introduction ... 13
PART I – Review of the literature ... 15
Chapter 1 – Setting the context ... 17
1 Importance of managing transport risks ... 17
2 Definitions ... 25
3 Limitations and delimitations ... 29
Chapter 2 – Current perspective to the concept of risk ... 30
1 Clarifying the concept of probability ... 31
2 The knowledge dimension of risk ... 32
3 The need to address black swans ... 35
4 Accommodating different risk aversion policies ... 38
5 Synthesis and conclusions... 39
Chapter 3 – Risk Management in a Complex Adaptive System ... 40
1 From Cartesian reductionism to complexity ... 42
2 Properties of complex systems ... 44
3 Organizations as complex adaptive systems ... 47
4 Systems thinking ... 51
5 Managing risks in Complex Adaptive Systems ... 53
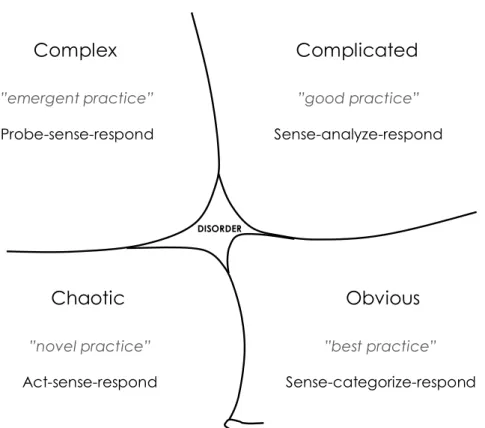
5.1 The Cynefin framework ... 54
5.2 Understanding what is going on within the complex system ... 56
5.3 Learning about system characteristics and behavior ... 56
5.4 Achieving positive change in a complex system ... 58
6 Synthesis and conclusions... 59
Chapter 4 – Contribution of Safety Science to Risk Management ... 63
1 Safety I: safety as lack of accidents ... 63
1.1 Incident reporting and chasing the human error ... 65
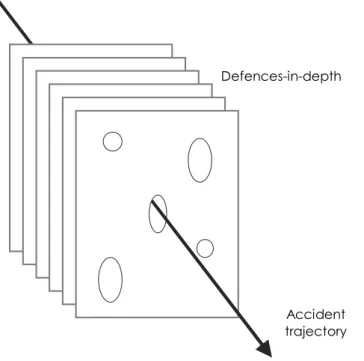
1.2 The Reason model on accident causation ... 66
3 Human Factors in production and decision making ... 77
3.1 Human factors of operations and production ... 77
3.2 Human biases, risk perception and decision making ... 79
4 Synthesis and conclusions... 82
Chapter 5 - Acceptability of Risks ... 85
1 Risk tolerability as a multi-dimensional judgment ... 85
2 Ethical basis for risk-related decision making ... 86
3 Methods and indicators ... 88
4 Synthesis and conclusions... 90
Chapter 6 – State of the art in transport risk management frameworks ... 92
1 Guidance for the risk management process ... 92
2 Refined objectives for the framework ... 98
3 Risk assessment practices in the industry ... 103
4 Existing scientific frameworks for risk management ... 109
5 Synthesis and conclusions... 112
PART II – A Risk Management Framework for a Complex Adaptive Transport System ... 116
Chapter 7 – Modern Risk Management Framework for four modes of transport ... 117
1 Setting the context ... 117
2 Risk identification... 118
2.1 Event Risk Assessment ... 119
2.2 The concept of Riss... 123
2.3 Safety Factors ... 126
3 Risk analysis ... 128
3.1 Data Integration and building knowledge ... 128
3.2 The Risk Picture ... 129
3.3 Safety Issue Risk Assessment ... 133
3.4 Exposure rates and the Type II Risk Picture ... 134
4 Risk evaluation ... 137
4.1 Understanding the different areas in the risk picture ... 137
4.2 Further analysis of the risk picture ... 139
4.3 Risks in the Black Swan corner ... 139
4.4 Acceptability of risks and Decision Making ... 140
5 Risk treatment ... 144
5.1 Understanding the phenomenon under study ... 145
5.6 The second level: organizations ... 149
5.7 Combining analyses on threats and organizations ... 151
5.8 The third level: the transport system ... 151
6 The risk management framework as a continual cyclic process ... 153
6.1 Risk workshops ... 154
6.2 The support role of the analysis function ... 156
6.3 Decision making ... 157
6.4 The role of humans in the process ... 157
6.5 Continuous learning and coevolution ... 158
6.6 The risk management process summarized ... 159
7 Review: evolution of the process ... 160
8 Outlining a supporting software ... 161
9 Discussion ... 163
10 Conclusions ... 165
PART III – Validation ... 167
Chapter 8 - Validation of the proposed risk management framework ... 168
1 Validation against the developed requirements ... 169
2 Comparison with existing frameworks ... 173
3 Utility of developed concepts ... 176
Chapter 9 - Case study: The Finnish Transport Safety Agency ... 177
1 Trafi at the beginning of the project ... 177
1.1 Trafi mission, strategic objectives and organization ... 177
1.2 Safety data, risk identification and risk assessment ... 179
1.3 Decision making and taking action ... 180
2 Developments at Trafi during the TiTo project... 180
2.1 Background and objectives ... 180
2.2 Methods ... 181
2.3 Development and testing of NRMF components ... 182
3 Implementation of the developed process at Trafi ... 189
3.1 Results from the interviews ... 190
3.2 Independent study of the Trafi risk assessment method in aviation by the Technical Research Centre of Finland ... 191
4 Analysis of the Trafi Case Study ... 192
Conclusions ... 197
Future research ... 200
Résumé ... 216
Appendices ... 217
FIGURE 1.TOP TEN CAUSES OF DEATH AMONG PEOPLE AGED 15-29 YEARS WORLDWIDE,2012(WHO2015). ... 18
FIGURE 2.ROAD TRAFFIC DEATHS BY TYPE OF ROAD USER (WHO2015). ... 19
FIGURE 3.SIGNIFICANT RAILWAY ACCIDENTS AND RESULTING CASUALTIES FOR THE EU-28 COUNTRIES FOR 2007-2014. ... 19
FIGURE 4.RAILWAY AND PASSENGER FATALITY RISK FOR EU-28,USA,CANADA,S.KOREA,AUSTRALIA IN 2010-2014. ... 20
FIGURE 5.MARITIME TOTAL LOSSES BY TOP 10 REGIONS,2005-2014(ALLIANZ 2015). ... 20
FIGURE 6.WORLDWIDE COMMERCIAL JET FLEET ACCIDENT RATES AND ONBOARD FATALITIES BY YEAR:1959-2015. ... 21
FIGURE 7.AVIATION ACCIDENTS BY SECTOR IN FINLAND 2004-2014(TRAFI 2015A). ... 21
FIGURE 8.FATALITIES IN AVIATION BY SECTOR IN FINLAND 2004-2014(TRAFI 2015A). ... 22
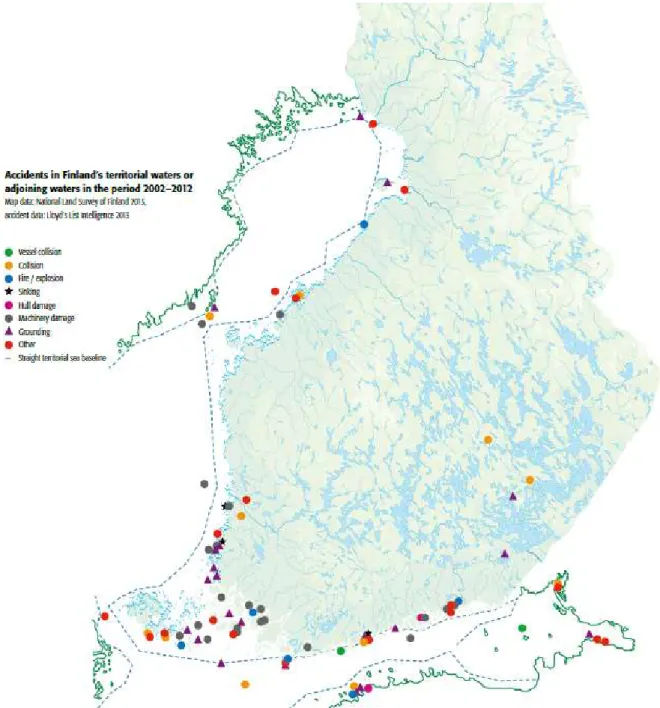
FIGURE 9.MARITIME ACCIDENTS AND HAZARDOUS SITUATIONS IN FINLAND 2002-2012(TRAFI 2013)... 22
FIGURE 10.MARITIME ACCIDENTS IN FINLAND 2002-2012(TRAFI 2013). ... 23
FIGURE 11. SIGNIFICANT RAILWAY ACCIDENTS IN FINLAND 2007-2013 BY TYPE OF ACCIDENT (TRAFI 2014B) ... 24
FIGURE 12.ROAD DEATHS PER MILLION INHABITANTS IN 2010 AND 2014 IN DIFFERENT EUROPEAN COUNTRIES (ETSC2015). ... 24
FIGURE 13.THE CYNEFIN FRAMEWORK.BASED ON KURTZ &SNOWDEN (2003). ... 55
FIGURE 14.THE FINNISH MARITIME CLUSTER (AALTO UNIVERSITY 2012). ... 60
FIGURE 15.PRESENTATION OF THE DEFENCES-IN-DEPTH OR THE “SLICES OF SWISS CHEESE”. ... 67
FIGURE 16.THE RISK MANAGEMENT PROCESS ACCORDING TO THE ISO31000 STANDARD... 107
FIGURE 17.EXAMPLE OF EVENT RISK ASSESSMENT.TWO EVENTS PLACED IN THE TWO-DIMENSIONAL SPACE. ... 122
FIGURE 18.EXAMPLE MATRIX FOR EVENT RISK ASSESSMENT, CUSTOMIZED FOR MARINE SAFETY EVENTS. ... 123
FIGURE 19.EXAMPLE OF RANKING SOME SAFETY FACTORS BY EVENT COUNT AND CUMULATED EVENT RISK. ... 127
FIGURE 20.EXAMPLE OF A RISK PICTURE. ... 132
FIGURE 21.TYPE IIRISK PICTURE. ... 136
FIGURE 22.DIFFERENT AREAS IN THE RISK PICTURE.. ... 138
FIGURE 23.PRESENTATION OF THREATS IN THE BLACK SWAN CORNER WITHIN THE TYPE IIRISK PICTURE. ... 140
FIGURE 24. PRESENTATION OF POTENTIAL INTERVENTIONS AND THEIR COST DIMENSIONS. ... 142
FIGURE 25.THE PROPOSED RISK MANAGEMENT PROCESS PRESENTED IN THE FORM OF THE ISO31000 FRAMEWORK. ... 159
FIGURE 26.EVENT RISK ASSESSMENT ENTRY MATRIX FOR RAILWAY EVENTS (EXTRACT). ... 182
FIGURE 27.COLUMNS FOR SAFETY FACTORS AND ALREADY MATERIALIZED ACTUAL OUTCOMES. ... 183
FIGURE 28.EXAMPLE OF EARLY APPLICATION OF EVENT RISK ON MARINE SAFETY EVENTS.N=381. ... 184
FIGURE 29.TRYING OUT THE RITUAL DISSENT METHOD. ... 187
FIGURE 30.THE AUTHOR ON THE BRIDGE OF A SHIP DURING THE RESILIENCE CAPTURE EXERCISE. ... 188
FIGURE 31.EXAMPLE OF THE CURRENT TEMPORARY SOLUTION AT TRAFI TO VISUALIZE AVIATION SCENARIOS IN THE RISK PICTURE. . 193
List of tables
Introduction
This work has been written for researchers and practitioners who are seeking to implement a modern risk management process for transport risks. It provides both a description of the risk management framework itself and the necessary theoretical knowledge for developing successful risk treatment strategies in the very challenging context.
Over the last ten to fifteen years, science has made significant advances in fields relevant for risk management. However, current risk management practices in industry have not yet benefitted much from these developments.
Most people associate risk with probability and severity. However, the current way to understand risk stresses the importance of uncertainty. The definition of risk by the International Organization for Standardization (ISO) might surprise many: “risk is the effect of uncertainty on objectives”. According to the current view, probability is only one way to try to address uncertainty, and often not the recommended one. The result of a risk assessment should include the assumptions and the associated uncertainties. The so-called Strength of Knowledge becomes an important concept and results of risk assessment are comparable only as far as the underlying assumptions are identical. Yet another important addition to the classic understanding of risk are the so-called black swans: high-impact-low-probability events. Due to the high impact, such threats need to be addressed even when traditional risk management would ignore them due to the low probabilities. All in all, understanding of risk and risk management has evolved significantly.
Another significant evolution is the one where the dominating Cartesian world-view with the notion that like for machines, the functioning of any system can be understood as a sum of its parts, has started to give room to another very different world-view. Systems thinking and research on complexity have shown that the behavior of complex systems is dominated by a large number of interactions and influences rather than direct cause-effect relationships. Such systems feature emergent phenomena which cannot be derived from the parts, as well as surprising, counter-intuitive and non-linear behaviors. Managing risks in a complex system is a very different task from doing it in a system which is perceived fully ordered.
The need for a new type of risk management framework is clearly identified in literature. For example, Abrahamsen et al. (2004) point out that “… to support decision makers facing choices involving uncertainties about outcomes… there is no authoritative guide on how to deal with such decision problems… how the risk analysis results should be evaluated, how cost/benefit analyses should be interpreted and used, etc.”. Aven (2013a) states: “it is a huge research topic to establish suitable ways of representing and treating the knowledge and surprise dimensions in risk assessment”. Aven & Krohn (2014) state the following: “We need a broader concept of risk to make risk management meaningful in a black swan world, and we need to incorporate the best ideas from different traditions, including the quality management and organizational learning”. Aven & Ylönen (2016) argue: “The risk assessment and management fields have developed considerably in recent years, but current industry practice, when it comes to for example the way to conduct and use risk assessments, has not changed much”.
The focus of this dissertation is on transport risks, taking the perspective of a national transport safety agency, tasked with overseeing safety across several modes of transport, including aviation, maritime, railway and road safety. The research question addressed is: What kind of risk management framework should be used for managing transport risks when the modern risk perspectives and the latest understanding of safety are embraced, and the transport system is considered a complex adaptive system?
The dissertation is divided into three parts. In Part I, the state-of-the-art literature for the relevant topics is reviewed, covering the concept of risk and risk assessment, complex adaptive systems and safety management. Specific chapters are dedicated for risk acceptance criteria and a review of current risk management frameworks. The review of safety management includes a discussion of human limitations and biases related to risk perception and decision making. Every topic ends with a synthesis and conclusions section where the key points are summarized and the adopted paradigms are highlighted. Importantly, through the literature review, requirements for a new risk management framework (NRMF) are gradually developed.
In Part II, a NRMF in line with the developed requirements is presented. It enables risks in all transport modes to be presented in a single risk picture and supports decision-making with the aim to maximize the safety impact achievable with limited resources. The impact is further enhanced by intervention strategies such as adaptive policies and experimentation, which are well-suited to complex systems. The presentation of the framework is organized according to the ISO 31000 international standard for risk management.
Part III covers the validation of the new framework. This is done by first showing that the developed framework complies with the requirements established in Part I (full coverage). Comparison with other existing risk management frameworks shows that the developed framework goes beyond the state-of-the-art. Finally, the applicability is demonstrated with a case study, describing how components of the framework have been implemented at the Finnish transport safety agency, Trafi.
Introduction to Part I
Part I covers the literature review for the topics relevant for this dissertation. The primary objective is to produce the scientific framework for designing a new improved risk management framework for a complex transport system. For this purpose, a set of requirements is gradually developed in the first six chapters. The requirements are summarized in Chapter 6.2.
The secondary objective of Part I is to provide the necessary theoretical background for people involved in the risk management process. For example, understanding the implications of the complexity (of the transport system) is essential for being able to design suitable interventions for reducing the risks. Due to this secondary objective, some topics are discussed in more length than would be necessary just for distilling the requirements for the risk management framework. This is the case especially for complexity and Safety-II.
The review is organized under several thematical chapters. Each chapter introduces the concepts, discusses them and ends with a synthesis which indicates the adopted paradigms. To make a clear distinction between what is said in the literature and the author’s own comments, the latter are expressed as much as possible in the synthesis sections.
Chapter 1 introduces the context of the transport system and the risks that exist within the system. The objective of this chapter is to give the overall context of the area of application and to show concretely what the risks under study are, and what kind of accidents are caused when these risks materialize. The chapter also contains the definitions of the key terms, as well as the limitations and delimitations.
Chapter 2 introduces the concept of risk and related key concepts, such as uncertainty, strength of knowledge and the so-called black swans. This chapter lays the foundations for risk analysis, risk evaluation and risk management.
Chapter 3 covers complexity and complex adaptive systems. This chapter explains what complex systems are, what their characteristics are and what are the implications for risk management and especially for risk treatment.
Chapter 4 looks into safety management. As safety and risk are two sides of the same coin, many relevant concepts have emerged primarily in the context of safety and safety management, for instance the concept of resilience. Topics discussed in this chapter have implications for risk identification, risk analysis and risk treatment. The chapter also covers parts of human factors research relevant to risk management. Importantly, human biases and heuristics which may play important roles in risk perception and decision-making are introduced.
Only after having developed the concepts in these four chapters will it be possible to discuss the difficult topic of acceptability of risks. This is done in Chapter 5, which covers risk acceptance criteria and their ethical bases.
Chapter 6 completes the literature review. First, existing guidance for risk management frameworks is reviewed. It is then possible to establish the full list of requirements for the risk management framework. Finally, existing risk management frameworks both from industry and scientific literature are introduced.
Chapter 1 – Setting the context
This chapter introduces the context of risks within the transport system. Some of the key properties of the transport system and its different modes of transport are outlined as well as the volumes involved. On the other hand, the focus will be on the risks - in other words, what can go wrong within the system and what are the consequences. To get concretely in touch with transport risks, some existing accident statistics are presented for the four modes of transport. Besides looking at worldwide statistics and statistics at the European level, a more tangible picture is drawn by taking a single country as an example and looking at transport safety statistics within that one country. This also makes sense because the scope of a transport safety agency is typically a single country. In addition to presenting the basics of transport systems, the purpose is to show why risk management within the transport system is both useful and necessary. The chapter ends with definitions and scoping of the presented research.
1 Importance of managing transport risks
The easiest way to describe the transport system is to say that it consists of everything involved with transporting people and goods. Typically, one can list four modes of transport: aviation, marine, railway and road transport. These include also light transport such as bikes and pedestrians. The system includes the infrastructure, the transport vehicles, the people, the organizations, the processes, the policies and so on. Some of the transport is commercial while a big part of it involves private people. There are also many hobbies which involve becoming part of the transport system even if the purpose is more leisure than going from one place to another: examples include sailing, parachuting and gliding. Even private drones become part of the transport system because they interfere with the rest of the system and require careful attention from the authorities and operators. The transport system is an open system so it is exposed to influences and constraints coming from the world around it. Examples of outside influences include impact of fuel prices, need for tightened security, availability of land for building new airports, pressures and regulations concerning emissions & noise and different levels of border controls and immigration procedures.
There is a commercial transport fleet of over 26,000 aircraft carrying yearly over 5 billion passengers and over 50 million tons of freight (ICAO 2015). In the EU alone, there are 880 million passengers for air travel yearly, and regional and suburban trains carry 10 times that amount being at equal level with all European metros combined, and accounting for 90% of railway passengers (ERRAC 2016). There are about 58 billion public transport journeys made in the EU yearly (UITP 2016). The worldwide commercial maritime fleet consists of roughly 90,000 vessels, carrying seaborne shipments of about 10 billion tons per year (UNCTAD 2015). It is estimated that over 90% of trade is transported by sea (Allianz 2015).
Transport acts as a key enabler and catalyst for many desirable developments. In 2015, the United Nations General Assembly adopted the resolution 70/1 introducing the 2030 agenda for sustainable development. The resolution contains 17 Sustainable Development Goals (SDGs) which split down further to 169 targets (United Nations 2015). Of these 169 targets, five are directly related to transport. Furthermore, transport is a critical enabler for at least 6 other important targets, such as access to safe drinking water, sustainable cities, reduction of food loss, agricultural productivity, air pollution and climate change mitigation (United Nations 2016).
While transport is an important part of modern societies, it also introduces risks of its own. An inherent feature of transport is moving people and goods around with a certain speed, which involves kinetic energy. This energy, often together with the presence of inflammable fuels, creates a hazard with the potential for accidents. Transport may also involve taking people to environments where they would not naturally survive, like under water or high in the atmosphere. In such cases, the safety of people is fully
dependent on the technical system providing the necessary life supporting conditions - and this introduces vulnerabilities against some specific accident types like fires.
The typical direct consequences of accidents are loss of life, injuries, environmental damage and material damages. There are, however, other potential consequences like loss of reputation, damage to a commercial brand, loss of business and social or political crises following an accident. In the following pages, some examples of accident statistics are presented. The purpose here is not to start analyzing the accidents nor drawing conclusions from the statistics but rather observe the existence of accidents in all the transport modes and appreciate their consequences. The first presented statistics are worldwide or European wide. Thereafter, in the interest of producing a more detailed and tangible example, statistics are presented concerning a single country, Finland – this also serves as a background for the case study in Part III.
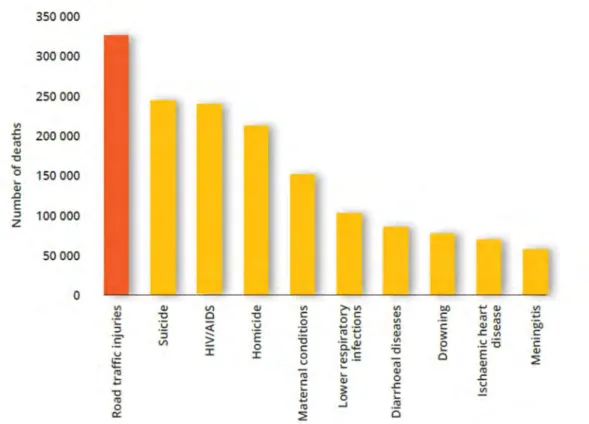
In road traffic alone, over 1.2 million people die each year worldwide. In addition to the deaths, up to 50 million people incur nonfatal injuries each year as a result of road traffic crashes. As Figure 1 indicates, this makes road traffic crashes the main cause of death among those aged 15 to 29 years (WHO 2015).
Figure 1. Top ten causes of death among people aged 15-29 years worldwide, 2012 (WHO 2015).
Figure 2 presents road traffic deaths by the type of user. It highlights the fact that there are many different types of road users each with their own safety concerns.
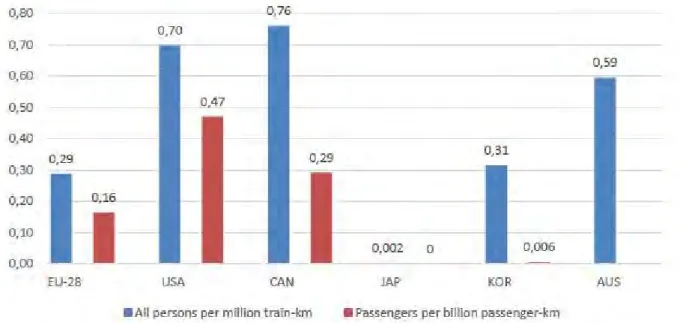
There are still about 1000 yearly fatalities from significant railway accidents within the European Union, as Figure 3 shows. The numbers in the rest of the world are typically worse, as Figure 4 shows through examples from some highly developed non-EU countries.
In the maritime domain, there were 2773 safety incidents (“casualties”) in 2014 of which 75 were total losses (Allianz 2015). Figure 5 presents the geographical location of the total losses for the time period 2005-2014.
Figure 2. Road traffic deaths by type of road user (WHO 2015).
Figure 4. Railway fatality risk and passenger fatality risk for EU-28, USA, Canada, South Korea and Australia in 2010-2014 (ERA 2016).
Figure 5. Maritime total losses by top 10 regions, 2005-2014 (Allianz 2015).
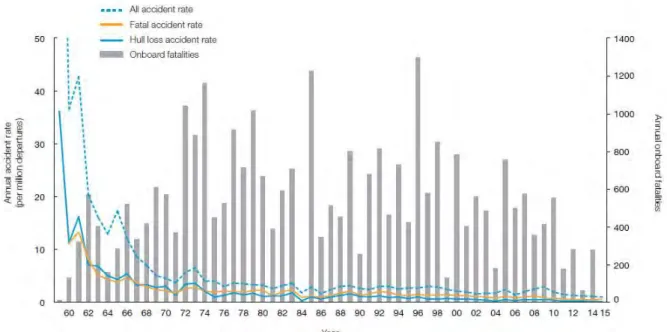
Normalized by passenger kilometers, commercial aviation is the safest of the four transport modes (ERA 2016). Fatal commercial aviation accidents are rare but painfully visible events under strong media scrutiny. Figure 6 presents the commercial jet aviation accident rates and fatalities for 1959-2015. The fatal accident rate is less than 1 per a million departures, but the curve has become asymptotic: the rate is not improving. This is worrying as global air traffic has doubled in size once every 15 years since 1977 and is expected to continue to do so (ICAO 2016). It can also be observed that when accidents are this rare, the absolute number of fatalities vary significantly and quasi-randomly from one year to
another (influenced by the accident rate and accident types, but also by the somewhat arbitrary number of passengers on board the accident flights).
Figure 6. Worldwide commercial jet fleet accident rates and onboard fatalities by year: 1959-2015 (Boeing 2016).
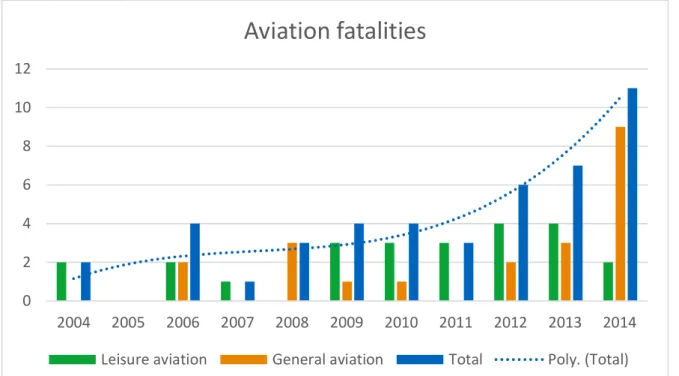
The remaining figures in this chapter illustrate the reality of transport accidents in Finland. All the modes of transport are well represented in Finland due to long distances (road traffic, aviation, railways) and marine traffic both on the lakes and on the Baltic sea. Figure 7 and Figure 8 present aviation accidents in Finland in the period 2004-2014. It is worth noting that these statistics include leisure and general aviation. In the time period under study, there were no accidents within the commercial aviation category.
Figure 7. Aviation accidents by sector in Finland 2004-2014 (Trafi 2015a).
0 2 4 6 8 10 12 14 16 18 20 2004 2005 2006 2007 2008 2009 2010 2011 2012 2013 2014
Aviation accidents in Finland
Figure 8. Fatalities in aviation by sector in Finland 2004-2014 (Trafi 2015a).
Figure 9 and Figure 10 highlight a 10-year snapshot of marine accidents/incidents in Finland both in terms of event severity and geographical location.
Figure 9. Maritime accidents and hazardous situations in Finland 2002-2012 (Trafi 2013a).
0 2 4 6 8 10 12 2004 2005 2006 2007 2008 2009 2010 2011 2012 2013 2014
Aviation fatalities
Leisure aviation General aviation Total Poly. (Total)
0 1 2 3 4 5 6 7 8 2002 2003 2004 2005 2006 2007 2008 2009 2010 2011 2012
Maritime accidents and hazardous situations
Figure 10. Maritime accidents in Finland 2002-2012 (Trafi 2013a).
Figure 11 gives an overview of rail safety in Finland. Most accidents happen at level crossings or are accidents to persons, but there are still some derailments. All in all, every year 10-25 events classified as significant accidents take place.
In 2015, there were 266 fatalities and 6385 injuries in the road traffic in Finland (Statistics Finland 2016). Figure 12 shows Finland’s (FI) position among European countries and the evolution between 2010 and 2014. There is a significant difference between the best and the worst countries in Europe – a factor of five, roughly.
Figure 11. Significant railway accidents in Finland 2007-2013 by type of accident (Trafi 2014b)
Figure 12. Road deaths per million inhabitants in 2010 and 2014 in different European countries (ETSC 2015).
0 5 10 15 20 25 30 2007 2008 2009 2010 2011 2012 2013 2014
Other types of accidents
Fires in rolling stock
Accidents to persons caused by rolling stock in motion
Level crossing accidents
Derailments
The above statistics confirm that accidents occur in all four modes of transport. This means that there are real risks present in the transport system every day. On one hand, one must conclude that even though major catastrophes have become rare, their occurrence is fully possible anywhere, anytime. On the other hand, Figure 7 and Figure 8 remind that next to the commercial transport operations there is often a lively leisure activity which is visible in the transport statistics - unfortunately also in the form of accidents. This highlights the challenge of being able to allocate safety resources adequately between different types of transport-related activities, including the leisure activities. This is where a proper risk management framework must support the decision-makers.
Finally, reviewing the various accident types is also important in the sense that risk is always assessed against a reference and one needs to know what that reference is. In the case of transport risk management, the reference outcome that one wants to avoid is an accident. Having a clear understanding of this is a prerequisite for carrying out risk assessment and risk management correctly. Avoiding these accidents is the most obvious purpose of risk management within the transport system. This does not mean that accident avoidance is the only purpose for risk management, as it may typically have other benefits addressing more minor negative consequences and contributing to system improvement in general.
2 Definitions
The key scientific reference for risk-related definitions in this work is the Glossary published by the Society for Risk Analysis in June 2015 (Society for Risk Analysis 2015a). The 11 members of the committee behind the glossary are all recognized experts in risk analysis and their work is known through scientific peer-reviewed articles. Thanks to the committee membership, the endorsement of the Society for Risk Analysis, and the fairly recent publication date, this glossary can be considered the most credible up-to-date scientific authoritative guidance on risk analysis terminology.
Risk is naturally the most important concept in this work and the topic is discussed at length in the next chapter. Several definitions for risk exist due to its wide use in different disciplines, not to mention its flexible use in everyday language. The SRA glossary refers to risk in relation to the consequences (effects, implication) of a future activity (interpreted in a wide sense to cover, for example, natural phenomena) with respect to something that humans value. The consequences are often seen in relation to some reference value (planned values, objectives) and the focus is often on negative, undesirable consequences. There is always at least one outcome that is considered as negative or undesirable. The glossary then lists seven different possible qualitative definitions for risk, out of which the following can be used as the reference in this work: risk is uncertainty about and severity of the consequences of an activity with respect to something that humans value.
Separate from the risk concept, one can talk about the risk description (or metric), i.e. how does one try to describe or measure risk in practice. As discussed in the next chapter, the adopted risk description is one where risk is described with the triplet of Consequences, measure of the associated Uncertainty and the background Knowledge that supports the two.
The SRA glossary defines probability as a measure for representing or expressing uncertainty, variation of beliefs, following the rules of probability calculus. The more specific interpretation of probability for the purposes of the dissertation is the subjective probability with an uncertainty standard: the probability P(A) is the number such that the uncertainty about the occurrence of A is considered equivalent (by the person assigning the probability) to the uncertainty about some standard event, e.g. drawing at random a red ball from an urn that contains P(A) x 100% red balls.
Uncertainty can be defined both as imperfect or incomplete information/knowledge about a hypothesis, a quantity, or the occurrence of an event; or for a person (or a group of persons) not knowing the true value of a quantity or the future consequences of an activity.
Risk management is defined as activities to handle risk, such as prevention, mitigation, adaptation or sharing.
Risk mitigation and risk reduction are both defined identically as the process of actions to reduce risk.
The International Organization for Standardization (ISO) has also published a standard in risk management “ISO 31000 Risk management – Principles and guidelines” (ISO 2009). In comparison to the above SRA glossary definitions, the ISO standard contains the following definitions:
Risk is the effect of uncertainty on objectives.
Risk Management is defined as coordinated activities to direct and control an organization with regard to risk.
Risk management framework (RMF) is a set of components that provide the foundations and organizational arrangements for designing, implementing, monitoring, reviewing, and continually improving risk management throughout the organization.
Risk identification is the process of finding, recognizing and describing risks based on historical data, theoretical analysis, expert opinions, etc.
Risk analysis is the process to comprehend the nature of risk and to determine the level of risk. It includes risk estimation, and provides the basis for risk evaluation, which is the process of comparing the results of risk analysis with risk criteria to determine whether the risk and/or its magnitude is acceptable or tolerable.
The term risk assessment can be used to describe the overall process of risk identification, risk analysis and risk evaluation.
The process to modify risk is called Risk Treatment.
Individual measures modifying risk are called (risk) Controls. Earlier literature uses terms such as (risk/safety) barrier, defence or safeguard (Reason 1990, Maurino et al. 1995, Hollnagel 2004).
Consequence is the outcome of an event affecting objectives. Likelihood is the chance of something happening.
This ISO standard has been criticized for not being a proper scientific framework (see e.g. Aven 2011a). In this work, the SRA glossary provides the scientific framework while the ISO terminology is used in a limited way to help organize the deliverable:
The New Risk Management Framework proposed in this dissertation can be referred to with the abbreviation NRMF.
The related process steps in Part II follow the ISO flow: risk identification, analysis, evaluation and treatment.
Consequently, the term risk treatment is used more than risk reduction/mitigation. The terms consequence and outcome are used interchangeably
Some other key terms used in this dissertation include:
Components within the risk management framework are often referred to as methods in this dissertation. For example, the method for event risk assessment and the way to run risk workshops are both components of the risk management framework.
Loss can be seen as a risk which has materialized. An accident would be a typical loss. Losses are also the outcomes that one tries to avoid through risk management.
The term accident is generally understood as an unforeseen and unplanned event or circumstance that (1) happens unpredictably without discernible human intention or observable cause and (2) lead to loss or injury (Hollnagel 2004). The term has many different definitions within different transport domains and there is usually an attempt to give a more precise description of the level of damage involved. The
International Civil Aviation Organization ICAO (2001) gives the following definition in its Annex 13 (Aircraft Accident and Incident Investigation):
An accident is defined as:
An occurrence associated with the operation of an aircraft which takes place between the time any person boards the aircraft with the intention of flight until such time as all such persons have disembarked, in which:
a) a person is fatally or seriously injured as a result of:
being in the aircraft, or
direct contact with any part of the aircraft, including parts which have become detached from the aircraft, or
direct exposure to jet blast
except when the injuries are from natural causes, self-inflicted or inflicted by other persons, or when the injuries are to stowaways hiding outside the areas normally available to the passengers and crew; or
b) the aircraft sustains damage or structural failure which:
adversely affects the structural strength, performance or flight characteristics of the aircraft, and
would normally require major repair or replacement of the affected component,
except for engine failure or damage, when the damage is limited to the engine, its cowlings or accessories; or for damage limited to propellers, wing tips, antennas, tires, brakes, fairings, small dents or puncture holes in the aircraft skin; or
c) the aircraft is missing or is completely inaccessible.
Note 1.— For statistical uniformity only, an injury resulting in death within thirty days of the date of the accident is classified as a fatal injury by ICAO.
Note 2.— An aircraft is considered to be missing when the official search has been terminated and the wreckage has not been located.
For the purpose of this dissertation, the following pragmatic definition for an accident is applied: Accident is an unintended event associated with a transport operation, resulting in a loss which could include human, environmental, financial and other dimensions.
An incident is defined as an operational event which either resulted in some losses but not to the extent of being considered an accident; or had the potential to become an accident. Again, more specific definitions would be available for different modes of transport.
Definitions for the term safety are discussed in Chapter 4. There is a distinction between safety and security - the latter addressing intentional acts of harm. In the world of safety and safety risk management, there may be known and hidden risks in the system, but nobody is intentionally trying to produce an accident.
The term safety event can be used for any operational event which could be considered to have safety implications, irrespective of whether it reaches the defined thresholds for becoming an incident or an accident in the official sense.
In the context of mandatory reporting of safety events to the authorities, the terms occurrence and mandatory occurrence reporting are often used. In this respect, occurrences are simply safety events which fulfill the criteria for being officially reported to the authorities.
In the context of safety events, losses and risk, it is important to highlight the difference between actual and potential outcomes. The actual outcomes of an event are the tangible outcomes of the event in the real world as the event unfolded. The potential outcomes refer to the outcomes that could have resulted in if the event had escalated and become an accident (or an incident). For example, in a near-collision between two large passenger aircraft the actual outcome is ”nothing”, but the potential outcome is a
midair collision with several hundred fatalities. The term potential outcome is often used in the context of a specific scenario.
Severity refers to the magnitude of loss (damage, harm, etc.). In the context of risk assessment, severity usually refers to a scenario (of loss) which is possible but which has not yet materialized. Therefore, in this context the focus is on a potential severity associated with the scenario.
In this dissertation, there is a hierarchy between three important terms related to safety and accidents: hazard, safety issue and scenario. A hazard is the most generic of these three terms. The definition of hazard can be based on the following SRA glossary definitions:
Harm is physical or psychological injury or damage Damage is loss of something desirable.
Risk source is an element (action, sub-activity, component, system, event, etc.) which alone or in combination with other elements has the potential to give rise to some specified (typically undesirable) consequences.
Hazard is a risk source where the potential consequences relate to harm.
For example, a strong gusty wind is a hazard. Inflammable fuel is another hazard. A safety issue is defined as a specific concern about a certain type of accident risk in a specific context. It can be seen as a hazard or a combination of hazards in a specific defined context. For example, an operator may consider its operation to a specific airport a safety issue due to specific hazards associated with that operation (frequent strong gusty crosswind, frequent bird activity, short runway, etc.). Typically, a safety issue may be identified due to one or more safety events. For example, fatigue reports emerging repeatedly from a specific route may lead to the identification of the related safety issue. A scenario is a more detailed description of how a specific accident type can develop within a given safety issue. A single safety issue may contain several scenarios. For example, incorrect loading of an aircraft may be identified as a safety issue. That safety issue could contain several scenarios: a) loss of control due to unfastened cargo moving during the flight; b) loss of control due to overweight; c) loss of control due to center of gravity out of limits. Usually a scenario is the level at which risk can be assessed, i.e. one cannot perform risk assessment on a hazard.
Safety issues and scenarios can also be called threats. In other words, the meaning given to threat in this dissertation is slightly more specific than that of hazard. The term threat can be useful as for different people the term “risk” could mean both the “situation or event where something of human value is at stake and where the outcome is uncertain” and the “expected value/probability” (Aven 2014a, pp. 230-231) i.e. the magnitude of the risk. One can say ”there is a risk of a structural failure here”; and one can ask, ”how high is the risk related to investment A?” The term threat then refers only to the first meaning, i.e. the safety issue/scenario meaning of the word.
A risk picture is a visual presentation where several risks are presented simultaneously so that their characteristics and importance can be compared. Ideally, a risk picture helps to gain an overall understanding of safety and risks within a certain system or operation and thereby supports prioritization and decision making. Based on the above definition of the term threat, the risk picture could also be called ”picture of threats”.
The terms data and information are so widely used in everyday language that it is difficult to give them any specific meanings. A generic scientific definition is developed in Chapter 3.5.3 by introducing the Data-Information-Knowledge-Wisdom (DIKW) framework. In the context of transport safety, the term (safety) data can also be used for the safety information which is collected from the operations and arrives to the safety agency as an input to the risk management process. In the most typical case, this data comes from an operator and the operator has already processed the raw data to a more refined format through the use of keywords, categories, etc. An occurrence report would be the most typical example. Raw data is safety data in its initial state as received from the initiator (human or technical) before the data is processed in any way. In the same context, Safety information can be understood as
a more generic term and can be used - for example - for referring to an awareness of current operational conditions and practices, as well as overall information about a particular operator and its operational and safety practices.
3 Limitations and delimitations
The chosen topic implies two main limitations, one related to the concept of risk and the other stemming from the fact that the transportation system is already extremely safe.
Risk is an abstract concept. Unlike accidents which have measurable and quantifiable real-world consequences, risk cannot be touched nor measured in the real physical world. Risk only exists in the minds of people. Therefore, by definition, it is subjective. There is no doubt that the chosen methodology for risk assessment will have an impact on the level of subjectivity in the result and one can try to reduce subjectivity through appropriate design of the methodology. The important remaining limitation is that the final correct answer is not available anywhere. Any result related to risk assessment can always be challenged and no authority possesses the right answer.
Ironically, the context of dealing with very safe systems leads to another limitation which has implications on the validation of the work. It is common practice to relate the safety of a transport system to how many accidents and fatalities it suffers compared to the volume of traffic (see e.g. International Transport Forum 2015, p. 14, where “road safety performance” is illustrated by statistics on road fatalities per inhabitants and vehicle-kilometers; or Trafi 2013b, p. 16, where the “status of aviation safety” is presented through statistics on accidents per 10.000 flight hours). Unsafe systems would have a lot of accidents, and safety improvements in such systems could be validated by observing the resulting reduction in accidents. In very safe systems however, there are already hardly any accidents. Therefore, accident data cannot be used to validate any safety improvement. Amalberti (2001) has discussed this in length and introduced the term ultra-safe systems. He notes that the time duration necessary for seeing the effect of a safety measure in accident statistics becomes excessively long (Amalberti (1999) quotes a delay of four years for a system with a 10-5 accident rate and about six years with a 10-7 accident rate). Attributing improvement to a specific measure becomes virtually impossible due to the thousands of changes the system would experience in such a time period. As will be seen, complex systems are particularly intractable in this respect. In road traffic where there is a considerable number of fatalities each year, improvements should be more quantifiable. However, even there it would be difficult to prove what the factors behind the improvements are.
The main delimitation is that the focus is on safety in the classic sense, i.e. malicious acts are outside the scope. This means that the risk management framework is developed for safety risks, not for security risks. The dynamics change significantly when somebody is actively trying to breach the barriers and to maximize losses. Despite this delimitation, security is kept in mind as an important constraint and priority which needs to be considered when interventions are designed, especially that safety and security concerns are often in conflict: e.g. securitywise, cockpit doors should be unbreakable while safetywise they should be easy to open in case of evacuation or incapacitation of a pilot.
Chapter 2 – Current perspective to the concept of risk
The objective of this chapter is to gradually develop the different aspects of the modern understanding of risk, so that the new proposed risk management framework (NRMF) is based on this solid foundation.For the past decades, the most common way to understand risk has been to consider it as a combination of probabilities and consequences. For example, the nuclear industry which developed detailed methodologies for system safety analyses, adopted a quantitative definition of risk, where each scenario si is linked with the corresponding probability pi and associated consequences ci (Hafver et al. 2015, Jore & Egeli 2015). Such an approach to risk can be associated with the so-called classical positivist view on risk. The positivist view sees risks as something that exists objectively and the analysis as a tool to estimate the objective risk. In the positivist worldview, risk consists of physical facts that can be explained, predicted and controlled. The obtained values for risk are then considered objectively true and free of value judgments (Jore & Egeli 2015). The practical methods used are based on probabilities and expected values.
Anyone having worked in industry during the last few decades and having been exposed to safety work or risk management can confirm the dominance of this very simple view of risk as an expected value, dealing with probability and severity of consequences. Aven & Ylönen (2016) note that while the risk assessment and management fields have developed considerably in recent years, the current industry practice in terms of risk assessments has not changed very much from the times when the tools were developed in the 70s and 80s. This can be verified by reviewing some of the guidance documents and method reviews related to risk management within different industries. Examples can be found in ICAO (2013, p. 5-20), SMICG (2013), FAA (2014, p. 34), Khan et al. (2015, p. 123), IMO (2006, p.2), Montewka et al. (2014, p. 79), RSSB (2009, p. 12).
A more recent view on risk is the so-called constructivist perspective. This view is based on the finding that the probability-based perspective on risk is too narrow and it does not adequately address the uncertainty related to different possible consequences. According to this view, probability is only one way to describe uncertainty and the concept of risk must take into account other important aspects such as the knowledge dimension, the unforeseen and potential surprises (Aven 2013, Aven & Krohn 2014, Jore & Egeli 2015). It is argued that risks expressed as expected values do not reflect the knowledge in which they are based. The so-called strength-of-knowledge (SoK) dimension becomes a key aspect of risk (Aven & Krohn 2014). For example, consider two scenarios which have the same potential negative consequence and the assigned (subjective) probability of this consequence is the same in both scenarios. However, it may be that in one case there is high level of certainty about the probability, whereas in the second scenario the strength of knowledge is very weak. From the classical positivist point of view the two scenarios would have the same risk. However, from the constructivist perspective the two cases would be different because of the different levels of uncertainty. Aven (2012) proposes a way to denote risk along this modern view as (C, U) where C denotes the future consequences of the activity and U expresses that C is unknown. Another symbol A can be added to denote the hazards/threats: (A, C, U). One can also stress the knowledge dimension by describing risk as (C, Q, K) where Q is a measure of uncertainty, and K is the background knowledge that C and Q are based on (Aven & Krohn 2014). It is worth noting that the current official international definition of risk by the International Organization for Standardization (ISO) is also based on the concept of uncertainty: risk is defined as effect of uncertainty on objectives (ISO 2009).
What is common to the different views on risk is that, first of all, the focus is on the future, and secondly one tries to assess the potential negative impact of one or more scenarios. This negative impact is on something that humans value, typically harm to humans, the environment or material assets. One may
also consider effects such as loss of revenue and social disruption. The harm on humans could include death, injury, permanent disability, or illness. These could affect workers, users, members of the public, or even unborn generations (Johansen & Rausand 2014).
Abrahamsen et al. (2004) argue that risk analyses are always based on background information - even simple calculations of expected values. Difficult ethical and political deliberations involving complex value judgments cannot be achieved through a simple mathematical formula. The background information must always be reviewed with the proposed results. With the above considerations, it becomes obvious that representing risk with a simple number would be very undesirable as this would not at all reflect the associated assumptions and value judgments (Montewka et al. 2014). One compromise between a simple number and very comprehensive risk descriptions is to use a vector consisting of the outcome component and the probability component (Johansen & Rausand 2014).
Aven (2012) summarizes the discussion on risk definitions by saying that there is no agreed definition of the concept of risk. Literature includes a number of different ways of understanding the risk concept. He also highlights two important characteristics of a risk definition. First, risk should be defined in such a way that there is a distinction between risk per se and how risk is managed. Second, the risk definition should allow distinguishing between risk per se and how risk is perceived.
Montewka et al. (2014) propose a terminology where risk concept concerns “what risk means in itself” i.e. “what risk is”; a risk perspective is “a way to describe risk, analyze and make statements about risk”; and a risk metric is “the assignment of numerical value to an aspect of risk according to a certain standard or rule”.
Despite the lack of a universal agreement on the definition of risk, it is clear that the modern risk perspective, focusing on uncertainty, knowledge and surprises, is gaining ground. The Specialty Group on Foundational Issues in Risk Analysis of the SRA, consisting of nine experienced and active researchers, has published the document “Risk Analysis Foundations” (SRA 2015b). The importance of both the knowledge dimension as such and surprises is highlighted, and the concept of Strength of Knowledge is promoted as a broader way of expressing the uncertainties than the probability assignments alone. Both the SRA Glossary (2015a) and the ISO definition are in line with the modern view and there are even the first signs of industry picking up the new risk perspectives (Aven & Ylönen 2016). Aven (2013a) summarizes the so-called new risk perspective as the sum of:
Probability-based thinking Knowledge dimension Surprises (black swans)
These three aspects are discussed in the following three sections. The fourth section introduces the concept of risk aversion as it will be a recurring topic in Part I.
1 Clarifying the concept of probability
Aven (2012) points out that many different risk definitions and interpretations are closely related to different understandings of probability. There is still substantial discussion within the scientific community around the meaning and interpretation of probability. The objectivist (or frequentist) view is that probability is primarily a physical characteristic reflected in the relative frequency within a repeatable experiment, e.g. when throwing the dice. According to the subjectivist view, probability is a personal belief and it is never possible to know probabilities for certain. Aven & Reniers (2013) bring up the fact that it is often very difficult to apply the (frequentist) concept of repeatable experiments in the real world. Can, for example, different oil drilling platforms be considered “similar” in the sense that the operation on each one of them together build up the “population” and an accident probability could be interpreted as a number of times the “experiment” of safe operation fails in this population? Or, if the average accident rate on a commercial flight is one in 5 million, can all these flights be considered similar enough to interpret the accident probability for a given flight as one in 5 million?
Paradoxically, the individual oil drilling platforms or the individual flights should be similar enough to allow this interpretation, but not too similar either, because otherwise they would all either have an accident or not. As Aven notes, it is difficult to specify what should be the (fixed) framework conditions for the situations in the population and what could be varying.
The subjectivist view can be completed with an uncertainty standard, i.e. a concrete example of uncertainty given as a reference. For example, if a person assigns the probability of 0.1 for an event E, the person compares the uncertainty (or degree of belief) of E occurring, with drawing a specific ball from an urn containing 10 balls. Aven & Reniers (2013) argue that if the separation is required between uncertainty assessments per se and value judgments, there is only one universally applicable probability concept. It is the subjective probability with a reference to an uncertainty standard. They also note that the term subjective probability may sound non-scientific, and therefore it is sometimes replaced by other terms such as judgmental or knowledge-based probability. In this dissertation, probability is understood as the subjective probability, unless when specifically stated otherwise.
2 The knowledge dimension of risk
In real systems, uncertainty is a key aspect of risk assessment. According to Bjerga & Aven (2015), the uncertainty is related to potential future events and consequences and is due to limitations in knowledge. There is uncertainty both on the system model and the input parameters, either because these are not known or there is no shared view on these between the stakeholders. The real-life system cannot be characterized exactly because the knowledge of the underlying phenomena is incomplete (Aven & Zio 2011). According to Paté-Cornell (2002), uncertainties can be divided into two categories: epistemic and aleatory. The former result from the lack of fundamental knowledge while the latter reflect randomness in a well-defined statistical sample.
Makridakis et al. (2009) list empirical evidence related to future uncertainty. The list contains, for example:
The future is never exactly like the past. The extrapolation of past patterns or relationships cannot provide accurate predictions.
Statistically sophisticated, or complex, models fit past data well but do not necessarily predict the future accurately.
Both statistical models and human judgment have been unable to capture the full extent of future uncertainty.
Forecasts made by experts are no more accurate than those of knowledgeable individuals. These points cast a serious doubt on the capability to reduce uncertainty in risk assessment through system modellization.
Complex systems will be the topic of Chapter 3. In complex systems, there is yet another dimension of uncertainty: the nature of the system is such that it does not allow the full understanding of the system logic nor reliable prediction of the system behavior (Bjerga et al. 2016). There is a fundamental shift here from “unknown” to “unknowable”. Like Walker et al. (2010) state: “Most of the important policy problems currently faced by policymakers are characterized by high levels of uncertainty, which cannot be reduced by gathering more information. The uncertainties are unknowable at the present time, but will be reduced over time.”
In addition to uncertainty related to lack of knowledge and the impossibility to model intractable (complex) systems, there are also fundamental surprises, “black swans” which will be discussed in Chapter 2.3. In conclusion, people engaged in risk management will have to learn to deal with uncertainty.
Acknowledging the role of uncertainty in risk assessment entails on one hand dealing with the uncertainty during the risk assessment, and on the other hand, communicating on the uncertainties in
relation to the results obtained. As Abrahamsen et al. (2004) note, risk analyses are based on background information that must be reviewed together with the results.
In terms of dealing with the uncertainty during risk assessment, two topics remain to be discussed. First, several ways to assess (and possibly categorize) the level of uncertainty have been proposed. The aim here is to gain an understanding on how much uncertainty the risk assessment contains and to communicate that in an understandable and comparable way together with the results of the risk assessment. Secondly, the main objective of the risk assessment still remains: there needs to be a way to obtain useful results despite the uncertainty. The following paragraphs address these two topics.
Montewka et al. (2014) refer to knowledge on model parameters as knowledge (K) and understanding of the system behavior as understanding (N). They adopt the symbology:
∆ ⁓ {K, N}
Where ∆ represents the set of knowledge and understanding dimensions used within the risk model. They formulate risk as:
R ⁓ {A, C, Q}|∆
Where A denotes events, C consequences, Q uncertainty analysis (in line with Aven & Zio 2011) and the |∆ shows that all elements of the risk description are conditional upon knowledge and understanding. Montewka et al. (2014) also propose a simple qualitative uncertainty assessment method. Quality of knowledge (K) is graded on a scale good-moderate-poor and level of understanding (N) is graded on a scale high-medium-low. Some descriptors are given for each category to guide the assessment process. A classification table is given for defining the final result (L-M-H) based on these two components. For example, low knowledge together with medium understanding would result in a medium uncertainty level. Montewka et al. combine the obtained parameter uncertainty with parameter sensitivity to derive what they call parameter importance. The idea is, that increasing uncertainty combined with high sensitivity means that the parameter has a high uncertainty impact on the result of the risk assessment. On the other hand, high uncertainty of a parameter may not be so important if the sensitivity of the risk assessment for this parameter is very low. This presented method provides a way to present the perceived uncertainties in a systematic way and point out the most critical parameters, which may deserve further investigation.
Walker et al. (2010) present a classification of uncertainty into four levels. In summary: Level I uncertainty can be described adequately in statistical terms.
Level II uncertainty implies that there are alternative trend-based futures and/or different parameterizations of the system model. Level II uncertainty is often captured in the form of a few trend-based scenarios based on alternative assumptions. The scenarios are then ranked accordingly to their likelihood.
Level III uncertainty represents deep uncertainty about the mechanisms and functional relationships being studied. There is little scientific basis for placing believable probabilities on scenarios. Level III uncertainty is often captured in the form of a wide range of plausible scenarios.
Level IV uncertainty implies the deepest level of recognized uncertainty. In this case we only know that we do not know.
Broadly speaking, levels I and II correspond with what Makridakis et al. (2009) call “Subway uncertainty”, and levels III and IV correspond with “Coconut uncertainty” (Walker et al. 2010). The word picture of subway uncertainty relates with statistical variance in the time a given someone arrives to work using the subway. The word picture of coconut uncertainty refers to the very rare but possible occasion where a coconut drops on a tourist’s head causing a fatality. Aven (2013b) notes that at levels I and II, uncertainties can be represented by probabilities, and at levels III and IV this is not possible.
Paté-Cornell (2002) argues that the use of expert judgment is simply unavoidable. One can try to increase the strength of knowledge to the practical maximum by collecting as much of the relevant information as feasible. For the rest, all assumptions have to be described clearly and results can be compared only to the extent that they have been computed on comparable bases (e.g. if different scenarios have been risk assessed with different levels of conservatism in the assumptions, the related results are not comparable).
Walker et al. (2010) refer to deep uncertainty as “the condition in which analysts do not know or the parties to a decision cannot agree upon:
the appropriate models to describe interactions among a system’s variables
the probability distributions to represent uncertainty about key parameters in the models and/or how to value the desirability of alternative outcomes.”
Cox (2012) characterizes deep uncertainty in the following way:
Well-validated trustworthy risk models giving the probabilities of future consequences for alternative present decisions are not available,
The relevance of past data for predicting future outcomes is in doubt,
Experts disagree about the probable consequences of alternative policies - or, worse, reach an unwarranted consensus that replaces acknowledgment of uncertainties and information gaps with groupthink, and
Policymakers (and probably various political constituencies) are divided about what actions to take to reduce risks and increase benefits.
Aven (2013b) builds on the uncertainty taxonomy presented by Walker et al. (2010) and presents an alternative uncertainty classification taxonomy where the strength of knowledge is linked with the possible occurrence of black swan events. He distinguishes between three levels of uncertainties: low moderate and deep. He argues that:
low uncertainties are associated with strong knowledge and no black swans;
moderate uncertainties are associated with some dominating explanations and beliefs and the possibility that a black swan may occur;
deep uncertainties are associated with poor knowledge and no black swans: it is argued that it is not meaningful to refer to black swans when the knowledge is poor.
Aven (2013a) argues that when dealing with uncertainty related to risk assessment, the strength of knowledge concept reflects more precisely the right ideas than the uncertainty concept itself. He proposes two methods for grading the strength of knowledge. The first one, based on Flage & Aven (2009), uses a weak-medium-strong scale for SoK. The knowledge is considered weak if one or more of these conditions are true:
a) The assumptions made represent strong simplifications b) Data are not available or are unreliable
c) There is lack of agreement/consensus among experts
d) The phenomena involved are not well understood; models are nonexistent or known/believed to give poor predictions.
If all of the following conditions are met, the knowledge is considered strong: The assumptions made are seen as very reasonable
Much reliable data are available
There is broad agreement/consensus among experts
The phenomena involved are well understood; the models used are known to give predictions with the required accuracy.
Cases in between are classified as having medium strength of knowledge.
The second method for assessing the strength of knowledge in Aven (2013a) starts by the identification of all the main assumptions behind the risk assessment. These assumptions are converted to a set of