THÈSE
En vue de l’obtention du
DOCTORAT DE L’UNIVERSITÉ DE TOULOUSE
Délivré par l'Université Toulouse 3 - Paul Sabatier
Présentée et soutenue par
Isabel CANTERA
Le 20 décembre 2019
Effet de l'anthropisation sur les communautés des poissons dans
les cours d'eau Guyanais. Approche par ADN environnemental.
Ecole doctorale : SEVAB - Sciences Ecologiques, Vétérinaires, Agronomiques et
Bioingenieries
Spécialité : Ecologie, biodiversité et évolution Unité de recherche :
EDB - Evolution et Diversité Biologique
Thèse dirigée par
Sébastien BROSSE
Jury
Mme Teresa FERREIRA, Rapporteure M. Emili GARCíA-BERTHOU, Rapporteur
M. Régis CEREGHINO, Examinateur M. Sébastien VILLéGER, Examinateur M. Sébastien BROSSE, Directeur de thèse
2
Remerciements
Je commence par remercier mon directeur de thèse. Merci Seb de m’avoir permis de faire cette thèse, de m'avoir donné l’opportunité de voir l’Amazonie, de remonter ses beaux cours d’eau avec ses paysages de folie et de voir un jaguar (même si tu es jaloux). J’ai eu une expérience inoubliable sur le plan professionnel et personnel lors de mes missions de terrain. Je te remercie pour ça. Mais surtout merci pour ton encadrement et ta confiance. C’était un vrai plaisir de travailler avec toi et ta bonne humeur, toujours disponible, positif, calme et compréhensible. J’ai eu beaucoup de chance de t’avoir comme encadrant!
Bien sûr je tiens à remercier Kévin. Merci pour la préparation en béton que tu m’as faite pour mon oral, toutes ces discussions sur les patrons beta/alpha, les répètes et les questions vicieuses. Merci pour toute ton aide et ton accueil après aussi, la vie au quotidien est tellement plus facile avec toi, avec les chocolats et les discussions éternelles sur le sens des mots!
Merci aux rapporteurs d’avoir accepté d’évaluer ce manuscrit. Obrigada a Teresa Ferreira y Gracias a Emili Garcia-Bertou. Merci également aux examinateurs Régis Cerighino et Sébastien Villéger. Je remercie le Labex CEBA, la DEAL et l’OEG d’avoir financé cette thèse. Merci particulièrement à Stéphanie Rey et Mathieu Rhone.
Axel, mon acolyte de terrain, à toi aussi je te dois un grand merci pour m’avoir sauvé la vie plusieurs fois sur le terrain, pour m’avoir accueillie chez toi et pour m'avoir montré la vie guyanaise. D’ailleurs, en parlant du terrain, je dois remercier plusieurs personnes qui m’ont aidée et conseillée pour mon échantillonnage. Merci à Jérôme Murienne, Philippe Gaucher, Loïc Tudesque, Alain Coppel et le PAG. Je remercie aussi Régis Vigouroux et l’équipe d’HYDRECO : Sébastien, Damien, Christophe de m’avoir supportée sur le terrain pendant deux mois et merci à Roland, le Saramaka-Marsellais le plus sympa du monde qui m’a toujours aidée à trouver le meilleur spot pour poser mon hamac. Gracias Amaia por toda tu ayuda! En el labo, en el campo y en el día a día. Gracias Pablo por tu buena onda y tu amabilidad, por los alfajores !!, por haberme conseguido un 4X4 y haberme acompañado al campo.
Merci à Alice Valentini, pour sa disponibilité et pour ses conseils concernant les données metabarcoding. Un grand merci à Céline ! pour le temps que tu as passé sur les données SIG et tes belles cartes qui sont dans ce manuscrit. Merci à Thierry pour tes conseils, rien de plus sympa que d’avoir ta petite visite, évidement quand tu te daignais venir travailler.
3
Un grand merci à Dominique, tu mérites le ciel et plus! Merci pour ta patience, ton amabilité et de rendre la vie des doctorants significativement plus facile! Vincent, combien de fois je t’ai embêté que ce soit en mode panique parce que la visio ne marchait pas, 2h avant mon comité de thèse ou juste pour débattre sur quand on considère que quelqu’un est geek. Merci d'avoir toujours répondu avec ta bonne humeur. Merci aussi à Pierre Solbes qui m’a toujours aidée avec sympathie. Merci Gaël de m’avoir permis d’avoir une petite expérience dans l’enseignement. Je remercie Linda, Catherine et Leslie qui m’ont beaucoup aidée au début de ma thèse, surtout pour mon terrain et merci Catherine d’avoir pris le temps de m’aider à choisir la meilleure voiture pour mon terrain ! Merci aussi à Claudine et à Florence qui sont arrivées après. Merci Flo pour ta bonne énergie et tes bisous.
Un grand merci à tous les collègues d’EDB, qui ont rendu le quotidien au labo plus doux et agréable. Jess, je ne trouverai jamais les mots pour te remercier pour tout !! que ce soit pour la thèse, les cours ou pour la vie. Merci pour les croissants en fin de thèse, pour m’écouter divaguer, pour tes relectures, de partager l’amour pour la Bretagne avec moi et pour les brunchs. Mais surtout pour ton soutien et amitié sans faille, ton amabilité et ta serviabilité. ¡Juan, que suerte que hayas caído en mi bureau! Gracias por tu rayito de sol diario, tus consejos de vida siempre tan acertados y sobre todo por tu risa que siempre me sacaba otra. A mes « collègues de promo » : Luana, Maëva, Max, Fabian et Eglantine. Merci ! pour le super weekend d’inté qu’on a organisé, les soirées jeux, pour ces > 3 ans ensembles à se marrer ou se plaindre à l’Upsi, merci bien sûr au risotto aux asperges, au poisson patate, aux arancini et au camembert rôti de nous avoir boosté le moral les midis. Les filles! avec lesquelles je partage mon chemin depuis un moment, merci pour les fous rires et les moments gênants et vous savez quoi ? Nous sommes arrivées! Merci Luana, ma co-bureau, pour ta sérénité, pour ta douceur, pour écouter mes folies et surtout de supporter, avec ton élégance caractéristique, mon bruit et mon bordel. Merci Maëva, je remercie la forêt des brumes, les toucans et les burgers de nous avoir rapprochées, merci pour tes folies et tes « fun facts », on ne s’ennuie jamais avec toi. Merci Fabian pour ton soutien quand il le fallait, tes sages conseils et d'avoir essayé de me faire aimer les jeux de mots : « c’est gentil d’avoir essayé mais ce n’est pas drôle ». Merci aussi à Maxouuu pour tes idées cadeaux, ton humour piquant et de m’avoir fait découvrir Codenames. Merci Eglantine pour tes conseils en stat, ta bienveillance et surtout de m’avoir appris ce qu'est un percolateur. Nico, merci pour toutes les sorties que tu as très bien organisées :) Merci pour ta bienveillance et ton positivisme. Julian merci pour ta bonne énergie (même si tu m’as traitée d’abrutie), ta sincérité et de mettre Nico à sa place :). Un merci spécial a Séb Cally, pour les
4
fous rires, ta tendresse, tes câlins et surtout de m’avoir déménagée plusieurs fois, vraiment merci ! Merci Féloucho pour tous les rires, tu as une très belle énergie, merci de m’avoir fait connaître la Creuse. Merci Marine de nous avoir très bien accueilli depuis le master, pour tes folies et maladresses qui nous ont bien fait marrer. Merci à mes premiers collègues de bureau Paul et Lucie de m’avoir très bien accueillie. Merci Paul de m'avoir montré les vertus du Thym et comment changer ma chambre à air et merci Lucie pour ta bonne humeur et les dépannages avec le code. Merci Jade d’être sur tous les fronts et pour tes conseils avisés. Un merci à E-ping d’avoir supporté toutes mes visites dans son bureau pour parler à Jess. Merci Iris pour le séjour à Rennes qui m’a bien permis de te connaître. Merci à Guillaume qui m’a encadrée lors de mes premiers pas dans le monde de la recherche, merci pour tes chocolats de Madagascar et de toujours « encourager » les thésards.
Merci à ma famille toulousaine qui m’a beaucoup soutenue et rendu la vie plus facile. Merci Gwen de me supporter, de me relire et corriger depuis la licence !! Merci Baptiste pour les 9 années d’amitié toulousaine, pour tes repas et tes encouragements! Gracias a mi hermana de la vida, Shula por ser mi apoyo desde que llegué a Francia, por empujarme cuando hacía falta, por tu sabiduría y por acordarme que un “exposé” dura lo que dura esperar el tram cuando lo perdiste. Gracias Cathe, quien me acompaña desde lejos y desde cerca hace ya 16 años. A vos tampoco tengo palabras para agradecerte todo el apoyo que me diste. Gracias por tu cocina, por esas largas charlas sobre la vida, por nuestros desafíos, por levantarme hasta cuando botar un huevo me resultaba imposible y por acompañarme en esta aventura.
Gracias a mi familia por apoyarme y acompañarme siempre. Gracias a Mema y Gangui por sus relecturas y por ser los mejores hermanos del mundo. Gracias también a Eli por sus correcciones. Gracias Mema por tu cariño sin límites y por haberme dado el regalo más lindo de la vida. Gracias Gangui por tus chistes y tus consejos pragmáticos. Gracias papá por haberme transmitido la pasión por la biodiversidad y que puedo hacer todo lo que me proponga. Y ¡Gracias mamá por TODO!
5
Table of contents
Chapter 1: General introduction ... 8
I) Biodiversity: a multifaceted entity threatened by human activities ... 8
II) Tropical ecosystems: highly diverse and strongly vulnerable ... 11
III) Values and threats of Amazon freshwater ecosystems ... 12
IV) Measuring human impacts on Amazonian fish communities: an overview... 13
V) How are species assembled into communities? ... 14
VI) Assessing human impacts in a directionally connected network ... 16
VII) The study area: French Guiana ... 18
1) Description of the territory ... 18
2) Sampling issues ... 20
VIII) Objectives ... 23
1) Optimization of the eDNA method for sampling species-rich communities t ... 23
2) Spatial extent and strength of anthropogenic impacts on fish biodiversity in rivers ... 23
3) How anthropogenic impacts modify diversity patterns and ecological processes? ... 24
4) How anthropogenic impacts modify the functional structure of fish communities? ... 24
IX) Data description ... 25
1) Sampling sites... 25
2) Biodiversity measures ... 26
Chapter 2: Optimization of the eDNA method for sampling species-rich communities ... 28
Abstract ... 29
Introduction ... 30
Materials and methods... 32
Results ... 36
Discussion ... 42
Acknowledgements ... 47
Authors’ contributions ... 47
Chapter 3: Spatial extent and strength of anthropogenic impacts on fish biodiversity in rivers 48 Abstract ... 49
Introduction ... 50
Materials and methods... 52
Results ... 54
Discussion ... 58
6
Chapter 4: How anthropogenic impacts modify diversity patterns and ecological processes? .... 62
Abstract ... 63
Introduction ... 64
Materials and Methods ... 68
Results ... 70
Discussion ... 73
Chapter 5: How anthropogenic impacts modify on functional structure? ... 78
Abstract ... 79
Introduction ... 80
Materials and methods... 83
Results ... 85
Discussion ... 88
General discussion ... 92
I) Environmental DNA, a tool to assess human impacts on Amazonian aquatic biodiversity ... 95
II) Anthropogenic impacts on fish communities in Amazonian streams and rivers ... 96
III) Conclusion ... 99
III) Perspectives ... 100
1) Methodological perspectives ... 100
2) Theoretical perspectives ... 101
3) Towards the development of a fish-based index of biotic integrity using eDNA ... 102
4) Integrating social dimensions on the assessment of human impacts on rivers ... 103
Epilogue : Les peuples et les rivières, une autre facette de diversité ... 104
References ... 107
Appendix ... 119
NB. Credits are only applied to images that do not belong to the author. All the cutout images of fish belong to Sébastien Brosse.
8
Chapter 1: General introduction
I) Biodiversity: a multifaceted entity threatened by human activities
Biodiversity changes as a consequence of human activities, has been a key focus of political, economic, and scientific debates in the last decades. However, how are human activities inducing biodiversity changes and why is it critical for human societies?
Over the last centuries, human impact has deeply transformed the form and function of all ecosystems on earth. Before the Industrial Revolution, 50 % of the terrestrial biosphere was without human settlements or substantial land use and by the year 2000 only 25% remained wild (Ellis et al. 2010). This anthropogenic transition resulted from the widespread and growing presence of human populations and their economic development. Land transformation, mainly for agricultural intensification and infrastructure development, combined with the introduction of non-native species and the overexploitation of natural resources such as minerals, wood, water and animals are confronting ecosystems with unprecedented levels of disturbance (Dirzo and Raven 2003). Moreover, these activities are driving other environmental changes such as habitat loss, pollution, climate change and the alteration of biogeochemical cycles (Vitousek et al. 1997; Rockström et al. 2009). All of the impacts mentioned above are interacting and affecting directly (e.g. hunting and fishing) and indirectly (e.g. land use) the Earth’s biodiversity.
Biodiversity is the variety of life and it can be described from local to global scales, and across different levels of organization, from the variation among genes to the diversity between species and their traits. Change is a natural feature of species and is the baseline of Evolution Theory as species emerge, adapt and/or become extinct without human actions. Naturally, extinction events are balanced by speciation events, but this balance has been disrupted. In fact, human alterations are accelerating the current rates of extinction as they are higher than expected from fossil records (Barnosky et al. 2011). In addition, Pimm et al. (1995), estimated that current extinction rates were 100 to 1000 times higher than pre-human rates. The global number of species is not the only diversity component that is altered by human impacts. Between 1970 and 2014, the population size of overall world’s species declined by 60% (Living planet report 2018), with the Neotropics and freshwater ecosystems suffering the most dramatic
9
declines of population sizes (89% and 83% respectively), showing that the species from those ecosystems are highly threatened.
Globally, the number of species and their population sizes are declining and those estimates are the result of changes in biodiversity from local to regional scales. Locally, at the community level, species are responding to anthropogenic impacts by disappearing or shifting and/or adapting their distribution range, as well as changing their behavior and phenology. Newbold et al. (2015), using a global multi-taxa assessment, quantified that land use reduced, on average, 14 % of the species richness of local terrestrial communities. However, it has been illustrated that local communities facing human impacts do not always exhibit decreases of species richness but mostly changes on species composition (Sax and Gaines 2003; Thomas 2013). It is important to note that under severe disturbance levels, species richness always decreased. The alteration of the environment might result on local extirpations of sensitive species, but tolerant species can resist (McKinney and Lockwood 1999). Moreover, tolerant widespread species may colonize the disturbed community and benefit from the new environment thereby adding species to the community. Consequently, this species exchange among communities will lead to a homogenization of the species composition of communities and thus increase the similarity among communities within a region. For instance, marine fish communities under climate change showed important changes on species composition through time, with species from warmer southern localities colonizing northern localities, without systematic changes in species richness (Dornelas 2015). Similarly, land use led to taxonomic homogenization in communities of terrestrial plants, vertebrates and invertebrates (Newbold et al. 2018).
Taxonomic homogenization due to human impact will often be mediated by a transition from communities dominated by specialist species to a dominance of tolerant and widespread generalist species (McKinney and Lockwood 1999). The replacement of specialist species with unique functional traits by generalists more adapted to disturbed environments may eventually lead to a functional homogenization of communities (Clavel et al. 2011). Indeed, functional homogenization of bird communities under urbanization (Devictor et al. 2007b), land use and landscape fragmentation (Devictor et al. 2007a) has been recorded. General patterns of traits that replace specialist traits are omnivory, rapid growth and dispersal, as well as breeding in ephemeral habitats (McKinney and Lockwood 1999). Nevertheless, functional homogenization without associated taxonomic homogenization was found for North Sea fish communities after three decades of warming (McLean et al. 2019b). While diverging in species composition,
10
Southern and Northern North Sea communities converged towards similar traits such as small pelagic fishes with fast life history strategies.
Human activities are altering biodiversity across different geographical scales. From a local reorganization of species, through regional homogenization of taxonomic and functional diversity, to the global erosion of species. Importantly, ecosystem functions and services depend on local species and the traits they exhibit (Cardinale et al. 2012). Specifically, the loss of a species in an ecosystem can also lead to habitat loss, as well as the alteration of biogeochemical cycles and ecosystem productivity. Experimental studies illustrated that ecosystem functions, such as biomass production and nutrient cycling, were strongly influenced by changes in local diversity (Naeem et al. 1994; Tilman et al. 1996). Moreover, high local diversity was reported to increase ecosystem function, resistance and stability to environmental changes (Tilman et al. 2006). Accordingly, during drastic climate events, the productivity of low-diversity plant communities decreased by 50%, whereas that of high-diversity communities decreased by 25% (Isbell et al. 2015). The disruption of ecosystem functions results from the limited range of species-specific responses available after human impacts. This may be a consequence of the loss of specialist species or to the synchronized biological responses due to the biotic homogenization of communities. Furthermore, functional simplification may have a great impact on ecosystems processes given the strong links between organismal traits and ecosystem functioning (Cardinale et al. 2012). For example, experimental evidence pointed that functional composition and functional diversity were the main factors explaining ecosystem processes such as plant productivity, nutrient cycling, and light penetration (Tilman 1997).
Besides the ethical and aesthetical value of species, local diversity is essential to maintain the functioning of ecosystems and their benefits to societies. Biodiversity changes at local scales are more complicated to understand because they depend on the level and type of disturbance, the ecosystem and the studied taxa (Sax and Gaines 2003). Consequently, it is necessary to develop efficient sampling methods and frameworks to assess the effects of anthropization on local biodiversity in different regions around the world.
11 II) Tropical ecosystems: highly diverse and strongly vulnerable
The type and intensity of human activities widely differ across ecosystems and regions. At global scale, land transformation has been highlighted as the hardest driver of changes in biodiversity, mainly by local extinction of associated species (Sala 2000). This impact is particularly accentuated in tropical rainforests, which are among the most threatened ecosystems on the world (Sala 2000; Morris 2010). In fact, agro-industrial and logging activities are removing thousands of hectares of tropical forest every year (Hansen et al. 2010).
Diversity patterns also differ across regions and ecosystems. This fact should be accounted to deeply understand the impact of human activities on biodiversity because the vulnerability of species may differ among ecosystems. Tropical regions host huge amounts of diversity (Barlow et al. 2018) with high species turnover between localities (Kraft et al. 2011). For instance, higher species richness were found in these ecosystems comparing with temperate ecosystems for freshwater fishes (Toussaint et al. 2016), mammals (Safi et al. 2011) and birds (Jetz and Rahbek 2002). Many hypotheses have been proposed to explain this high diversity: higher diversification rates (Rolland et al. 2014), higher available energy, diversity of habitats and/or decreased abiotic harshness (Cilleros et al. 2016). In view of its high diversity, tropical ecosystems are expected to be particularly resilient to human disturbances, as species loss may be compensated by the remaining species that perform similar functions. Indeed, the strength of human impacts on biological communities will depend on the levels of functional redundancy, which reflects how traits are ensured in terms of number of species and individuals (Naeem and Li 1997). While taxonomic diversity will count species, functional diversity will count functions, and species with the same functions will increase the functional redundancy in the community. This will increase the resilience of ecosystem processes under human disturbances, as the loss of some species will be compensated by the remaining functionally similar species. Accordingly, marine fish communities exhibiting high redundancy levels were less sensitive to global warming in the Seychelles islands (McLean et al. 2019a).
Functional diversity was also found to be concentrated in tropical ecosystems for freshwater fishes and mammals (Safi et al. 2011; Toussaint et al. 2016). Additionally, this rich functional diversity exhibited high levels of functional redundancy in mammals and freshwater fishes from the Afrotropical region. In contrast, low levels of redundancy were found for freshwater fishes in the Neotropical region. Specifically, the high functional diversity found in the Neotropical region was suggested to be due to a few orders with high levels of functional
12
uniqueness. Moreover, D’agata et al. (2016) found that in tropical coral reef fish communities, only 40% of trait combinations were redundant among species, leaving the other 60% highly vulnerable to fishing pressures. This trend to disproportionately pack into a few trait combinations was also found in a global study of the functional diversity of coral reef fish (Mouillot et al. 2014). Similarly, Leitão et al. (2016) illustrated that rare species had unique attributes and contribute disproportionately to the functional diversity of Australian birds and Amazonian fishes and plants. Tropical ecosystems have a high proportion of rare species, which are sensitive to local extinction induced by human impacts due to their low representativeness, narrow geographical size and habitat breadth (Leitão et al. 2016). Therefore, the low functional redundancy and the important contribution of sensitive rare species to trait diversity highlight the vulnerability of the functions supported by communities inhabiting tropical ecosystems.
III) Values and threats of Amazon freshwater ecosystems
Among all tropical ecosystems, the Amazon forest hosts the highest levels of local diversity (Hubbell et al. 2008; Peres et al. 2010) and the most extensive tropical forest on the planet. For instance, this region hosts the most diverse freshwater fish fauna on earth, corresponding roughly to 20% of global fish species diversity (Lévêque et al. 2008). Additionally, this ecosystem provides significant goods and services for their inhabitants but also around the world, such as wood, timber and agricultural products. Importantly, many local populations still rely on Amazonian rivers and streams to transport use, water use and food acquisition. In spite, of its high value, little attention has been addressed to the management of freshwater ecosystems comparing to terrestrial ecosystems in the Amazonian region (Castello et al. 2013; Castello and Macedo 2016). Indeed, developing countries share the Amazonian forest, where the economic growth is favored over biodiversity conservation, which results in limited conservation policies, monitoring and data for empiric studies.
Besides facing the same threats than other freshwater ecosystems, such as deforestation and pollution due to human settlement, damming, overharvesting, as well as intensified agriculture and livestock (Vörösmarty et al. 2010; Carpenter et al. 2011), Amazonian streams and rivers are highly threatened by unprecedented levels of mining, logging, oil and gas extraction. Those activities are polluting freshwater systems and altering their hydrology and physico-chemical conditions (Castello et al. 2013). Furthermore, those activities expanded from artisanal exploitation, to domestic and international markets. This results in an intensification of resource
13
exploitation and an increase of infrastructure constructions, which ultimately leads to large-scale degradation and disruption of the hydrological connectivity of Amazon freshwater ecosystems (Castello and Macedo 2016). Thus, assessing the integrity of freshwater systems becomes highly urgent due to the vulnerability of tropical biodiversity mentioned in section II. In particular, the Amazonian diversity was structured in a stable environment in terms of climate and landscape changes (Peres et al. 2010). Considering that historical stability promotes diversification rates (Ricklefs 2006) and thus higher levels of functional specialization and originality (Rodrigues-Filho et al. 2018), Amazonian biodiversity may be specially sensitive to the variation of environmental conditions induced by the current growing human perturbations.
IV) Measuring human impacts on Amazonian fish communities: an overview
Most of the studies assessing the impacts of mining and land use on Amazonian freshwater ecosystems concluded that they alter stream physical habitat and water chemistry (Mol and Ouboter 2004; Dias et al. 2010; Prudente et al. 2017). Contrastingly, the consequences on fish diversity are more contrasted. The commonly used diversity descriptors, the number of species and their abundance, were found not sensitive to human pressures or lacked of consistency. While Mol & Ouboter (2004) found an erosion of fish species richness due to small scale gold-mining, the majority of studies failed to detect changes on this variable (Bojsen and Barriga 2002; Brosse et al. 2011; Allard et al. 2016; Prudente et al. 2017). Surprisingly, Bojsen & Barriga (2002) found that total fish density increased with deforestation. Nonetheless, all the above-cited studies, found that species composition consistently changed under disturbance.
More recently, studies focused on the functional aspects of communities and this diversity facet appeared to be more sensitive to the effects of human activities. Indeed, low forest cover was found to induce trends towards functional homogenization in Brazilian streams (Bordignon et al. 2015; Arantes et al. 2018; Leitão et al. 2018), with functionally specialized species sensitive to forest loss. However, the identity of the shifts displayed some discrepancies among studies. Community shifts towards a dominance of periphyton-feeders under deforestation were observed in Ecuadorian (Bojsen and Barriga 2002) and Brazilian streams (Leitão et al. 2018). In opposition, in logged streams and rivers in French Guiana, phytophagous fish were unrepresented (Allard et al. 2016). Finally, planktivorous species were favored in areas with low forest cover in the Amazon river floodplain (Arantes et al. 2018).
14
The effects of anthropogenic activities on Amazonian freshwater ecosystems depend on the type and intensity of activities (Allard et al. 2016; Brejão et al. 2018). Even though the majority of studies failed to report a decrease in species richness, low levels of deforestation (<20% of deforested watershed) caused abrupt responses of Amazonian fishes (Brejão et al. 2018). Therefore, fish communities inhabiting Amazonian streams appear to be vulnerable to human activities. Species composition and functional diversity consistently responded to disturbances suggesting that the severity of human impacts should be assessed in a community ecology approach, evaluating both diversity patterns and processes (see below). Furthermore, all but one of the mentioned studies were performed in upstream streams, where the fauna and environment differ considerable from those in downstream rivers (Allard et al. 2016; Cilleros et al. 2017). Additionally, human impacts affect the two ecosystems differently: upstream streams are directly impacted whereas rivers are directly impacted but also may receive cumulative effects from upstream disturbances (Lindberg et al. 2011; McCluney et al. 2014). Thus, the effects of human activities on riverine communities need to be studied to have a more complete picture of the severity of biodiversity degradation in the Amazonian region.
V) How are species assembled into communities?
To assess the severity of human impact on local communities, it is important to define how species are assembled into communities. The answer roots on several ecological theories, encompassing different mechanisms and processes acting at different spatial and temporal scales. Local communities are the result of a hierarchical filter in which species are progressively filtered from a regional pool. The regional pool represents the global diversity of a region and is constrained by historical and evolutionary events (Chase 2003). For instance, the Neotropical region is characterized by a high species richness, which has been explained by the complex history of this region and the high diversification rates (Rolland et al. 2014). From the regional pool, species will be filtered by assembly rules (Gleason 1926; Keddy 1992) and/or neutral processes (Connor and Simberloff 1979). Assembly rules are deterministic processes constraining the co-occurrences of species in local communities, whereas neutral processes refer to stochastic events independent to the species traits or abiotic interactions (Hubbel 2001). These processes may act simultaneously and their relative importance depends on the considered spatial scale (Weiher and Keddy 1999; Webb et al. 2002). At large scales, the size of the local and regional species pools, as well as random colonization events and differences
15
in species dispersal abilities will determine the species capacity to arrive to a community (Hubbel 2001; Fraaije et al. 2015). At local scales, two main processes, based on the niche concept (Hutchinson 1957), will structure communities. First, local environmental conditions act as filters and select species able to persist in a given community according to their traits. This process is called environmental filtering (Keddy 1992). Then, limiting similarity will also shape local communities (Macarthur and Levins 1967), this process represents the competitive exclusion from a suitable environment by species having similar ecological strategies.
The ecological processes structuring local communities shape diversity patterns and the comparison between diversity facets across different spatial scales allow to disentangle their relative importance (Keddy 1992; Götzenberger et al. 2012). Lower functional dissimilarity compared to taxonomic dissimilarity among communities within a region may suggest that environmental conditions select particular species traits and strongly structures community assembly. For instance, this pattern was found for temperate fish communities in France, suggesting that they are mainly structured by environmental filtering (Cilleros et al. 2016). Contrastingly, fish communities inhabiting tropical streams in French Guiana exhibited higher functional dissimilarity among communities than taxonomic dissimilarity, suggesting that they are mainly structured by dispersal limitation (Cilleros et al. 2016). Furthermore, at local scale, communities mainly ruled by limiting similarity should harbour species with different ecological strategies than expected randomly (Weiher and Keddy 1999). In contrast, under predominant environmental filtering, communities are expected to have mostly similar species sharing traits that allow them to tolerate specific abiotic conditions.
As explained before, human activities are reorganizing local diversity patterns mediated by biotic homogenization and species loss. Moreover, considerable losses of functional diversity were recorded for coral reef fish communities due to increasing human population density (D’agata et al. 2014) and for amphibians, birds and mammals under land use (Ernst et al. 2006; Flynn et al. 2009). Thus, ecological processes shaping communities may be also influenced by anthropization. Accordingly, functional diversity was found to decrease faster than taxonomic diversity under global change (Kuczynski and Grenouillet 2018) and land use (Gutiérrez-Cánovas et al. 2015) in temperate freshwater ecosystems. This suggests that disturbed communities are mainly structured by environmental filtering, excluding functions not adapted to those altered environments (See Figure 1A for an illustration). Therefore, assessing how structuring processes interact with disturbance may provide a deeper understanding of the effect of anthropogenic activities on Amazonian biodiversity.
16 Figure 1: Illustration of the diversity patterns resulting from ecological process acting at local scale. Expectations under disturbance (A) and along the upstream-downstream gradient (B).
VI) Assessing human impacts in a directionally connected network
Freshwater ecosystems are also among the most threatened ecosystems in the world (Sala 2000; Carpenter et al. 2011) and assessing the severity of human impacts on freshwater ecosystems needs to take into account their dendritic network structure. Indeed, an important feature of freshwater ecosystems is the longitudinal directional connectivity due to the movement of water
17
from the headwaters to the ocean (McCluney et al. 2014; Moore 2015). Therefore, two considerations are necessary to measure human impacts on diversity patterns and processes.
First, given the longitudinal connectivity of freshwater ecosystems, upstream disturbances can have consequences downstream. Indeed, effects of mountaintop mining have been documented for the water quality and biodiversity downstream from the mining sites (Palmer et al. 2010). Furthermore, the combined effect of multiple upstream perturbations can lead to cumulative downstream impacts (Lindberg et al. 2011) (Figure 2A). Accordingly, rivers are suggested to integrate and redistribute disturbance effects from upstream to downstream (Vörösmarty et al. 2010). Nonetheless, rivers can also promote resilience and resistance to human disturbances (Figure 2B). Specifically, river systems integrate processes across multiple spatial scales and broad distances over time resulting in temporal asynchrony and habitat heterogeneity across connected patches (McCluney et al. 2014). Individuals can move throughout the river system and recolonize new patches to avoid locally unsuitable conditions. Moreover, tributaries that are less or not impacted can vehicle undisturbed water inputs and therefore dilute disturbance effects (Vörösmarty et al. 2010). Thus, it is important to determine the spatial extent of upstream impacts to better assess the effects of human activities on freshwater communities.
Figure 2: Possible downstream ecological responses to upstream perturbations. (A) Downstream sensitivity and cumulative effects.
(B) Downstream resilience and resistance.
Second, environmental conditions and diversity patterns vary along the upstream-downstream gradient (Vannote et al. 1980; Ibanez et al. 2007). Consequently, network position may influence community assembly processes, as the relative importance of assembly processes may vary along natural environmental gradients. For instance, upstream streams are
18
strongly influenced by local environmental conditions and exhibit high environmental variability (Poff 1997), this leaves few species with particular traits able to tolerate these conditions. In opposition, environmental stability, habitat size and complexity increase downstream stability promoting high species richness in downstream large rivers. Therefore, in headwater streams, environmental filtering may be of greater importance, whereas limiting similarity may be predominant in downstream habitats (Figure 1B).
VII) The study area: French Guiana
1) Description of the territory
French Guiana is located in the Northern East of the Amazonian region (sensu lato, including the Guiana shield and the Amazon river drainage, see Figure 3). Almost the entire territory (c.a. 96%) is covered by a dense primary Amazonian rainforest, representing the largest area of un-fragmented rainforest in the world (c.a. 80 000 km²). This territory is part of a unique geological unit, the Guiana Shield (Figure 3). The forests of the Guiana Shield cover around 30% of the Amazonian forest (c.a. 1.6 million km2).
A dense river network composed of seven large river basins covers French Guiana. Small streams (water depth <1 m; stream width <10 m) represent 70% of all running waters in the territory and have been found to display environmental conditions and diversity patterns contrasted with large rivers (Dedieu et al. 2015; Allard et al. 2016; Cilleros et al. 2017). This river network shelter typical Amazonian freshwater fauna with more than 400 described fish species that exhibit a high diversity of forms (See Figure 1 for some illustrations). In addition, the rivers basins share 50% of the species and the other half is represented by species endemic to the different basins (Le Bail et al. 2012). These distribution patterns result from a mixture of different species pools arising from the complex biogeographical history of the Neotropical region (Cilleros et al. 2016) and Guineans basins. In fact, most of the Amazonian basins dried up during the last Quaternary glaciation with the exception of the Maroni and the Eastern Amazon, which acted as fish refugees. Thus, post-glacial recolonization resulted from those river basins (de Mérona et al. 2012).
19 Figure 3: Map of the study area indicating the main human impacts threatening freshwater biodiversity in French Guiana. Deforestation and Gold-mined surfaces were extracted from landsat images (Hansen et al. 2010; WWF 2016; Rham et al. 2017). Inhabited places were obtained from Geonames website. The inset map on the right indicates the location of the study area in South America. The Guiana Shield is delimitated with dashed green lines.
Despite representing the largest area of un-fragmented rainforest in the world, French Guiana is facing an unprecedented rise of human threats (Figure 3) due to deforestation for agriculture, gold-mining and urbanization, like the rest of the Guiana shield (Rham et al. 2017).
20
In the last decades, gold-mining activities have increased with the rise in the gold price (Hammond et al. 2007). Even though deforestation induced by gold-mining still represents a low proportion compared to other regions (Rham et al. 2017), its rapid expansion is alarming. Deforestation induced by mining activities increased from more than 40 km2 of forest in 2001, to nearly 115 km2 in 2006 (Hammond et al. 2007). For instance, in the sampling sites used for this work (see below), the percentage of deforested surfaces upstream of the sites for gold-mining increased considerably (Figure 4) between 2000 and 2015. Mining activities are developed through legal enterprises or illegal small-scale mining. Besides the impact of deforestation for roads or infrastructure on the surrounding vegetation, this activity has a detrimental effect on the benthic habitat and turbidity levels (Mol and Ouboter 2004; Dedieu et al. 2014). These consequences deeply affect community structure even after the cessation of the mining activity (Brosse et al. 2011; Tudesque et al. 2012). Furthermore, the mercury used to amalgamate the gold is accumulated downstream and bio-amplifies through trophic transfer (Hammond et al. 2007).
Figure 4: Comparison of the percentage of surfaces deforested for gold-mining between 2000 and 2015 across French Guiana. The percentage of deforested surfaces was calculated within the sub-basin area upstream of our sampling sites (see Figure 6).
2) Sampling issues
Unfortunately, there is a technical issue in French Guiana for sampling freshwater fish communities. Traditional sampling methods are destructive (Hubert et al. 2012) or inefficient and vary between streams and rivers (Allard et al. 2014; Cilleros et al. 2018). Small streams have been usually sampled using rotenone or electrofishing. However, rotenone is banned in
21
the territory because it is destructive and the low conductivity of the Guianense water makes electro-fishing inefficient. For rivers, the current fish sampling method is gillnet sampling. This method corresponds to passive captures based on the movement of fishes and is thus species selective (Murphy and Willis 1996; Cilleros et al. 2018). In fact, the probability of catching fishes with this method will vary depending on species morphology (small species are not caught and species with high bodies and prickly teeth or fins have a higher probability of catching than elongated species) and behavior (gregarious and mobile species have a higher probability of capture than solitary and less mobile species). Moreover, gill nets are also habitat selective since they can be only installed in deep and stagnant waters. Finally, both types of sampling methods collect fishes in a limited range of habitats, giving partial inventories of the fauna (Cilleros et al. 2018).
The environmental DNA (eDNA) metabarcoding approach has been claimed as a promising tool for measuring biodiversity (Taberlet et al. 2012). In aquatic systems, the method involves capturing DNA molecules that flow in the water. The obtained DNA is extracted, amplified, sequenced and assigned to species by comparing the DNA sequences to a reference molecular database (see Figure 5). Ultimately, species inventories can be built according to the detected species.
Figure 5: Illustration of the main steps of the eDNA procedure. Water is filtrated to collect the DNA released by organisms. The DNA is extracted, amplified using taxa specific primers and sequenced. The obtained reads are filtered using bio-informatic analyses and assigned to species present in a reference database according to a similarity threshold.
22
In spite of a wide use in temperate rivers and streams (Civade et al. 2016; Valentini et al. 2016; Pont et al. 2018), the method is still under development in other ecosystems, such as tropical ecosystems. In Guianese streams and rivers, the method has proved to be efficient (Cilleros et al. 2018; Jerde et al. 2019). Preliminary tests in French Guiana were performed, in which 39 freshwater fish communities were sampled using the protocol designed by Valentini et al. (2016) for temperate rivers. These tests showed that one water sample permitted to detect a substantial part of the fauna without erroneous detections (i.e. species not expected to occur in the detected sites according to their known habitat preferences and watershed occurrence). However, this standard protocol did not permit to detect the whole fish fauna of the studied sites (Cilleros et al. 2018) compared to traditional methods. We hence hypothesized that increasing the sampling effort will enhance detection rates. Indeed, some aspects of the method remain poorly evaluated even in temperate ecosystems. The growing interest in this method resulted in the development of a plethora protocols for each step of the eDNA procedure and the protocol choice may influence the detection of aquatic species (Goldberg et al. 2016). Despite an extended literature on optimizing the analyses of eDNA samples to improve detection performance (marker choice, extraction, sequencing and bioinformatics protocols), the sampling effort (i.e. the volume of sampled water) has benefitted from much less attention. This results in a high variability in sampling efforts across studies (ranging from few centiliters to tens of liters), making comparisons between studies difficult and raising uncertainties about the completeness of such inventories. Thus, this method needs to be optimized to be used for the assessment of human impact on tropical rivers and streams.
23 VIII) Objectives
The main objective of this work is to better understand how deeply anthropogenic disturbances are affecting fish communities in Amazonian streams and rivers. A community ecology approach is proposed to define how anthropogenic activities are affecting taxonomic and funcional diversity patterns, as well as ecological processes, in which the longitudinal connectivity of freshwater ecosystems is considered. This work was performed using a non-invasive sampling method that allows to equally sampling streams and rivers across French Guiana.
This work is divided in 4 parts:
1) Optimization of the eDNA method for sampling species-rich communities in tropical rivers
The aim of this part is to determine the sampling effort (filtered water volume) needed to get optimal inventories of fish assemblages in species-rich tropical streams and rivers using eDNA. Ten eDNA replicates were collected in six sites (Figure 6) following the protocol developed by Valentini et al. (2016) for temperate rivers. Each replicate was collected by filtering water for 30 minutes, corresponding to 34 liters of filtered water. Specifically, we sought to define the optimal sampling effort to describe communities through three diversity descriptors: species richness, dissimilarity of species composition and community structure patterns among sites. Additionally, we compared eDNA inventories with capture-based inventories collected in the same sites. The sampling, laboratory and bio-informatic protocols validated during this study achieved in 2016, were then used with the optimal sampling effort for the rest of the 81 other study sites sampled in 2017.
2) Definition of the spatial extent and strength of anthropogenic impacts on fish biodiversity in rivers
The main goal of this part was to measure the strength of anthropogenic impacts on fish taxonomic diversity and functional diversity in riverine habitats. We also investigated the optimal spatial extent to measure upstream anthropogenic effects on local fish fauna. The eDNA technique validated in Chapter 2 was used to collect data from 50 river sites (see Figure 6). The intensity of anthropogenic impacts was calculated by summing deforested surfaces due to gold-mining, agriculture and urbanization extracted from GIS data. Therefore, we used a global deforestation variable that accounts for the effects of those three types of human impacts.
24
Upstream deforestation intensity at each site was then calculated at different spatial extents by widening the spatial extent in which deforestation surfaces were calculated, from the immediate vicinity of the site (0.5 km upstream) to 150 km upstream. From this Chapter the molecular reference database developed by (Cilleros et al. 2018) was actualized. In 2016, I collected tissue from 264 fish individuals across French Guiana. This allowed to add 158 individuals and 24 species to the reference database, which includes now 255 species and 661 individuals.
3) How anthropogenic impacts modify diversity patterns and ecological processes? The aim of this part was to compare the effects of two environmental gradients, a deforestation gradient and the upstream-downstream gradient, on fish diversity patterns but also on the ecological processes shaping fish communities. We used 50 river sites and 37 stream sites (Figure 6) sampled with the eDNA protocol validated in Chapter 2. The deforestation intensity upstream from our fish sampling sites was calculated using the method developed in the Chapter 3. Ecological processes were assessed at local scale by analysing the relationships between taxonomic and functional richness. These relationships were confronted to null models simulating random species assembly, which permitted to test the hypothesis that deforestation constitutes a strong environmental filter and therefore drive assemblages toward non-random functional and ecological clustering (see Chapter 1, part V). Rivers and streams sites were considered separately given that stream and river fauna and environment significantly differ.
4) How anthropogenic impacts modify the functional structure of fish communities? In this part, the multifaceted effects of anthropogenic impacts on the functional structure of fish communities were described. Thus, we deepened the results of Chapter 4 by not only considering the effect of anthropogenic disturbances on functional richness, but also on the overall functional structure of assemblages including different facets such as functional richness, divergence, evenness and identity as proposed by Villéger et al. (2008) and Mouillot et al. (2013). As in Chapter 3, we used 50 river sites and 37 stream sites (Figure 6) sampled using the eDNA protocol validated in Chapter 2 and we analyzed separately stream and river communities. Deforestation intensity upstream from our fish sampling sites was calculated using the method developed in the Chapter 3.
25 IX) Data description
1) Sampling sites
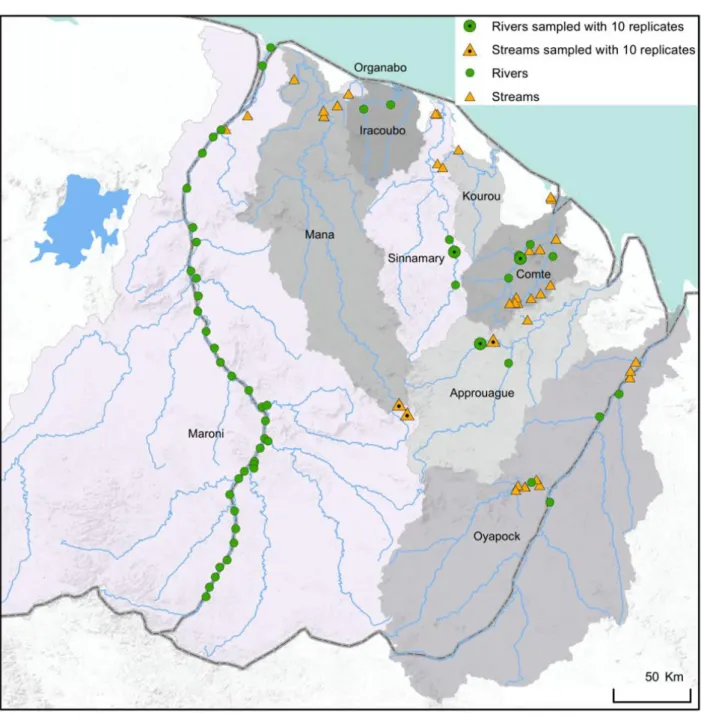
Figure 6: Map of the study area indicating the 86 fish sampling sites used for this work. Orange triangles correspond to stream (N= 37) sites and green circles correspond to river sites (N= 50) sampled with one eDNA replicate. Black dots in the center of the symbols indicated the sites used in the Chapter 2, which were sampled with 10 replicates. For the Chapter 3 only river sites were used. For the Chapters 4 and 5 all sites were used. The 9 main river basins were indicated.
For this work, 87 sites were sampled during the dry season (September-November) across nine river basins of French Guiana from 2016 to 2017 (Figure 6). We sampled 50 river sites and 37 stream sites. The stream sites were less than 10 meters wide and 1 meter depth, while river sites were wider than 30 meters and deeper than 1 meter. This distinction between streams and rivers is frequently used to distinguish these two distinct environments where the
26
fauna and environmental conditions significantly (Dedieu et al. 2015; Allard et al. 2016). Moreover, sampling sites were selected to take into account undisturbed sites but also sites subject to human disturbances such as urbanization, agriculture and gold-mining. The sampling was funded by the TULIP and CEBA Labex, the DEAL Guyane, Office de l’Eau Guyane (Aquatic Metabarcoding project), SPYGEN (for more details see Appendix). The Parc Amazonien de Guyane and Hydreco provided logistical facilities to access to some of the sites. Of the 87 sites, I contributed to the sampling of 50 sites and the remaining 37 sites were sampled during a VigiLife project along the Maroni River.
2) Biodiversity measures
For each site, the number of detected species in the eDNA samples was used to measure taxonomic diversity. To describe the functional diversity of the sampled communities, morphological and ecological traits were attributed to the detected species using information from Fishbase (www.fishbase.org), the Atlas of fish species from French Guiana (Planquette et al. 1996; Le Bail et al. 2000) and fish pictures. We used two types of traits as they are complementary to measure the functional diversity of freshwater fish (Kuczynski et al. 2018a).
Functional trait Measure
(ratio or categories) Function Type References
Maximum body length Fish base (cm)
Synthetic: metabolism, trophic impacts, locomotion nutrient cycling Morphological Toussaint et al. (52) and Blanchet et al. (36)
Body elongation Bl/Bd
Locomotion
Reecht Yves (53)
Eye vertical position Eh/Bd Winemiller (54)
Body lateral shape Hd/Bd Toussaint et al. (52)
Pectoral fin vertical
position PFi/Bd Dumay et al. (55)
Pectoral fin size PFl/Bl Fulton et al. (56)
Caudal peduncle throttling CFd/CPd Webb (57)
Relative eye size Ed/Hd
Food acquisition
Boyle & Horn (58)
Oral gape position Mo/Bd Dumay et al. (55)
Relative maxillary length Jl/Hd Toussaint et al. (52)
Relative barbell length Bbl/Bl Villéger et al. (59)
Territoriality Yes, no
Behavior
Ecological Villéger et al. (59)
Motility Mobile, sedentary
Gregariousness Gregarious, solitary Position in the water
column
Benthic,
bentho-pelagic, pelagic Habitat preference Preferred substrate Hard, soft, none
Table 1: Morphological and ecological traits and measures used to describe functional diversity for Chapter 2, 3 and 4. Their corresponding functions are indicated. See Su et al. (2019), Toussaint et al. (2016) and Villéger et al. (2010) for details on morphological measures.
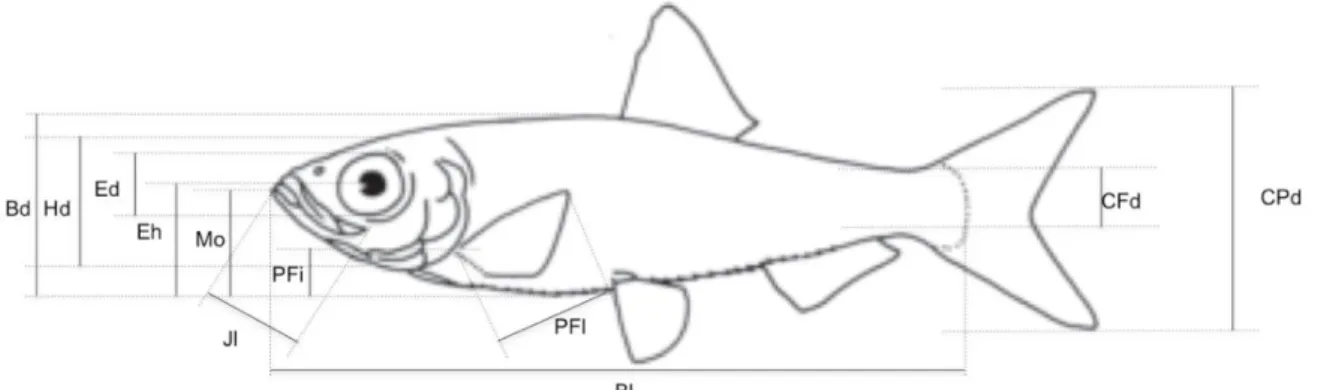
For the morphological traits, 12 measurements (Figure 7) were achieved on side view pictures gathered during the last 10 years to compute 10 unit-less ratios reflecting two key
27
functions: locomotion and food acquisition (see Table 1 for details). Locomotion is related to habitat use, vertical position in the water column, hydro-dynamism, as well as fin use for manoeuvrability, propulsion and acceleration efficiency. Food acquisition considers the functional traits related to the size of food items, feeding method in the water column, filtering ability, prey detection and trophic position. We measured morphological traits on as much individuals as possible (1 to 20, according to the species) and used the average value of all measures per species. We did not consider intraspecific variability in morphological traits, because it has been found to be negligible in a recent study conducted using the same dataset (Toussaint et al. 2018). Additionally, the maximum body length of species obtained from Fishbase (www.fishbase.org) was used to represent species maximal body size, which is considered as a synthetic functional trait (Blanchet et al. 2010). Thus, we used 11 continuous variables to characterize fish morphological diversity.
For ecological traits, I compiled a database of ecological traits using Fishbase (www.fishbase.org) and the Atlas of fish species from French Guiana (Planquette et al. 1996; Le Bail et al. 2000). The ecological database includes five qualitative traits related to trophy, behavior and habitat (see Table 1 for details) preference of 390 Guianese species.
The ecological and morphological traits were combined to build functional spaces and assess functional diversity through different facets according to the Chapter. Trait distances between all the species detected in each part of the study were calculated using Gower’s distance, which considers different types of traits (here categorical and continuous) while standardizing them and handling missing data. The distance matrix was ordered into a multidimensional space using Principal Coordinates Analysis (PCoA). Then, a global functional space was built with the five retained axes of the PCoA, which accounted for 45% of total variance. The number of dimensions was chosen as the optimal number of axes determined according to (Maire et al. 2015).
28
Chapter 2: Optimization of the eDNA method for sampling
species-rich communities
Optimizing environmental DNA sampling effort for fish inventories in tropical streams and rivers.
Scientific reports, 2019, vol. 9, no 1, p. 3085.
Cantera Isabel1, Cilleros Kévin1,2, Valentini Alice3, Cerdan
Axel1,4, Dejean Tony3, Iribar Amaia1, Taberlet Pierre5,
Vigouroux Régis6 and Brosse Sébastien1.
1Laboratoire Évolution & Diversité
Biologique (UMR5174), Université Paul Sabatier - Toulouse 3, CNRS, IRD, UPS, 118 route de Narbonne, 31062 Toulouse Cedex, France.
2Irstea, UR RECOVER, Equipe
FRESHCO, 3275 Route de Cézanne, Aix en Provence, France
3SPYGEN, 17 rue du Lac Saint-André
Savoie Technolac - BP 274, Le Bourget-du-Lac 73375, France.
4Écologie des Forêts de Guyane (UMR
EcoFoG), Campus Agronomique, Kourou, French Guiana.
5Laboratoire d’Ecologie Alpine (LECA
UMR5553), CNRS, Université Grenoble, 38041, Grenoble, France.
6HYDRECO, Laboratoire
Environnement de Petit Saut, B.P 823, F-97388 Kourou Cedex, French Guiana.
29 Abstract
Environmental DNA (eDNA) metabarcoding is a promising tool to estimate aquatic biodiversity. It is based on the capture of DNA from a water sample. The sampled water volume, a crucial aspect for efficient species detection, has been empirically variable (ranging from few centiliters to tens of liters). This results in a high variability of sampling effort across studies, making comparisons difficult and raising uncertainties about the completeness of eDNA inventories.
Our aim was to determine the sampling effort (filtered water volume) needed to get optimal inventories of fish assemblages in species-rich tropical streams and rivers using eDNA. Ten DNA replicates were collected in six Guianese sites (3 streams and 3 rivers), resulting in sampling efforts ranging from 17 to 340 liters of water.
We show that sampling 34 liters of water detected more than 64% of the expected fish fauna and permitted to distinguish the fauna between sites and between ecosystem types (stream versus rivers). Above 68 liters, the number of detected species per site increased slightly, with a detection rate higher than 71%. Increasing sampling effort up to 340 liters provided little additional information, testifying that filtering 34 to 68 liters is sufficient to inventory most of the fauna in highly diverse tropical aquatic ecosystems.
30 Introduction
In recent years, environmental DNA (eDNA) metabarcoding has been claimed as a promising tool to estimate biodiversity and its change through time (Taberlet et al. 2012; Thomsen and Willerslev 2015; Keck et al. 2017). In particular, this technique is now employed to identify the free DNA released by organisms in their environment (Taberlet et al. 2012). In aquatic ecosystems, the use of eDNA has been widely developed during the last years and has turned from the detection of specific species of amphibians, fish, mammals, insects and crustaceans (Thomsen et al. 2012) to the detection of whole communities (Evans et al. 2017; Lopes et al. 2017; Civade et al. 2016; Hänfling et al. 2016; Olds et al. 2016; Valentini et al. 2016). The latter studies besides reconstructing entire aquatic communities of fishes and amphibians, compared the detection performance between eDNA metabarcoding and capture-based sampling methods used to collect specimens in streams and rivers. Through this, they showed that both methods provided similar or more complete species inventories, hence opening avenues to use this method for ecological and conservation studies.
Obtaining biodiversity inventories with eDNA metabarcoding requires several subsequent steps including: DNA sampling and collection, laboratory protocols (DNA purification, marker targeting and sequencing) bioinformatics analyses and taxonomic assignment of sequences. The growing interest in this method resulted in the development of a considerable variety of protocols for each step of the eDNA procedure (Goldberg et al. 2016). This makes comparisons between studies challenging considering that it has been illustrated that the choice of markers (Hänfling et al. 2016; Evans et al. 2017), DNA collection methods (Deiner et al. 2015; Eichmiller et al. 2016) and laboratory protocols (Deiner et al. 2015; Eichmiller et al. 2016; Evans et al. 2017) may influence the detection of aquatic species. Furthermore, the environmental conditions and the targeted taxon can also affect detection rate because eDNA release varies among taxa (Deiner et al. 2015; Mächler et al. 2016) and water physiochemical factors may impact eDNA degradation (Barnes et al. 2014). Therefore, the performance of biodiversity detection in the water depends on a combination of protocols choice, as well as the environmental conditions and the targeted taxonomic group.
Despite an extended literature about the optimization of eDNA samples analysis to improve detection performance, less attention has been paid to how eDNA sampling design can be optimized. Consequently, there is a wide range of variation in the volume of sampled water among studies, ranging from a few centiliters to tens of liters (Mächler et al. 2016).
31
Nonetheless, sampling effort is a fundamental aspect for any ecological study or monitoring procedure (Gotelli and Colwell 2001) and might deeply affect results and interpretations. Some eDNA studies suggested that increasing the volume of sampled water improved the quality of the biodiversity assessment. For example, detection rates of anurans in tropical streams were higher when increasing sampling effort from 20 to 60 liters of water (Lopes et al. 2017). Moreover, Mächler et al. (2016) found a significant positive relationship between the sampled water volume and the detection rate for a macro-invertebrate species. In spite of this, due to financial and technical limitations, a threshold must be fixed in order to optimize eDNA inventories. This consists in determining the best compromise between sampling effort (and its associated financial and time costs) and accuracy of the biodiversity estimate.
Recently, the sampling effort needed to accurately estimate the fish species richness in temperate lakes has been assessed using spatial replicates and revealed that 5 to 20 liters of water were needed to detect the entire fish fauna (Hänfling et al. 2016; Evans et al. 2017). However, to date, the optimization of the eDNA sampling effort for the assessment of the whole community diversity in running waters (streams and rivers) has never been assessed. A better understanding of this effect will allow optimizing sampling efforts without reducing diversity estimates. For instance, Nascimento et al. (2018) found that the volumes of sampled sediments strongly impacted diversity assessments of benthic eukaryotic communities. The stakes of this understanding will be higher in tropical ecosystems, where large sampling efforts are often needed (Schneck and Melo 2010). Indeed, describing tropical communities can be challenging given the wide range of species diversity they host (Albert and Reis 2011), and the strong contribution of rare species to tropical biodiversity and ecosystem functioning (Mouillot et al. 2013, 2014).
The aim of this study was to determine the optimal sampling effort for fish inventories using eDNA metabarcoding in tropical streams and rivers. We built on preliminary tests in French Guiana in which 39 freshwater fish communities were sampled using the protocol designed by Valentini et al. (2016) for temperate rivers. Those tests showed that one water sample of ca. 50 liters permitted to detect a substantial part of the fauna without erroneous detections (Cilleros et al. 2018) (i.e. species not expected to occur in the sampled sites according to their known habitat preferences and watershed occurrence). Nevertheless, the standard protocol designed by Valentini et al. (2016), did not permitted to detect the whole fish fauna of the studied sites (Cilleros et al. 2018) comparing with traditional methods. We hence
32
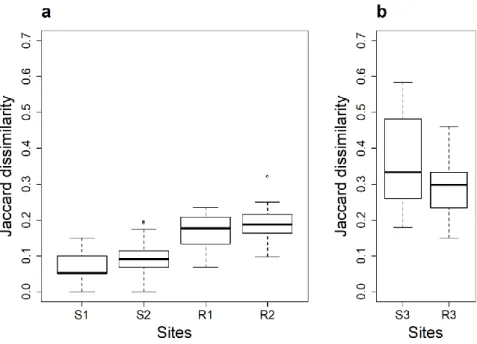
hypothesized that increasing sampling effort will enhance detection rate. To test this, we filtered water in four highly diverse Guianese streams and rivers using the VigiDNA 0.45 μm; SPYGEN filtering system. In each site we took 10 replicates. Each replicate was collected by filtering for 30 minutes, corresponding to 34 liters of filtered water (standard protocol). We then analyzed how sampling effort (from 34 to 340 liters) affects the estimation of fish biodiversity. Specifically, we sought to define the optimal sampling effort to describe communities through three diversity descriptors: species richness, dissimilarity of species composition and community structure patterns between sites. In addition, two sites were sampled for half of the time (relaxed protocol) than the other four sites to test whether reducing the filtering volume to 17 liters per replicate will degrade the diversity estimates (due to a lower filtered volume), or will improve the results as increasing filtering time can increase the accumulation of PCR inhibitors in the filter (Matheson et al. 2014).
Materials and methods
eDNA sampling
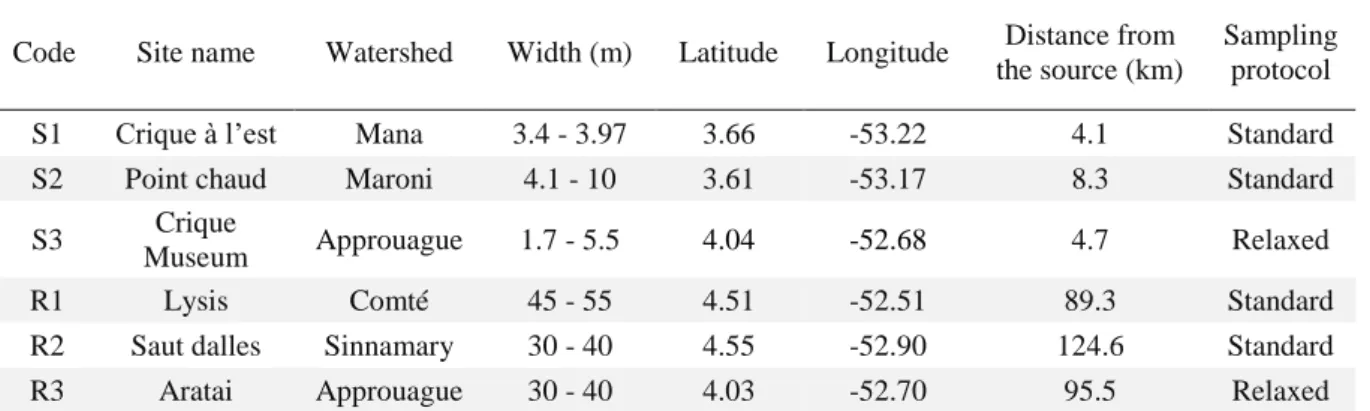
This study was conducted in French Guiana in November 2016 (during the dry season). This territory is subjected to an equatorial climate, and is covered by a dense primary rainforest. Freshwater bodies in this country host nearby 405 fish species (Le Bail et al. 2012), making Guianese freshwater ecosystems and excellent place to optimize eDNA sampling effort in species-rich communities. Six sites corresponding to three small streams and three rivers, were sampled (See Figure 6 in Chapter 1-VIII). Stream sites (S1, S2, and S3) are less than 10 meters wide and 1 meter depth whereas river sites (R1, R2, and R3) are wider than 30 meters and deeper than 1 meter. Those sites belong to distinct watersheds (Mana (S1); Maroni (S2); Comté (R1); Sinnamary (R2); Approuague (S3, R3)). They are free from human settlements upstream and are therefore little affected by human activities (See supplementary Table S1 for more details on localities and their characteristics).
At each site, 10 filtrations were performed in the same place, resulting in 10 field replicates per site. Each filtration was done following Valentini et al. (2016) protocol for running waters. Per replicate, we filtered 34 liters of water during 30 minutes in four sites (S1, S2, R1 and R2). In two complementary sites (S3 and R3) we filtered 17 liters of water during 15 minutes. This resulted in two different treatments called “standard protocol” and “relaxed