HAL Id: hal-01612002
https://hal.archives-ouvertes.fr/hal-01612002
Submitted on 19 Sep 2018
HAL is a multi-disciplinary open access
archive for the deposit and dissemination of
sci-entific research documents, whether they are
pub-lished or not. The documents may come from
teaching and research institutions in France or
abroad, or from public or private research centers.
L’archive ouverte pluridisciplinaire HAL, est
destinée au dépôt et à la diffusion de documents
scientifiques de niveau recherche, publiés ou non,
émanant des établissements d’enseignement et de
recherche français ou étrangers, des laboratoires
publics ou privés.
Investigation and FEA-based simulation of tool wear
geometry and metal oxide effect on cutting process
variables
Tchadja Kagnaya, Laurence Lambert, Myriam Lazard, Christine Boher,
Thierry Cutard
To cite this version:
Tchadja Kagnaya, Laurence Lambert, Myriam Lazard, Christine Boher, Thierry Cutard.
Investi-gation and FEA-based simulation of tool wear geometry and metal oxide effect on cutting
pro-cess variables.
Simulation Modelling Practice and Theory, Elsevier, 2014, 42 (SI), p.
84-97.
�10.1016/j.simpat.2013.12.009�. �hal-01612002�
Investigation and FEA-based simulation of tool wear geometry
and metal oxide effect on cutting process variables
Tchadja Kagnaya
a,b,⇑, Laurence Lambert
a,1, Myriam Lazard
c, Christine Boher
a, Thierry Cutard
aaUniversité de Toulouse, ICA (Institut Clément Ader), Ecole des Mines Albi, Campus Jarlard, F 81013 Albi Cedex 09, France
bUniversité de Lorraine, Laboratoire d’Énergétique et de Mécanique Théorique et Appliquée, LEMTA CNRS-UMR 7563, Ecole Nationale Supérieure des Mines
de Nancy (ENSMN), GIP-InSIC, 27 rue d’Hellieule, 88100 Saint-Dié-des-Vosges, France
cInstitut PPrime UPR 3346, Département Fluide, Thermique et Combustion, Ecole Nationale Supérieure d’Ingénieurs de Poitiers (ENSIP), Bâtiment B25, Campus Sud,
2 rue Pierre Brousse, 86000 Poitiers, France
Keywords: Flank wear Crater wear
Finite element analysis (FEA)
Oxidized adhesion layer (Fe2O3/Fe3O4/FeO)
a b s t r a c t
In machining, it is clearly noticed that the cutting tool wear influences the cutting process. However, it is difficult with experimental methods to study the effects of tool wear on sev-eral machining variables. Thus, in the literature, some earlier studies are performed sepa-rately on the effect of tool flank wear and crater wear on cutting process variables (such as cutting forces and temperature). Furthermore when the workpiece material adheres in cut-ting tool, it affects considerably the heat transfer phenomena. Accordingly, in this work the finite element analysis (FEA) is performed to investigate the influence of combination of tool flank and crater wear on the local or global variables such as cutting forces, tool tem-perature, chip formation on the one hand and the effects of the oxidized adhesion layer considered as oxide (Fe2O3/Fe3O4/FeO) on the heat transfer in cutting insert on the other
hand. In this investigation, an uncoated cutting insert WC–6Co and medium carbon steel grade AISI 1045 are used. The factorial experimental design technique with three parame-ters (cutting speed Vc, flank wear land VB, crater wear depth KT) is used for the first inves-tigation without adhesion layer. Then, only linear invesinves-tigation is performed. The analysis has shown the influence of the different configurations of the tool wear geometry on the local or global cutting process variables, mainly on temperature and cutting. The simula-tion’s results show also, the highly influence of the oxidized adhesion layer (oxide Fe2O3/
Fe3O4/FeO) on the heat transfer.
1. Introduction
In machining of steels, thermal and mechanical effects are the main causes of dimensional inaccuracy and bad surface integrity of the finished product (such as mechanical properties, surface roughness). These thermal and mechanical effects are mainly due to the flank wear, crater wear and adhesion wear whose are directly related to cutting process variables (such as cutting forces and temperatures). So, experimental, analytical and numerical tool wear investigations are still a very chal-lenging research issue. Indeed, tool wear phenomena are complex and involve many aspects related to cutting process. In the last decade, experimental studies are performed to investigate the tool wear effect on machined surface quality of manufac-tured products[1–3]. Matsumoto et al.[3]investigate the effect of cutting parameters on the residual stress in order to find ⇑Corresponding author at: Université de Lorraine, Laboratoire d’Énergétique et de Mécanique Théorique et Appliquée, LEMTA CNRS-UMR 7563, Ecole Nationale Supérieure des Mines de Nancy (ENSMN), GIP-InSIC, 27 rue d’Hellieule, 88100 Saint-Dié-des-Vosges, France. Fax: +33 3 29 42 18 25.
E-mail address:tchadja.kagnaya@insic.fr(T. Kagnaya).
why deep residual stresses are created. They found that the tool edge geometry is the dominant factor deciding the residual stress profile. Han[4]and Han et al.[5]study the white layer formation due to phase transformation in orthogonal machin-ing of AISI 1045 annealed steel. This investigation is performed at different cuttmachin-ing speeds and tool flank wear. They found that the depth of white layer formed in AISI 1045 depends on cutting speed and flank wear, but the tendency is not clearly identified. Remadna and Rigal[6]study the evolution of tool wear and cutting forces during time in the case of hard turning with cubic boron nitride (CBN) inserts. They found that the cutting forces increase gradually with the increase of the cutting distance and the tool flank wear. They also showed that the geometry of the cut evolves considerably relative to the tool lifetime, but tools wear does not directly or appreciably affect the manufactured surface. This last observation of Remadna and Rigal[6]is contrary with the results of Grzesik and Wanat[7]and Grzesik[8]studies. Indeed Grzesik and Wanat[7]
found that flank wear affects directly surface roughness during the hard turning using differently shaped ceramic tools. They point out that the effect of flank wear on surface roughness is also due to temperature at the tool/flank wear land which can be high about 1000!C. This high temperature can facilitate the material plastification and as a consequence the material side flow increases. These studies show that the influence of tool wear on machining process needs more investigation. Beside several experimental researches and because computers are more and more powerful, numerical methods are widely used to investigate cutting process. Finite element analysis is helpful to better understand and predict various variables in the cut-ting process such cutcut-ting force, temperature, strain, chip formation, tool wear, and heat transfer. Thus, recent research issues attempt to simulate cutting tool wear progression and its effects on various variables[9,10]. However, the modeling of tool wear phenomena and its coupling to the finite element cutting process are complex. Sometimes, tool wear geometry ob-tained with numerical cutting simulation does not represent the real tool wear geometry since numerical cutting simulation takes few milliseconds[11,12]. To better understand tool wear effect of different cutting process, it is relevant to study the effect of tool wear on cutting variables by using different geometries from the worn tool. Li et al.[13]used cutting process simulations to study the effects of crater wear on the chip formation process. Chen et al.[14]and Li and Liang[15] inves-tigated the effects of flank wear land on cutting force, temperature, chip formation and residual stresses. These studies show that tool wear influences different cutting variables. However, these investigations deal separately with the effects of the flank wear and crater wear on the cutting process. In reality, in machining process, flank and crater wear appear and develop simultaneous and in particularly in high speed cutting even if one of both wear type can predominate. Moreover, during high machining of free carbon steel, important adhesion wear appears[16]. This adhesion layer is an oxides layer (Fe2O3/Fe3O4/ FeO) and can influence machining process. Frang and Zhang[17]found that the adhering layer formation during tool wear progression in turning of free-cutting stainless steel has a stronger protective effect on the rake face, and thus crater wear slows down. Gekonde and Subramanian[18]have shown that the seizure at the tool–chip contact controls the tribological condition and adhesion layer formation. Kudou et al.[19]have recently shown that the longer tool life could be obtained by diffusing Fe to the surface of cutting tool in comparison undiffusing Fe cutting tool. As literature review, the few machining process investigations deal with the influence of this adhesion layer on the cutting process variables, in particularly heat transfer phenomena which remain a challenge research area.
This work deals with finite element analysis of tool flank wear and crater wear combination effects on cutting process variables such as cutting forces, temperature on the one hand, and the effects of oxides layer (Fe2O3/Fe3O4/FeO) on heat transfer on the other hand.
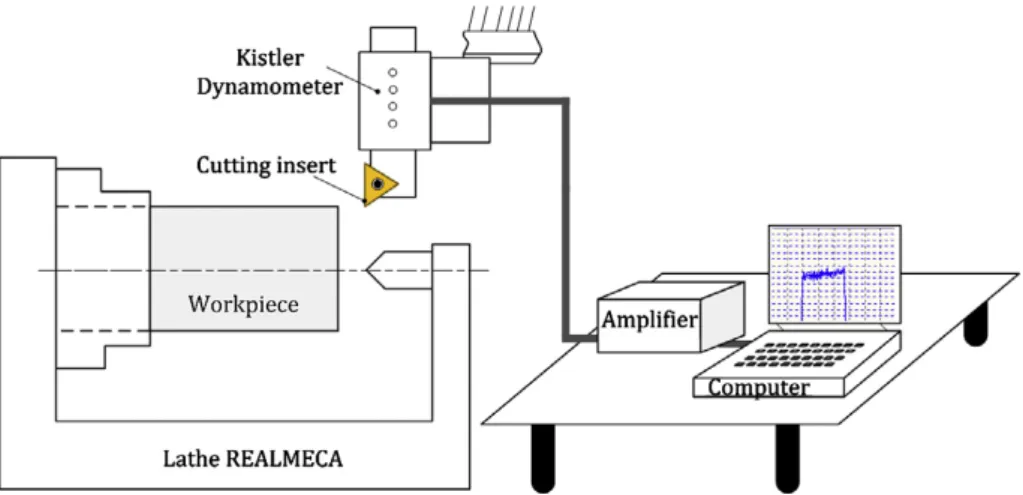
2. Experiment setup
To provide a consistent tool wear geometry for numerical simulations, turning tests are performed. A schematic exper-imental machining setup is shown inFig. 1. The experimental work is carried out by turning a normalized medium carbon steel grade AISI 1045 (C45E) under dry machining. Two different speeds (Vc = 300 m/min and 400 m/min) with a constant
feed rate (f = 0.1 mm/rev) and constant depth of cut (ap = 1.1 mm) are used for experimental tests.Table 1gives the mechan-ical properties and the chemmechan-ical composition of AISI 1045. Uncoated cemented carbide insert with an ISO designation TCMW 16T304 is used in this investigation. Cutting insert geometry definition is listed inTable 2. The cutting insert is fixed on tool holder of the standard ISO designation STGCL 2525M16. KISTLER Model 9257B dynamometer is used to measure the three components of the cutting forces (main cutting force ‘‘tangential’’ Fc, feed force ‘‘axial’’ Ff, and depth of cut force ‘‘radial’’ Fp) during cutting tests. After each cutting, the tool-chip contact length, the flank wear land length and crater wear depth are measured for finite elements analyses.
3. Modeling procedures of the numerical simulations 3.1. Tool geometry definition parameters
After cutting tests, tool wear analyses are performed to measure some tool wear parameters.Fig. 2shows an example of macroscopic wear view of flank wear and crater wear obtained with light optic microscopy (LOM) and confocal optical scan-ning microscopy (COSM). The detail of this investigation can be found in[16]. The flank wear parameter VB (Fig. 2a) is mea-sured with LOM and others wear parameters processing (KT, KM and KW) are obtained with COSM (Fig. 2c–e).Fig. 2c allows measuring the tool-chip contact length and deducing the value of the parameter KM shown inFig. 3a.Fig. 2d shows that the average crater depth is about 20
l
m for cutting speed of 400 m/min.Fig. 2e shows 3D images of worn tool pattern at 400 m/ min cutting speed. The observation ofFig. 2e clearly shows that the profile of the crater wear in the xz-plane is quasi-inde-pendent of the y-axis. So, all numerical simulation’s investigations to study the effects of tool wear on machining process variables are performed on 2D orthogonal cutting process with the finite element software DEFORM 2D V9.1, even if the experimental machining tests are performed at 3D orthogonal cutting process. Indeed, the influence of the depth of cut on the cutting wear is generally insignificant in turning cutting process. MoreoverFig. 2b shows an important adhesion layer in crater wear land. Thus, a cross section perpendicularly to the cutting edge (Fig. 2b) leads to observe and quantify adhesion layer thickness (considering as oxide Fe2O3/Fe3O4/FeO). So, during FEA analyses, the worn tool with an adhesion layer is con-sidered as a coating tool with WC–Co as substrate as adhesion layer thickness as rigid coating layer (Fig. 3b). Detail SEM micrograph presented inFig. 3a shows an important adhesion layer in both flank and crater wear land. Based onFig. 3a, the average thicknesses of adhesion layers are measured. These vary from 1 to 7l
m. However, locally the thickness of adhe-sion layers up to 15l
m. Based on the analysis and measurement of tool wear parameters, geometrical models of worn tools are drawn (see scheme example of the worn tool inFig. 3b).According to the experiments, two strategies of cutting process simulation are performed. At the first time, based on the cutting tool wear parameters measured, a set of simulations base on statistical design of experiments (DOE) technique is used to investigate the effects of tool wear on cutting process variables. The DOE is a statistical technique that provides an objective measure of how design parameters are correlated and the effective contribution of each one at the design per-formance. More detail of this technique can be found in[21]. Two levels of three factors full factorial design is used. The three design factors considered in the design of the experiments are cutting speed (Vc), tool flank wear (VB) and crater wear depth (KT). The levels of the variables are listed inTable 3. In the second time, the cutting process simulations are performed in order to study the effects of adhesion layer thickness on the cutting process variables, in particularly on the heat transfer. In this last study, the cutting speed (Vc), tool flank wear (VB) and crater wear depth (KT) are kept constant while the adhe-sion layer thickness (tAd) varies. The adhesion layer thicknesses (tAd) are selected according to the tool wear investigations.
Table 4shows the corresponding Vc, VB, KT and tAdvalues.
Table 1
Mechanical properties and chemical composition of AISI 1045 steel.
Components C Si Mn P S Cr Ni Mo Cu
%wt 0.45 0.22 0.66 0.027 0.032 0.26 0.15 0.02 0.18
Yield strength (MPa) 437
UTS (MPa) 704
Table 2
Insert and tool holder geometry characteristics.
Components Values Material
Insert: TCMW 16T304 – WC–6Co
Tool rake angle (!) 0 –
Tool clearance angle (!) 7 –
Cutting nose radius (mm) 0.4 Cutting edge radius (mm) 0.04
Fig. 2. (a) Tool flank wear, (b) tool crater wear, (c–d) 2D crater wear topography (e) 3D crater wear topography (Vc = 400 m/min, f = 0.1 mm/rev and ap = 1.1 mm)[16,20].
Fig. 3. (a) Cross-section, perpendicular at the cutting edge and detail of adhesion layer on tool flank wear and on tool crater[16]. (b) Tool wear geometry with adhesion layer model.
Table 3
Design scheme of process parameters and their levels.
Variable name Low level (!1) High level (+1)
Cutting speed Vc (m/min) 300 400
Tool flank wear VB (lm) 100 200
3.2. Workpiece and tool material properties
A Johnson–Cook type constitutive equation is used to describe the thermo-viscoplastic behavior of AISI 1045. The flow stress is given as follows:
r
p!e
p; _e
p; T"¼ A þ Be
np # $ 1 þ C lne
_e
_p p0 % & ' ( 1 ! TT ! Tr m! Tr % &m ' ( ð1Þ where A and B are the material constants, C is the strain rate sensitivity, n is the strain-hardening, m is the thermal softening exponent, epis the equivalent plastic strain, _e
pis the plastic strain rate (s!1), _e
p0is the reference of plastic strain rate (s!1), T is the temperature, Tmis the material melting temperature and Tris the reference temperature. The AISI 1045 steel parameters for Johnson–Cook model are listed inTable 5. The tool is considered as a rigid body with a very large elastic modulus and the oxide adhesion layer is considered uniform. The physical properties of AISI 1045, WC–6Co and adhesion layer are presented inTable 6.3.3. FEA geometry and boundary conditions
An example of FEA geometry configuration of the cutting process is presented inFig. 4. All numerical cutting simulations are performed at the same time equal to 5 ms. Except cutting temperatures, this cutting simulation time allows for a stable regime for cutting forces, chip formation, etc. It is assumed that the top and right boundaries of the tool, and the left and bottom boundaries of the workpiece are maintained at a constant reference temperature Tr. During numerical cutting sim-ulations, the cutting tool is maintained fixe and the workpiece move according to the top boundary of the workpiece (Fig. 4). For all simulations, the cutting depth is kept constant with 0.1 mm. The cutting tool and workpiece are meshed with a plane strain coupled linear displacement/temperature 4 nodes element. The workpiece and cutting tool are meshed about 2000 elements respectively 800 elements. As one can see inFig. 4, the parts of workpiece and cutting tool near of tool/workpiece contact zones are refined with a minimum element size equal 4
l
m for workpiece and 6l
m for cutting tool. When theTable 4
Adhesion layer thickness variation.
Variable name Values
Adhesion layer thickness tAd(lm) 1 3 5 7
Cutting speed Vc (m/min) 400
Tool flank wear VB (lm) 200
Tool crater wear KT (lm) 30
Table 5
Johnson–Cook thermo-viscoplastic parameters of AISI 1045[22].
A(MPa) B(MPa) n C m e_p0(s!1) Tr(!C) Tm(!C)
553.1 600.8 0.234 0.0134 1 1 20 1460
Table 6
Thermo-physical and mechanical properties of AISI 1045 and WC–6Co. Tool WC–6Co[16,23]
Thermal conductivity Temperature (!C) 20 100 200 300 500 600
Value (W/m!C) 117 110 97 86 85 83
Specific heat (J/kg!C) 222
Density (kg/m3) 14,900
Young modulus (MPa) 600,000 Adhesion layer (Fe2O3/Fe3O4/FeO)[24–26]
Thermal conductivity (W/m!C) 20 Specific heat (J/kg!C) 644 Density (kg/m3) 5250–5800
Young’s modulus (MPa) 150,000–350,000 Workpiece AISI 1045[27]
Thermal conductivity (W/m!C) !2 & 10!5T2! 0.0211 T + 53.965 (100 !C < T < 800 !C)
Specific heat (J/kg!C) 420 + 0.504 T
Density (kg/m3) 7800
Thermal expansion (m/m/!C) 12 & 10!6
cutting tool advances into the workpiece, it generates two mainly issues at the tool/workpiece interface. The first one is the friction between the tool rake face and chip, and between the tool flank face and the machined surface on the workpiece. In metal cutting process, sticking friction takes place in the region near to the cutting edge in which the chip is intimately in contact with chip. Thus, shear friction corresponds to a more accurate tribological phenomenon in this region. For the rest region of chip-rake face contact and the region of workpiece-flank face contact, sliding friction appears. However, in this investigation, the Coulomb’s friction coefficient is assigned for all contact between tool and workpiece based upon the assumption that sticking friction region is small. According to the experimental results[16], constant friction coefficient of 0.6 is adopted. The second problem concerning the tool-workpiece interface is heat transfer phenomenon. Cutting tool has two main sources due to the deformation work on the primary shear zone and to the friction between tool and work-piece. Only a few part of those heat sources flows into cutting tool. But major problem in cutting process simulation is to introduce a more accurate consistent interface heat transfer coefficient parameter hc. However, this parameter is very dif-ficult in experimental device. Umbrello et al.[28]show that hc depend on the cutting parameters and hence cutting temper-ature and tool rake pressure. They found that heat transfer coefficient parameter hc increases with cutting speed and rake face contact pressure for low conventional cutting speed. However, it is well known that in high machining process, the rake face contact pressure decreases when cutting speed increases and resulting of hc decreasing. Based upon the Umbrello et al.
[28]results, heat transfer hc = 100 N s!1mm!1is chosen in all cutting simulations. 4. Results and discussion
4.1. Effects of tool wear geometry on cutting forces
Cutting simulations with initial (unworn) tool geometry are achieved before performing the tool wear geometry on cut-ting process variables. The measured cutcut-ting and feed forces compared with those obtained by orthogonal cutcut-ting simulation are listed inTable 7. It can be observed that the experimental cutting force and feed force are 30% respectively 40% higher compared to numerical ones. These differences between experimental cutting forces and orthogonal cutting simulation are mainly due to the cutting nose radius. Indeed, the results of the previous study[29]showed a better correlation between experiences and numerical results. These observations are consistent with the experimental results presented by Arse-cularatne et al.[30], which showed that the increase in the cutting nose radius involves an increase in the cutting forces. However the set of orthogonal cutting simulations with tool wear geometry is validated according of the experimental re-sults presented by Han[4].Table 8shows the measured cutting and feed forces obtained by Han[4]by using cutting tool with 100
l
m of flank wear land compared with those obtained by orthogonal cutting simulation with a same flank wear land and two different crater wear depths. It can be observed a more accurate agreement between experimental cutting forces and numerical one compared to the feed forces.Table 8shows also that the increasing crater wear resulting to decreasing all the cutting forces.Fig. 4. FEA geometry configuration of the cutting process, mesh and dimensions (in mm) of the workpiece and cutting tool.
Table 7
Comparison of experimental[16]and numerical cutting forces.
Cutting speed Fc (N/mm) Ff (N/mm) Max. of Tool temp. (!C) Avg. of workpiece Temp. T_wp (!C)
Exp. Num. Exp. Num.
300 m/min 320 222 225 134 592 214
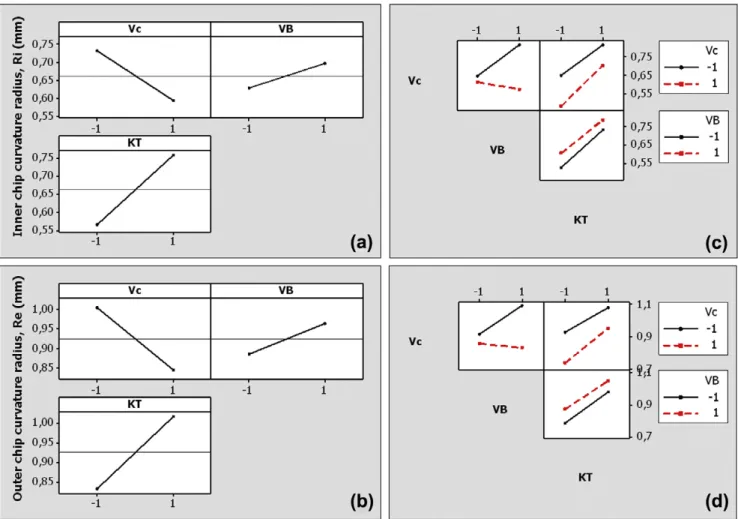
Fig. 5shows the main effect of Vc, VB and KT on cutting force and feed force and their interaction effects. As it is clear from
Fig. 5a and b, Vc and KT produce the same effect on cutting and feed forces. Increases Vc or KT leads to decrease cutting gen-erally forces. As known, the heat generated in machining increases with increasing cutting speed, hence produces workpiece material thermal softening. This phenomenon can explain the decreasing of the cutting and feed forces with increasing cut-ting speed. The effects of KT on cutcut-ting forces can be considered as the effects produced by cutcut-ting rake angle on cutcut-ting forces. So, it is clear that the decreasing of the cutting and feed forces with increasing cutting KT is in agreement with Caprino et al.[31]results. VB effect on cutting force and feed force is also depicted inFig. 5a and b. It can be seen that increasing VB involves an increase of cutting and feed forces. This is attributed to the increasing of the contact area between tool and work-piece machined surface.Fig. 5c and d show the duals Vc & VB, Vc & KT and VB & KT interaction effects on the cutting and feed forces respectively. One can see that duals Vc & VB and VB & KT are only significant interaction effects while the Vc & KT has less or insignificant interaction. This analysis shows that it is important to couple crater wear and flank wear to better achieve the tool wear effects on cutting process variables.
4.2. Effects of tool wear geometry on cutting temperature
In this section, the analysis of the effect of tool wear on the temperature is only qualitative because for the cutting sim-ulation time = 5 ms, the heat transfer in the tool remains transient.
Fig. 6shows a simulated temperature distribution obtained for cutting speed Vc = 400 m/min and Vc = 300 m/min at dif-ferent cutting tool geometry. The same contour scale of the temperature distribution is used to a better global view
Table 8
Comparison of experimental[4]and numerical cutting forces for Vc = 300 m/min, VB = 100lm.
Fc (N/mm) Ff (N/mm) Max. of Tool Temp. (!C) Avg. of workpiece Temp. T_wp (!C)
Exp. values[4] 240 140 – –
Num. values, KT = 20lm 246 164 834 329
Num. values, KT = 30lm 235 153 915 334
Fig. 5. Main effects of Vc, VB and KT on cutting force (a) and feed force (b). Dual interactions effects between Vc, VB and KT on cutting force (c) and feed force (d).
comparison. One can notice that the maximum temperature cutting tool is higher for Vc = 400 m/min (Fig. 6a) compared with Vc = 300 m/min (Fig. 6b). This confirms that increasing cutting speed produces workpiece material thermal softening, hence reduction of the cutting and feed forces.Fig. 6c and d show tool wear effect on temperature distribution in comparison with temperature distribution of new tool (Fig. 6b). As seen fromFig. 6, the maximum temperature of cutting is located on flank wear land, so the average temperature along the flank wear is considered for tool wear effects on tool temperature analysis. The workpiece surface temperature is also analyzed based on average temperature obtained in zone 2 along of ma-chined surface (Fig. 7).
Fig. 7presents the influence of VB, KT and tAdon the workpiece surface temperature. Curve 1 illustrated the evolution of the workpiece surface temperature when unworn tool in used. It is clearly observed inFig. 7that the flank wear and the crater wear cause an increase of the temperature of the machined surface (curve 2) in comparison of that obtained with new cutting tool (curve 1). This is due to the increasing of the contact area between tool and workpiece machined surface, which generates more friction heat source. On the other hand comparing curves 2 and 3, it notes that at KT constant,
Fig. 6. Cutting tool temperature distribution for unworn tool at (a) Vc = 400 m/min, (b) Vc = 300 m/min and for two configurations of cutting tool wear geometry at (c) Vc = 300 m/min, VB = 200lm, KT = 20lm and (d) Vc = 300 m/min, VB = 200lm, KT = 30lm.
increasing VB has a relatively insignificant effect on the temperature of the machined surface. The effect of the adhesion layer can be established by comparing cutting temperatures between curves 3 and 4. Indeed, the adhesion layer plays the role of thermal barrier due to its low conductivity and its high specific heat capacity compared to that of workpiece (Table 6). Thus,
Fig. 7. Cutting temperature evolution along the machined surface for different cutting tool geometry: constant cutting speed Vc = 400 m/min, variable flank wear VB = (0, 100 and 200lm), variable crater wear deep KT = (0 and 30lm) and adhesion layer thickness tAd= 7lm (example of detail of legend:
Vc400VB200KT30tAd7 = cutting speed Vc = 400 m/min, flank wear VB = 100lm, crater wear deep KT = 30lm and adhesion layer thickness tAd= 7lm).
Fig. 8. Main effects of Vc, VB and KT on flank wear land temperature, (a) and on machined surface (b). Dual interactions effects between Vc, VB and KT on flank wear land temperature (c) and on machined surface (d).
the heat flux flows easily in the workpiece, which leads to a significant increase in temperature at workpiece during machining.
Fig. 8shows the main effect of Vc, VB and KT on the average cutting tool temperature along the flank wear land (T_VB) and the average temperature of the workpiece machined surface (T_wp) and their interaction effects. As observed previously for the cutting forces, it is clear fromFig. 8a and b that increasing Vc and KT values cause an increase of the average cutting tool and the workpiece surface temperatures whose have negative effect on the machined surface quality. However, Vc has more effect on T_VB and T_wp. In contrary VB has less effect on both T_VB and T_wp temperatures. The increasing T_VB and T_wp with the increasing Vc and KT can be explained by the fact that the heat source due to plastic deformation in the shear zone and the heat source due to the intense friction between the chip and the rake face are more important compared to the heat source due to friction between the workpiece surface and the tool flank wear land. Indeed, in machining process, the increase of cutting speed induces the plastic deformation increasing, hence generating heat source in shear zone and second-ary deformation zone.
The duals Vc & VB, Vc & KT and VB & KT interaction effects on the average cutting tool and workpiece surface tempera-tures are illustrated inFig. 8c and d respectively.Fig. 8c and (d) show that duals Vc & VB and Vc & KT have only significant interaction effects which is consistent with the previously discussion on the mean effects above. The absence of an important dual VB & KT interaction effect on T_VB and T_wp is mainly due to the VB effect as it can be seen inFig. 8a and b. 4.3. Effects of tool wear geometry on chip formation
The main effects of Vc, VB and KT on chip thickness values are plotted inFig. 9a. Vc and KT have a negative effect. How-ever VB effect on chip thickness is not significant. These results suggest that the increase of Vc and KT involves a decrease a chip thickness. The decreasing of chip thickness tends to produce aperiodic or periodic saw tooth chip or segmentation chip. This is in agreement with the evolutions of temperatures observed previously. Indeed in machining process, a transition from a continuous to a shear localized chip occurs as the machining temperature is increased. The effects of interaction between Vc, VB and KT are plotted inFig. 9b. All the interactions are slight effects on chip thickness. It can be seen fromFig. 9b that the duals Vc & VB and VB & KT have more significant effect on chip thickness in comparison of dual Vc & KT one. Moreover, the inner (Ri) and outer (Re) chip curvature radius obtained in cutting simulations are analyzed in order to better understanding the morphology of the chip. Important negative effect is observed for Vc whereas a positive effect is observed for KT on both (Ri) and (Re) as depicted inFig. 10a and b. The significant but less important positive effect for VB is also observed. The neg-ative effect observed for Vc can be reasonable explained with thermoelastic stress of the chip. As it is noticed previously, increasing cutting speed resulting in increase chip temperature. However the free surface of the chip is exposed to the air in dry machining. Thus, the important heat gradient, which appears in the chip thickness, generates a high compressive and high tension stresses on free face of chip respectively on chip face in contact with tool rake face. This phenomenon will tend to produce more and more curved chips. A positive effect observed for KT can be related to an artificial increase in the rake angle. This observation is in agreement with Joshi et al.[32]results who observe that the chip curvature radius increases with the increase of cutting rake face. Binary Vc & VB, VB & KT and Vc & KT interactions effect on the both inner (Ri) and outer (Re) chip curvature radius are plotted inFig. 10b and d.
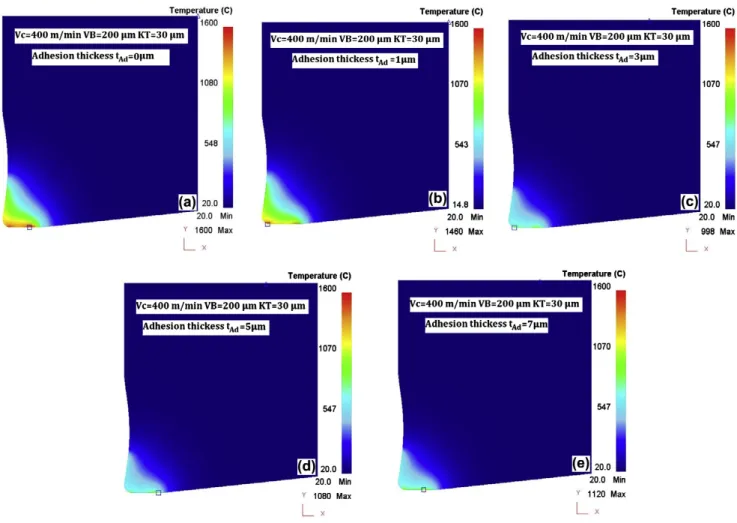
4.4. Effects of metal oxide adhesion layer on temperature and cutting forces
To study the adhesion layer on cutting process variables, the tool wear geometry is created and the adhesion layer is added as coating thickness. Table 9 lists some cutting process output variables according for different adhesion layer
thickness. As one can notice it inTable 9, cutting process variables (cutting forces, chip temperature, workpiece machined surface temperature, etc.) do not evolve linearly. Increase adhesion layer thickness leads to the reduction of the cutting force except for adhesion layer thickness tAd= 1
l
m in which it takes the highest value. Globally, the feed force decreases with the increase of the adhesion layer thickness. The effect of the adhesion layer on the cutting tool temperature distribution is illus-trated inFig. 11. It can be observe inFig. 11that the adhesion layer promotes highly decreasing of the cutting tool temper-ature. However, the maximum cutting tool temperature (Fig. 11) or average temperature of flank wear land decreasing does not follow a linear trend with the adhesion layer thickness. The cutting tool temperature listed inTable 9suggested that for the adhesion layer thickness a value of tAd6 3l
m, the average temperature of flank wear land decreases highly with the increase in adhesion layer thickness. This phenomenon suggests that the thin adhesion layer thickness has slightly effect on heat transfer. Indeed the unit thermal resistance computed as ratio of (adhesion thickness) over (thermal conductivity of adhesion) for thin adhesion layer can be neglected in comparison of substrate WC–6Co one. Thus, heat source flows easily in the tool through the tool/workpiece interfaces. On the other hand, when adhesion layer thickness becomes significantFig. 10. Main effects of Vc, VB and KT on inner curvature radius (a) and outer curvature radius (b). Dual interactions effects between Vc, VB and KT on inner curvature radius (c) and outer curvature radius (d).
Table 9
Adhesion layer thickness variation effects on cutting process variables.
Variable name Values
Adhesion layer thickness tAd(lm) 0 1 3 5 7
Cutting force Fc (N/mm) 237 251 224 223 225
Feed force Ff (N/mm) 175 171 149 149 154
Mean temperature on flank wear (T_VB,!C) 1343 1266 836 843 877
Mean temperature on machined surface (T_wp,!C) 398 355 492 466 540
Max temperature of chip (T_chip,!C) 738 749 917 918 934
Chip thickness (mm) 0.247 0.257 0.231 0.230 0.230
Chip curvature (mm) Inner radius, Ri 0.65 0.56 0.35 0.35 0.30
(3
l
m for example), it produces highly effect on heat transfer problem. In contrary for high adhesion layer thickness tAd> 3-l
m the average temperature of flank wear land increases slightly with the increase in adhesion layer thickness. This trend can be explained by the fact that, when tAd> 3l
m, conduction phenomenon in the adhesion layer is established as in bulk material. Globally, increase adhesion layer thickness promotes in increasing the maximum chip temperature and the average machined surface temperature. This result is in agreement with Grzesik[33]results who reports that coating layer improves the heat flow into the chip and workpiece. However, one can notice for tAd= 1l
m, the average machined surface tempera-ture takes the lowest value. The same trend is observed for chip thickness, but this time chip thickness takes the highest value for tAd= 1l
m. In definitely for all observation for tAd= 1l
m, one can suggest that the heat transfer phenomenon in very thin adhesion layer is not full understanding and totally controlled.The inner and outer chip curvature radiuses also decrease with increasing the adhesion layer thickness. That is reasonable related with the increasing of the chip temperature. The chip morphology evolution is clearly depicted inFig. 12. The result suggests that increase adhesion layer thickness produces more curved chip which can evolve towards the aperiodic or peri-odic saw tooth chip or the segmentation chip.
Fig. 11. Effect of different oxide adhesion layer thickness on cutting tool temperature distribution (Vc = 400 m/min).
5. Conclusion
FEA are performed in this work to investigate tool wear geometry without and with adhesion layer effects on cutting pro-cess variables. Thus, the following conclusions can be drawn from this work:
' The simulated cutting and feed forces show good agreement with the measured data[4], which validates this study. ' Cutting and feed forces decrease with increasing KT. Whereas increasing VB involves an increase of cutting and feed
forces. Hence, for cutting tool with a rake angle equal zero, little crater tool wear can be considered as a benefit effect on cutting forces.
' This investigation highlights that the increase of Vc and KT causes the increase in the average cutting tool and workpiece surface temperatures whose have negative effect on machined surface quality.
' Only duals Vc & VB and VB & KT have significant interaction effects on cutting forces and the average cutting tool and workpiece surface temperatures.
' The effect of adhesion layer on cutting process variables is highly depicted. Thus, adhesion layer promotes the increase of the workpiece surface temperature whereas decreasing tool flank wear land temperature.
' It is also observed that the adhesion promotes more curved chips which can evolve towards the aperiodic or periodic saw tooth chip or the segmentation chip.
Acknowledgments
The authors wish to thank ACTARUS S.A.S. and CIRTES for their help in carrying out part of experiments. They would also thank technicians of ICA-Albi and of GIP-InSIC for their helpful contributions.
References
[1]A. Munoz-Sanchez, J.A. Canteli, J.L. Cantero, M.H. Miguelez, Numerical analysis of the tool wear effect in the machining induced residual stresses, Simul. Model. Pract. Theory 19 (2011) 872–886.
[2]M. Mohammadpour, M.R. Razfar, R. Jalili Saffar, Numerical investigating the effect of machining parameters on residual stresses in orthogonal cutting, Simul. Model. Pract. Theory 18 (2010) 378–389.
[3]Y. Matsumoto, F. Hashimoto, G. Lahoti, Surface integrity generated by precision hard cutting, CIRP Ann. Manuf. Technol. 48 (1) (1999) 59–62. [4] S. Han, Mechanisms and Modelling of White Layer Formation in Orthogonal Machining of Steels, Phd Thesis of Georgia Institute of Technology, 2006,
pp. 46.
[5]S. Han, S.N. Melkote, M.S. Haluska, T.R. Watkins, White layer formation due to phase transformation in orthogonal machining of AISI 1045 annealed steel, Mater. Sci. Eng., A 488 (2008) 195–204.
[6]M. Remadna, J.F. Rigal, Experimental study of the wear of cubic boron nitride (CBN) cutting tools, in: Optimum Technologic Systems and Materials in the Machines Building Field—TSTM 5, Romanian Academy, Romania, 1999, pp. 154–161.
[7]W. Grzesik, T. Wanat, Comparative assessment of surface roughness produced by hard machining with mixed ceramic tools including 2D and 3D analysis, J. Mater. Process. Technol. 169 (2005) 364–371.
[8]W. Grzesik, Influence of tool wear on surface roughness in hard turning using differently shaped ceramic tools, Wear 265 (2008) 327–335. [9]Y.-C. Yen, J. Söhner, B. Lilly, T. Altan, Estimation of tool wear in orthogonal cutting using the finite element analysis, J. Mater. Process. Technol. 146 (1)
(2004) 82–91.
[10]G. List, G. Suttern, A. Bouthiche, Cutting temperature prediction in high speed machining by numerical modelling of chip formation and its dependence with crater wear, Int. J. Mach. Tools Manuf. 54–55 (2012) 1–9.
[11]L.-J. Xie, J. Schmidt, C. Schmidt, F. Biesinger, 2D FEM estimate of tool wear in turning operation, Wear 258 (2005) 1479–1490.
[12]Y.-C. Yen, J. Söhner, B. Lilly, A. Taylan, Estimation of tool wear in orthogonal cutting using the finite element analysis, J. Mater. Process. Technol. 146 (2004) 82–91.
[13]K. Li, X.-L. Gao, J.W. Stutherland, Finite element simulation of the orthogonal metal cutting process for qualitative understanding of the effects of crater wear on the chip formation process, J. Mater. Process. Technol. 127 (2002) 309–324.
[14]L. Chen, T.I. El-Wardany, W.C. Harris, Modelling the effects of flank wear land and chip formation on residual stresses, CIRP Ann. Manuf. Technol. 53 (1) (2004) 95–98.
[15]K.-M. Li, S.Y. Liang, Modeling of cutting forces in near dry machining under tool wear effect, Int. J. Mach. Tools Manuf. 47 (2007) 1292–1301. [16] T. Kagnaya, Contribution à l’identification des mécanismes d’usure d’un WC–6% Co en usinage et par une approche tribologique et thermique, Phd
thesis of Institut Mines-Telecom ParisTech, 2009.
[17]X.D. Frang, D. Zhang, An investigation of adhering layer formation during tool wear progression in turning of free-cutting stainless steel, Wear 197 (1996) 169–178.
[18]H.O. Gekonde, S.V. Subramanian, Tribology of tool–chip interface and tool wear mechanisms, Surf. Coat. Technol. 149 (2002) 151–160. [19]K. Kudou, T. Obon, S. Okada, Crater wear characteristics of an Fe-diffused carbide cutting tool, J. Mater. Process. Technol. 132 (2003) 255–261. [20] T. Kagnaya, C. Boher, L. Lambert, M. Lazard, T. Cutard, Mécanisme d’endommagement tribologique du WC–Co en usinage, in: J.-F. Rouchon, C. Boher
(Eds.), Actes des journées internationales francophones de tribologie (JIFT 2010) Albi, France, 2010, pp. 355–360. [21] A. Jiju, Design of Experiments for Engineers and Scientists, Butterworth-Heinemann, (2003) pp. 60–64.
[22]S.P.F.C. Jaspers, J.H. Dautzenberg, Material behavior in conditions similar to metal cutting: flow stress in the primary shear zone, J. Mater. Process. Technol. 122 (2002) 322–333.
[23] <www.matweb.com>, MatWeb™ Materials Database, 2013.
[24] R.C. Weast (Editor-in-Chief), CRC Handbook of Chemistry and Physics 64th ed., CRC Press Inc., Boca Raton, Fl, 1984. [25] COMSOL Multiphysics 4.1, COMSOL Material Library user’s Guide Copyright 1998–2010 COMSOL LAB.
[26]D. Chicot, J. Mendoza, A. Zaoui, G. Louis, V. Lepingle, F. Roudet, J. Lesage, Mechanical properties of magnetite (Fe3O4), hematite (a-Fe2O3) and
goethite(c-FeO.OH) by instrumented indentation and molecular dynamics analysis, Mater. Chem. Phys. 129 (2011) 862–870. [27] ASM handbook, Metals-Handbook: Physical Properties of Carbon and Low-Alloy Steels, Ohio, USA, 1992.
[28]D. Umbrello, L. Filice, S. Rizzuti, F. Micari, On the evaluation of the global heat transfer coefficient in cutting, Int. J. Mach. Tools Manuf. 47 (2007) 1738– 1743.
[29]B. Haddag, T. Kagnaya, M. Nouari, T. Cutard, A new heat transfer analysis in machining based on two steps of 3D finite element modelling and experimental validation, Heat Mass Transfer 49 (1) (2013) 129–145.
[30]J.A. Arsecularatne, R.F. Fowle, P. Mathew, P.L.B. Oxley, Prediction of tool life in oblique machining with nose radius tools, Wear 198 (1996) 22–228. [31]G. Caprino, L. Santo, L. Nele, Interpretation of size effect in orthogonal machining of composite materials. Part I: unidirectional glass-fibre-reinforced
plastics, Composites Part A 29A (1998) 887–892.
[32]S.S. Joshi, N. Ramakrishnan, P. Ramakrishnan, Analysis of chip breaking during orthogonal machining of Al/SiCp composites, J. Mater. Process. Technol. 88 (1999) 90–96.
[33]W. Grzesik, Determination of temperature distribution in the cutting zone using hybrid analytical-FEM technique, Int. J. Mach. Tools Manuf. 46 (2006) 651–658.

![Fig. 3. (a) Cross-section, perpendicular at the cutting edge and detail of adhesion layer on tool flank wear and on tool crater [16]](https://thumb-eu.123doks.com/thumbv2/123doknet/12206752.316454/5.892.93.799.689.966/cross-section-perpendicular-cutting-adhesion-layer-flank-crater.webp)