Université de Montréal
Age and species related variation in the development of growth plates of the knee and implications for the locomotion of Australopithecus afarensis
Par Sophie Makarov
Département d’Anthropologie Faculté des Arts et Sciences
Mémoire présenté à la Faculté des Études Supérieures En vue de l’obtention du grade de M.Sc. en Anthropologie
Mars 2012
Université de Montréal Faculté des Études Supérieures
Ce mémoire intitulé :
Age and species related variation in the development of growth plates of the knee and implications for the locomotion of Australopithecus afarensis
Présenté par : Sophie Makarov
a été évalué(e) par un jury composé des personnes suivantes :
Isabelle Ribot président-rapporteur Michelle Drapeau directeur de recherche Ariane Burke membre du jury
Résumé
_______________________________________________________________
Comprendre l'évolution de la bipédie est un élément essentiel à la recherche en paléoanthropologie, car ce comportement est le trait le plus important utilisé pour identifier les fossiles comme appartenant à la lignée des hominines. La topographie de la surface infradiaphysaire du fémur et du tibia pourrait donner un aperçu du comportement locomoteur des espèces fossiles, mais n'a pas été étudiée de façon approfondie. Ce trait reflète directement les différences dans la locomotion, puisque la surface change de topographie pour mieux résister aux charges encourues par les mouvements réguliers. Le plan infradiaphysaire du fémur chez les humain est relativement plat, tandis que la surface est plus irrégulière chez les grands singes.
Dans ce projet, les métaphyses du genou ont été étudiées d’une manière quantifiée afin de percevoir les différences entre espèces et mieux comprendre le développement ontogénique de ces traits. Les angles formés par les protrusions et les creux de ces surfaces ont été mesurés à partir de points de repère enregistrés en trois-dimensions sur les
métaphyses du genou chez les humains, chimpanzés, gorilles, et orangs-outans, et chez trois fossiles Australopithecus afarensis, afin d’observer de l’effet de facteurs tel le stade de croissance et l’appartenance à une espèce sur la topographie des plaques de croissance du genou. Les angles d’obliquité du fémur et du tibia ont aussi été mesurés et analysés. Les résultats ont révélé que le stade développemental et l’appartenance à une espèce et, par association, le mode de locomotion, ont un effet significatif sur les métaphyses du genou. Il a également été constaté que les mesures d'Australopithecus afarensis chevauchent les valeurs trouvées chez les humains et chez les grands singes, ce qui suggère que cette espèce avait possiblement conservé une composante arboricole dans son comportement
locomoteur habituel.
Mots-clés
Bipédie, genou, angle d’obliquité, plaque de croissance, métaphyses, biomécanique, Australopithecus afarensis
Abstract
________________________________________________________________________________
Understanding the evolution of bipedality is a critical part of research in paleoanthropology, as it is the single-most important trait used to identify fossils as belonging to the hominin lineage. The topography of the infradiaphyseal plane could provide insight into the locomotor behaviour of fossil species, but has not been studied extensively. This trait directly reflects differences in locomotion, as the surface changes to resist loads incurred by regular movement. Humans have an infradiaphyseal plane that is relatively flat, while this feature is very convoluted in great apes.
This project studied this feature in the femur and tibia quantifiably to allow for statistical comparisons between species and to provide a better understanding of its
ontogenic development. Three-dimensional landmarks were recorded from the metaphyses of the knee in humans, chimpanzees, gorillas, orang-utans, and three Australopithecus afarensis fossils. Using these landmarks, angles formed by the salient points of these planes were analyzed to confirm observations that development and species have a significant effect on the topography of growth plates of the knee. Carrying angles of the femur and tibia were also measured and analyzed. Results revealed that development and species, and by extension, mode of locomotion, have a significant effect on the overall metaphyses of the knee, especially on the sagittal plane. It was also found that A. afarensis have values that overlap human and great ape ranges, suggesting this species had probably retained an arboreal component in its regular locomotion.
Key words
Bipedality, knee, obliquity angle, growth plates, metaphysis, biomechanics, Australopithecus afarensis
Table of Contents
________________________________________________________________________________
Résumé ... iii
Abstract ... iv
List of Tables... vii
List of Figures ... x
Acknowledgments ... xii
Chapter 1: Introduction ... 1
1.1. Skeletal biology ... 1
1.1.1. Ossification processes ... 1
1.2. The influence of the mechanical environment on bone modelling and remodelling .. 5
1.2.1. Initial research... 5
1.2.2. Current understandings ... 5
1.3. Bipedality and its influence on bone morphology ... 7
1.3.1 Ontogenic development of features associated with bipedality ... 7
1.3.2. Genetic features of the knee associated with bipedality ... 14
1.4. Palaeoanthropological context ... 17
1.5. Objectives ... 21
Chapter 2: Materials and Methods ... 23
2.1. Materials ... 23 2.2. Methods ... 24 2.2.1. Data Collection ... 24 2.2.2. Preparation ... 26 2.2.3. Analysis ... 29 Chapter 3: Results ... 32 3.1. Femur ... 32
3.1.1. Effect of development on the topography of the infradiaphyseal plane ... 32
3.1.2. Interspecies differences in the development of the infradiaphyseal plane ... 40
3.2. Tibia ... 47
3.2.1. Effect of development on the topography of the proximal metaphysis of the tibia ... 47
3.2.2. Interspecies differences in the development of the proximal metaphysis of the
tibia ... 54
Chapter 4: Discussion ... 61
4.1. Obliquity Angles ... 61
4.2. Metaphyseal surface topography ... 63
4.2.1. Effect of development on the topography of the metaphyses of the knee ... 63
4.2.2. Differences in the development of the metaphyseal topography among species 65 4.2.3 Australopithecus afarensis ... 70
4.3. Conclusions ... 70
List of Tables
________________________________________________________________________________ Table II.I: Sample size of the taxa included in the infradiaphyseal analyses and the
photographic femoral obliquity analysis ... 23
Table II.II.: Definition of the two axes between which angles were measured to quantify the morphology of the distal femoral infradiaphyseal plane ... 28
Table II.III.: Definition of the two axes between which the angles were measured to quantify the morphology of the proximal tibial infradiaphyseal plane. ... 29
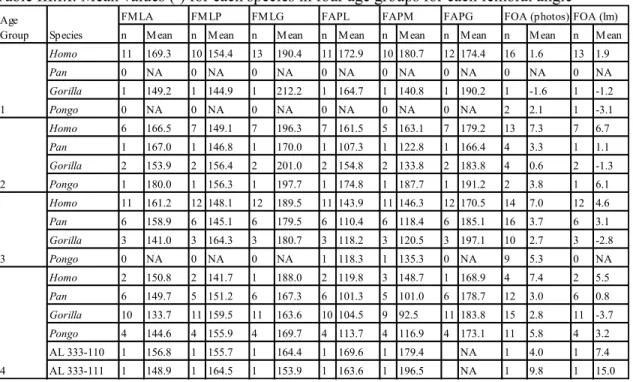
Table III.I.I: Mean values (º) for each species in four age groups for each femoral angle .. 32
Table III.I.II: Regression results for the angle FMLA ... 33
Table III.I.III. Regression results for angle FMLP ... 34
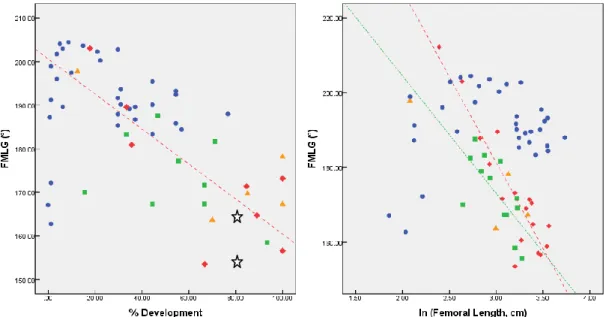
Table III.I.IV. Regression results for angle FMLG ... 35
Table III.I.V.: Regression results for angle FAPL ... 36
Table III.I.VI. Regression results for angle FAPM ... 37
Table III.I.VII. Regression results for angle FAPG ... 37
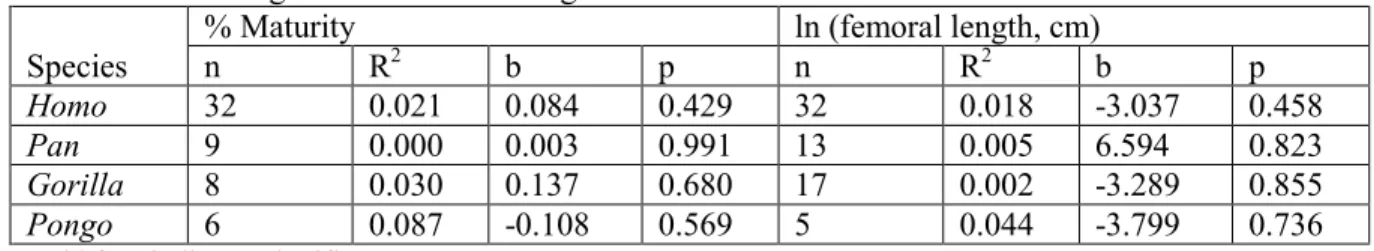
Table III.I.VIII. Regression results for Femoral Obliquity Angles measured from photographs... 38
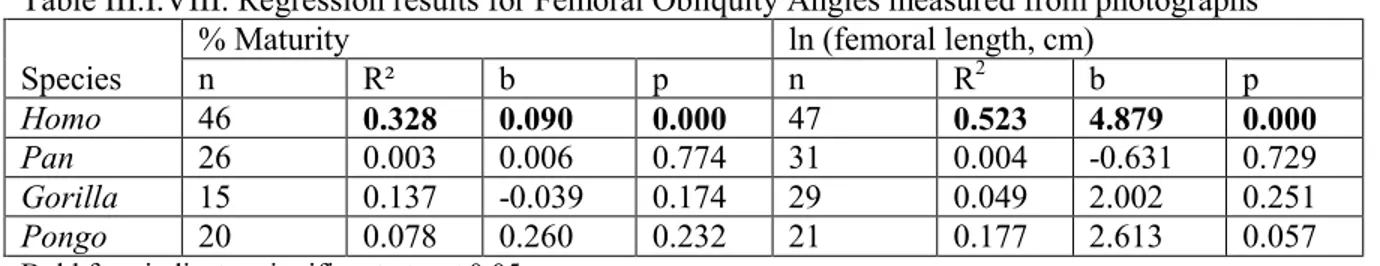
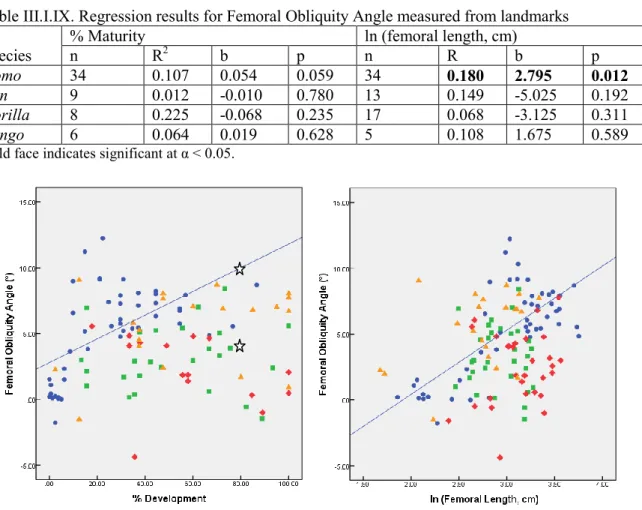
Table III.I.IX. Regression results for Femoral Obliquity Angle measured from landmarks 39 Table III.I.X.: Variance explained for the first two principal components of the analysis done on landmarks of the distal femoral metaphysis... 40
Table III.I.XI.: ANOVA results for metaphyseal landmarks of the distal femur ... 40
Table III.I.XII.: Bonferroni posthoc analysis results for metaphyseal landmarks of the distal femur ... 40
Table III.I.XIII: Variance explained for the first two principal components of the analysis done angles values of the distal femoral metaphysis ... 42
Table III.I.XIV: Correlation between femur angles and components ... 42
Table III.I.XV. ANOVA femur angles ... 42
Table III.I.XVI: Boneferroni post hoc analysis results for femur angles... 42
Table III.I.XVII. ANCOVA results for angle FMLA ... 43
Table III.I.XVIII: Bonferroni posthoc analysis results for angle FMLA vs % Maturity ... 43
Table III.I.XIX.: ANCOVA Results for FMLP ... 44
Table III.I.XXI.: ANCOVA results for angle FMLG ... 45
Table III.I.XXII.: Bonferroni posthoc analysis results for angle FMLG vs % Maturity ... 45
Table III.I.XXIII. ANCOVA results for FAPM ... 45
Table III.I.XXIV.: Bonferroni posthoc analysis results for angle FAPM ... 45
Table III.I.XXV.: Analysis of covariance results for the effect of species on the development of femoral obliquity ... 46
Table III.I.XXVI.: Bonferroni posthoc analysis result for femoral obliquity angle ... 46
Table III.II.I: Mean values (º) for each species in four age groups for each tibial angle ... 47
Table III.II.II. Regression results for angle TMLA ... 48
Table III.II.III.: Regression results for angle TMLC ... 48
Table III.II.IV.: Regression results for angle TMLP ... 49
Table III.II.V.: Regression results for angle TAPM ... 50
Table III.II.VI.: Regression results for angle TAPC ... 51
Table III.II.VII.: Regression results for angle TAPL ... 52
Table III.II.VIII.: Regression results for tibial obliquity angle ... 53
Table III.II.IX.: Variance explained for the first two principal components of the analysis done on landmarks of the proximal tibial metaphysis ... 54
Table III.II.X.: ANOVA results for metaphyseal landmarks of the proximal tibia ... 55
Table III.II.XI.: Bonferroni posthoc analysis of the metaphyseal landmarks of the proximal tibia ... 55
Table III.II.XII.: Variance explained for the first two principal components of the analysis done on angle values of the distal femoral metaphysis ... 56
Table III.II.XIII.: Correlation between components and tibia angles ... 56
Table III.II.XIV.: ANOVA for tibia angles ... 56
Table III.II.XV.: Boneferroni posthoc results for tibia angles ... 57
Table III.II.XVI.: ANCOVA results for angle TMLA... 57
Table III.II.XVII.: Bonferroni posthoc analysis results for angle TMLA ... 58
Table III.II.XVIII.: ANCOVA results for angle TMLC ... 58
Table III.II.XIX.: Bonferroni posthoc analysis results for TMLC ... 58
Table III.II.XX.: ANCOVA results for angle TMLP ... 59
Table III.II.XXI.: Bonferroni posthoc analysis results for angle TMLP ... 59
Table III.II.XXIII.: ANCOVA results for angle TAPL ... 60 Table III.II.XXV.: Bonferroni posthoc analysis results for the obliquity angle of the tibia 60 Table III.II.XXIV.: ANCOVA results for angle TOA ... 60
List of Figures
_________________________________________________________________________ Figure 1.1.: Diagram of a longitudinal section through the epiphyseal growth plate ... 3 Figure 1.2.: Sketch showing the intramembraneous ossification process of the parietal bone in a fetal cat. ... 4 Figure 1.3.: Various axes that can be used to measure the femoral obliquity angle. ... 8 Figure 1.5.: Inferior view of the distal femoral epiphysis of a pongid and human. ... 11 Figure 1.4.: Lateral view and inferior view of the distal femoral epiphysis of Pan
troglodytes, A. afarensis and Homo sapiens ... 11 Figure 1.6.: The distal metaphyseal surface of the femur in chimpanzees, humans, and A.
afarensis ... 12 Figure 2.1.: Diagram of landmarks used in this study. Distal view of the distal femoral
metaphysis and proximal view of proximal tibial metaphysis ... 25 Figure 2.2.: An example of the method used for measuring the femoral obliquity angle,
using the right femur of a juvenile Gorilla individual. ... 26 Figure 2.3.: Diagram of the right distal femoral metaphysis representing how the anterior
mediolateral angle was measured. ... 27 Figure 3.1.1: Linear regressions between the values for angle FMLA and the percentage of
development, and the natural logarithm of femoral length... 33 Figure 3.1.2.: Linear regressions between angle FMLP values and the percentage of
development, and the natural logarithm of femoral length... 34 Figure 3.1.3.: Linear regressions between angle FMLG values and the percentage of
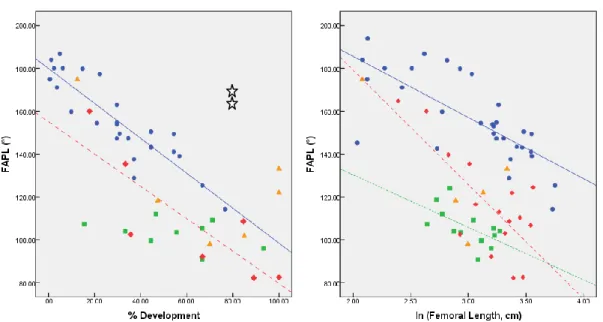
development, and the natural logarithm of femoral length... 35 Figure 3.1.4.: Linear regressions between angle FAPL values and the percentage of
development, and the natural logarithm of femoral length... 36 Figure 3.1.5.: Linear regressions between angle FAPM values and the percentage of
development, and the natural logarithm of femoral length... 37 Figure 3.1.6.: Linear regressions between angle FAPG values and the percentage of
development, and the natural logarithm of femoral length... 38 Figure 3.1.7.: Linear regressions between the femoral obliquity angle measured from
photographs and the percentage of development, and the natural logarithm of femoral length ... 39
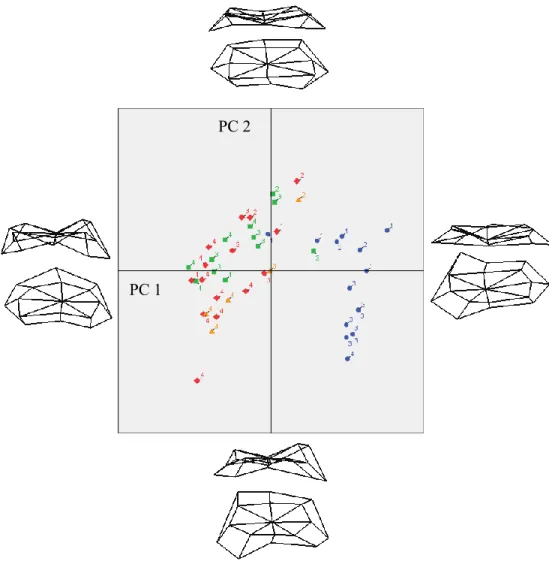
Figure 3.1.8.: Linear regressions between the femoral obliquity angle and the percentage of development, and the natural logarithm of femoral length. Angles measured digitally ... 39 Figure 3.1.9.: Principal Component Analyses scatter plot for metaphyseal landmarks of the
femur. ... 41 Figure 3.1.10.: Principal Component Analyses scatter plot for metaphyseal angles of the
femur ... 43 Figure 3.2.1.: Linear regressions between TMLA angle values and the percentage of
development and the natural logarithm of femoral length... 48 Figure 3.2.2.: Linear regressions between TMLC angle values and the percentage of
development and the natural logarithm of femoral length... 49 Figure 3.2.3.: Linear regressions between TMLP angle values the percentage of
development and the natural logarithm of femoral length... 50 Figure 3.2.4.: Linear regressions between TAPM angle values and the percentage of
development and the natural logarithm of femoral length... 51 Figure 3.2.5.: Linear regressions between TAPC angle values and the percentage of
development and the natural logarithm of femoral length... 52 Figure 3.2.6.: Linear regressions between TAPL angle values and the percentage of
development and the natural logarithm of femoral length... 53 Figure 3.2.7.: Linear regressions between the obliquity angle of the tibia and the percentage
of development and the natural logarithm of femoral length ... 54 Figure 3.2.8.: Principal Component Analysis scatter plot for metaphyseal landmarks of the
tibia ... 55 Figure 3.2.9.: Principal Component Analysis scatter plot of metaphyseal angle values of the tibia ... 57
Acknowledgments
________________________________________________________________________________
It is a pleasure to thank those who made this thesis possible. First and foremost, I offer my sincere gratitude to my research director, Dr. Michelle Drapeau. Her suggestions, advice and guidance were invaluable to the completion of this Master’s thesis. I also wish to thank members of the reviewing committee, Dr. Isabelle Ribot and Dr. Ariane Burke, for their comments and corrections.
I am also grateful to the institutions that have allowed me to study great ape and human collections for my research, namely the Smithsonian Museum of Natural History and Linda K. Gordon, the Cleveland Museum of Natural History and Lyman M. Jellema, and the Peabody Museum of Archaeology and Ethnology at Harvard University and Michèle Morgan and Olivia Herschensohn.
I acknowledge Sigma Xi, The Scientific Research Society, and their Grants-in-Aid of Research program, for the financial award that helped make this project possible.
The support of my student colleagues at the department was greatly
appreciated. Merci to Marine, who was a pleasure to travel with and was very helpful during data collecting, and merci to Emeline, for her encouragement and tips on thesis writing.
Thank you to Kevin for proofreading and keeping me motivated. Thank you to my friends Andrée, Chelsee, Jessika, Stéphanie and Tammy; their drive and passion for what they do is an inspiration. Finally, I wish to thank my parents, Andrej and Danielle, for their helpful comments and unconditional support.
Chapter 1: Introduction
_________________________________________________________________________ In paleoanthropology, fossils are key indicators of a particular species environment, physical activity, and even social behaviour. The shape of a skeletal element is genetically determined and best adapted to its habitual functions. Bone morphology can, in addition, also be plastic, especially during development. In particular, it is heavily influenced by its mechanical environment. Thus, many features of the skeleton directly reflect the regular activity for which it is used. One of the most significant features that is specific to the human lineage is bipedality. The anatomical traits that are associated with this behaviour are therefore helpful in determining if a new fossil belongs to this family or not. Since bone is shaped in part by its mechanical environment, bipedality leaves numerous indicators, particularly on the pelvis and lower limb bones. The purpose of this thesis is to examine the direct effects of locomotion on the knee joint and explore metrically the differences in morphology between humans, great apes, and hominids during ontogeny, or individual development.
1.1. Skeletal biology
Knowledge of bone composition and development is essential to understanding the relationship between mechanical factors and skeletal morphology. While inorganic calcium phosphate salts form the majority of bone, approximately forty percent of bone matrix is made of organic material – mostly collagen fibres (Standring 2005). This organic
component of bone is what makes it a living tissue, one that can actively react and adapt to external factors during development as well as after maturation.
1.1.1. Ossification processes
1.1.1.1. Endochondral Ossification
The majority of the postcranial skeleton is formed through endochondral
element. Cartilaginous tissue is composed of young chondrocytes which divide and secrete an extra cellular matrix of collagen fibers as they do so. This tissue will be replaced by bone through an ordered sequence of events (Standring 2005). Variation in bone
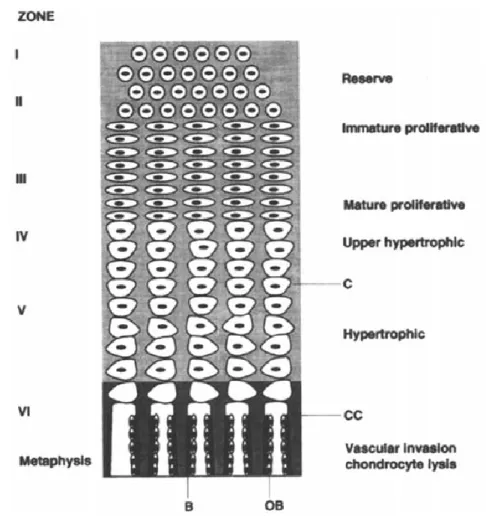
development depends on the type of skeletal element; long bones, such as the femur and tibia, have multiple centres of ossification. The centre of primary ossification is located in the centre of the shaft, where the ossification process is marked by the expansion in diameter of the diaphysis and its elongation at both ends of the shaft. The centres of secondary ossification are located at both ends of the shaft, where the process of fusion of the epiphyses to the diaphysis will begin when the bone approaches maturity (Standring 2005). All long bones have growth plates between the epiphysis and the diaphysis. These cartilaginous plates are of particular interest for this thesis. They are responsible for the longitudinal growth of long bones, and importantly, react to external loads in specific ways and can therefore alter the very formation and growth of bone. At a microscopic level, these epiphyseal plates can be divided into four zones. The activity at each zone will play a precise role in the axial growth of long bones until they reach maturity, when the epiphyses fuse to the diaphysis. The following is a brief summary of the different levels of the
epiphyseal plate following Cormack (1987).
The zone of resting cartilage is closest to the bony tissue of the epiphysis. The chondrocytes at this level are not contributing actively to bone growth, as their principal function is to connect the other levels of the growth plate to the bony epiphysis. Capillaries pass through this zone and allow oxygen and nutrients to travel to the epiphysis, and at the same time they also nourish all other zones of the epiphyseal plate. The zone of
proliferating cartilage, as the name suggests, is marked by very active chondrocytes that are constantly dividing to provide new chondrocytes to replace the ones that disappear on the diaphyseal side of the growth plate. As they multiply, they arrange themselves into columns in the zone of maturing cartilage, (also known as the zone of hypertrophying cartilage) where they increase in size and produce alkaline phosphatase, which is presumed to assist in the calcification of the extracellular matrix. The cartilage matrix becomes saturated with bone mineral in the zone of calcifying cartilage or the zone of provisional calcification. Capillaries enter this zone from the diaphysis and provide a vascularised
environment thereby favouring the deposition of bone matrix on the calcified cartilage (Fig. 1.1.)
1.1.1.2. Intramembraneous Ossification
The other ossification process is known as intramembraneous ossification, and is not preceded by cartilage, but rather by membrane tissue, as the name suggests.
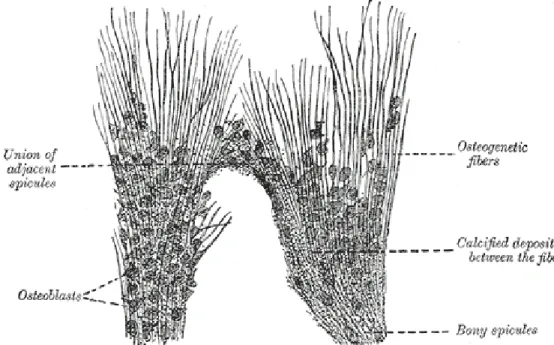
Intramembraneous ossification starts (Gray (2000 [1918])) with a membrane composed of a matrix of fibers and granular cells which stands in place of the future bone, and will
ultimately form the periosteum. The process begins with the formation of little bone spicules which radiate from a center of ossification. These “rays” consist of osteogenic fibers (precollagenous fibers formed by osteoblasts, cells responsible for bone formation), and granular corpuscles with an intervening ground substance. Calcareous granules are being deposited between the fibers and in the intervening matrix (Fig. 1.2.). The fibers
Figure 1.1.: Diagram of a longitudinal section through the epiphyseal growth plate. B = bone, OB = osteoblast, CC = calcified cartilage, C = cartilage matrix. From Waterlow (1994).
calcify as they grow out on the periphery, and in turn give rise to new bone spicules,
creating a network of bone containing blood vessels, connective tissue and osteoblasts. This bony trabecula thickens as more layers of bone are added upon it.
After it has reached maturity, bone is maintained throughout an adult’s life by a process of internal remodelling. Indeed, a cycle of bone resorption and bone formation prevents the bony tissue from weakening as some of the osteocytes die and microcracks form (Cormack 1987, p.305). A number of external factors, such as trauma and disease and mechanical loading, influence the formation of skeletal tissue during the modelling and remodelling cycles. The impact of mechanical stress on bone formation and properties will be explored next. The adaptability and resistance of bone to external factors, such as the regular exposure to mechanical loading, is dictated by its composition and by the process by which it develops (Carter 1987). The relationship between mechanical environment and skeletal morphology is bilateral, as the mechanical environment – movement and pressure – will influence the morphology of an element mostly as it develops and the shape of skeletal elements in turn dictates the range of movements that is possible and how much load they can resist.
Figure 1.2.: Sketch showing the intramembraneous ossification process of the parietal bone in a fetal cat. From Gray (2000 [1918]).
1.2. The influence of the mechanical environment on bone modelling and remodelling
1.2.1. Initial research
The link between bone morphology and mechanical factors has been known since the 19th century, when German anatomist Julius Wolff suggested that bones will remodel to adapt to their mechanical function. Wolff’s Law of Bone Remodelling states that that a bone’s internal structure will alter according to mathematical rules to adapt to the external stresses to which it is exposed; similarly, secondary morphological alterations throughout an adult’s life will follow these same rules. Therefore, according to this law, the precise shape of a skeletal element could be predicted depending on the mechanical loads that are applied to it (Wolff 1986).
Nineteenth century research on the relationship between bone remodelling and mechanical stress was also advanced by the development of Heuter and Volkmann’s Law. These two German researchers have suggested that pressure influenced the cellular
proliferation of the epiphyseal plate. This law states that compressive forces decreased plate growth while tensile forces would increase it. In other words, an increase in pressure will hinder the growth at the epiphyseal plates and a decrease in pressure will lead to an acceleration of their growth (Hert 1969). This initial work on the relationship between skeletal morphology and mechanical stress has prompted more recent authors to theorize on the mechanism by which growth plates react to outside forces.
1.2.2. Current understandings
Wolff’s Law concerning the relationship between skeletal morphology and mechanical environment, while an insightful idea at the time, cannot account for all instances of bone modelling, such as, for example, the modelling observed when bone fractures heal (Lovejoy et al. 2003). The mechanism by which stress affects a growth plate’s cellular activity still remains poorly understood. Nevertheless, the factors
contributing to, or inhibiting cartilage growth and chondro-osseous activity, are now better known. These include the activity of adjacent tissue, nutrients, hormones, vascularity, and of course stress caused by mechanical loading (Carter 1987). Loading comes from many sources: muscle forces, body weight, and acceleration and deceleration of the body mass (Frost 1997). The many influences acting on bone modelling further confirm how complex this relationship is and ultimately, how difficult it is to describe in precise mathematical terms how bone will react to mechanical influences.
As mentioned previously, the growth plate, or the metaphysis, is the area of the long bone that is of central interest to this research project. Shear or deviatory and compressive hydrostatic stresses may not only slow or stop, but conversely, can also stimulate the cartilaginous activity at the growth plate level that was described above – proliferation, maturation, degeneration and ossification (Carter 1987). Experiments have allowed researchers to further understand the cause-effect relationship of bone growth and mechanical stress. Frost (1997) has determined that increased compression loads corresponds to increased growth up to a certain limit. Past this limit, any increase in compression will correspond to a deceleration in bone growth, and large enough
compression loads will eventually stop growth activity. Carter et al. (1998) found that high shear stresses also act similarly, accelerating growth and ossification up to a limit, but suggest that compressive hydrostatic stresses reduce growth rate and maintain the cartilage shape when applied intermittently. Furthermore, it has been posited that if the pressure is unequal across the growth plate, then its growth will be uneven in length (Pauwels 1980), which is consistent with the relationship between compression and growth described above. The orientation of the growth plates is another response of the bone, during growth, to the potentially damaging effects of mechanical stresses. Growth plates will lie perpendicularly to the direction of the joint force caused by the principal compressive and tensile stresses acting on this plate, which minimizes shear forces across the plates and reduces risk of injury to the sutures (Carter et al. 1987; Preuschoft and Tardieu 1996; Smith 1962a; Smith 1962b). Cusps and facets on this plate may also develop in order to resist the large shearing forces acting on the same joint (Preuschoft and Tardieu 1996).
In short, the main biomechanical concept on which this thesis is based is that endochondral ossification directly responds to mechanical stresses or forces. Differential forces on the joint, such as those resulting from different locomotion, will induce
differential apposition on a histological level, and this will ultimately result in the variable morphology seen on an individual’s limb bones.
1.3. Bipedality and its influence on bone morphology
1.3.1 Ontogenic development of features associated with bipedality
Bipedal locomotion produces different types of mechanical loads, the influence of which is visible in the morphology of lower limb bones. Because bipedality is rather specialized, movement of the knee is limited, and in turn the directions of mechanical loading on the femur are rather standardized. Because of that, the relationship between pressure and femoral development in humans, albeit complex, is better understood than in great apes, whose knee allows for movement in more directions, and therefore have knee joints that are subjected to many loads from less standardized directions (Tardieu and Preuschoft 1996). The development of bipedality, with the trunk upright, results in a centre of gravity shifted backwards, creating the need for more even distribution of anterior and posterior mass (Jaanusson 1991). Along with movement, the positional requirements of bipedality also induce morphology-altering forces. Bipedality requires the knee to be placed under the center of gravity. In addition, the knee joint needs its axis of flexion to be
horizontal for stability as well as for habitual full knee extension (Tardieu 1999; Tardieu and Damsin 1997). The ability to fully extend the knee favours a longer stride, thereby increasing the efficiency of this type of locomotion (Tardieu et al. 2006). The loads due to body weight, gravity and acceleration and deceleration and incurred during locomotion and during stationary placement of the knee are associated with a series of developmental and genetic traits of the distal femur that are related to bipedality; these include, but are not limited to: a bicondylar angle of 8 to 11 degrees, a protuberant lateral troclear lip, and an elliptical lateral profile of the external condyle (Tardieu 1981; Tardieu 1983; Tardieu 1998). This section is devoted to describing each feature brought about by the ontogenic
development of locomotion and explaining their functional adaptation. The homologous anatomy found in the tibio-femoral joint of great apes will also be discussed, as anatomical comparisons will provide some insight into the locomotor behaviour of extinct hominid species such as Australopithecus afarensis. The focus will be on the infradiaphyseal plane of the distal femur – the area where the diaphysis comes into contact with the epiphysis before fusion – a trait on which little work has been done.
1.3.1.1. Femoral obliquity angle
The femoral obliquity angle, also referred to as the diaphyseal angle or bicondylar angle, is the most significant marker of bipedality. It is the angle between the axis
perpendicular to the plane on which lie the two condyles in adults or the metaphysis in juveniles, and the axis of the femoral diaphysis (Fig. 1.3.). Its formation has
consequences on the morphology of the distal femoral epiphysis, which displays traits that are functionally associated with the obliquity of the femur. The development of the femoral obliquity angle arises from the need to keep the knee below the centre of gravity during the single stance phase, in spite of the large interacetabular distance – the distance between the two femoral joints of the pelvis – of humans (Tardieu 2010). Indeed, it allows the knee to be placed below the center of gravity while facilitating flexion and extension of the knee in the parasagittal plane (Tardieu 1999; Tardieu and Damsin 1997). A horizontal Figure 1.3.: Various axes that can be used to measure the
femoral obliquity angle. From Heiple and Lovejoy (1971).
mediolateral metaphyseal and infracondylar plane will also minimize the shear stress that will be applied on the joint (Tardieu and Trinkaus 1994).
Posture and locomotion affect the development of the femoral obliquity angle occurs through differential apposition of bony tissue at the mediolateral metaphyseal level: there is additional medial metaphyseal apposition compared to the lateral side (Tardieu 2010). In essence, the placement of the knee joint in a valgus position, underneath the centre of gravity and close to the ground reaction force, applies just enough pressure on the medial portion of the cartilage growth plate to stimulate metaphyseal apposition on the medial side of the plate, which in turn creates the obliquity angle (Preuschoft and Tardieu 1996; Tardieu and Damsin 1997; Tardieu and Trinkaus 1994). However, the medial portion of the growth plate is not the area subjected to the most pressure. In fact, a greater amount of pressure is applied to the lateral side (Tardieu et al. 2006), but as mentioned earlier, excessive pressure can slow or even interrupt growth. This is why we observe differential apposition at the medial and lateral level of the growth plate. The increased pressure on the lateral side is in all probability decreasing the activity level of the growth plate.
The emergence of the femoral obliquity angle in humans, and the manner in which it develops, depend on the pattern of biomechanical loading that is representative of normal development of posture and locomotion in that species (Tardieu and Damsin 1997).
Because it is a physiological phenomenon, the development of the femoral obliquity angle should parallel the development of normal bipedal walking in children. This is what is observed in human juveniles. The femoral angle is of 0° in foetuses and newborns, and for the first year of life. It starts to steadily increase during the second and third year of life which corresponds to the age at which children acquire bipedal walking, and reaches low adult values between four to eight years of age (Tardieu and Damsin 1997; Tardieu and Trinkaus 1994). Moreover, radiographic records of individuals that could not walk due to handicaps do not display an obliquity angle: an individual who learned to walk at the age of 12 had a 0° obliquity angle, while one who learned to walk using a walker at the age of six showed a bicondylar angle of 1.5° a year later (Tardieu and Trinkaus 1994). This further confirms that the femoral obliquity angle is a physiological trait. The angle of obliquity of the femur also modifies the relative provision of the proximal portion of the femur: the
greater trochanteric apophysis remains stationary relative to the proximal femur during growth because of associated muscle groups, but its orientation changes relative to the femoral diaphysis as the latter becomes oblique (Duren and Ward 1995). Tardieu (1994) has found that the development of femoral obliquity is not strictly correlated with
children’s ages, which suggests that the angle depends on other growth parameters that are associated with the development of the femur, such as interacetabular distance or
lengthening of the femoral neck. Still, there is a visible trend of gradual increase in angle values in children who are at the age where they normally learn to walk bipedally.
This pattern is quite different from that observed in juvenile great apes. When testing for a correlation between diaphyseal length and bicondylar or diaphyseal angle in great apes, Tardieu and Preuschoft (1996) found that the development of such angles was highly irregular and that there was no apparent relation between the two variables. When a bicondylar angle was present in older juveniles, these authors have found it was caused by differential height in the medial and lateral femoral condyles. We know that the femoral obliquity angle in humans is a diaphyseal trait because the two condyles are of
approximately equal height (Tardieu 2010). Thus, the angle occasionally found in apes is not a true femoral obliquity angle. This lack of correlation is expected as great apes’ modes of locomotion are strikingly different and much more varied than the upright bipedality of humans. Indeed, knuckle-walking and arboreality require the knee joint to be more flexible and to be placed in various positions rather than just under the center of gravity as in humans. Also, during the few instances when great apes engage in bipedal locomotion, it is done with bent knees and bent hips, and the knee finds itself constantly flexed in an
abducted position as opposed to adducted, which results in an unstable stance (Lovejoy 2007; Tardieu 1997; Tardieu 1998; Tardieu and Damsin 1997). In some species, this trait also has genetic limitations. It was shown that, in an experiment where Japanese macaques were trained to walk bipedally, they never developed a femoral obliquity angle: the
diaphysis remained straight (Hayama et al. 1992). It has been suggested that the bicondylar angle measurement method, which involves placing the femur vertically on a flat surface as a plane of reference, corresponds to the natural position of the femur in humans (Lovejoy 2007). This may further explain why patterns of femoral obliquity angles are not observed in great apes. Indeed, the natural, or most usual position, of the femur in great apes is not
vertical, but rather should be angled posteriorly as in a bend-knee posture, and therefore using the bicondylar or metaphyseal plane as a base axis might be yielding incorrect results. It is necessary to re-evaluate the definition of femoral obliquity angle for chimpanzees, gorillas and orang-utans, as this would allow for the development of a measurement method that is more appropriate for the usual stance of each species.
1.3.1.2. Flattening of the distal femoral epiphysis
The distal epiphysis of the femur undergoes several morphological changes that are a functional response to the development of the femoral obliquity angle in humans.
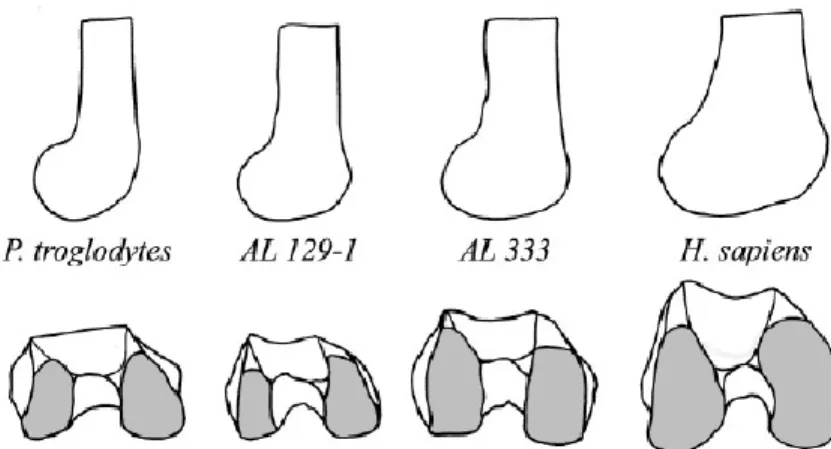
Distally, the epiphysis is elongated antero-posteriorly, to the point where it has a more squarish shape while in pongids the inferior aspect of the epiphysis is more rectangular (Fig. 1.5.;Tardieu 1981; Tardieu 1997). In side view, the profile of the femoral condyles
will become elliptical because of this elongation (Fig. 1.4. and1.5.). The lateral condyle will be flatter and longer since bipedal locomotion applies more pressure to this side of the distal femur. The flattening of the epiphysis creates a larger area of contact between the femur and the tibia; this
increases the area on which the load passing through the knee joint during full extention is distributed and therefore reduces high strains that could damage the articular cartilage (Aiello and Dean 1990; Heiple and Lovejoy 1971; Lovejoy 2007; Tardieu 1981). Figure 1.5.: Inferior view of the distal femoral epiphysis of a
pongid (left) and human (right). After (Tardieu 1983). Figure 1.4.: Lateral view and inferior view of the right distal femoral epiphysis of Pan troglodytes, two A. afarensis fossils, and Homo sapiens. From Ward (2002) .
Specifically, it means that humans experience a greater area of cartilage contact during the last 20 degrees of extension, which reduces strain from ground reaction forces and body weight, and in turn prevents early breakdown of the cartilage of the knee (Heiple and Lovejoy 1971; Lovejoy 2007). The large area of contact thus develops as a response to habitual full knee extension during walking or standing. This feature develops in
association with the development of the obliquity angle; the lateral pillar will extend more anteroposteriorly than the medial one, because it is the lateral condyle that bears the most weight during the stance and gait portion of walking due to the femoral obliquity angle (Heiple and Lovejoy 1971; Tardieu et al. 2006).
The distal femoral epiphyses of great apes are not anteroposteriorly elongated as those of humans. They display a lateral condyle that is more circular and not elliptical when viewed laterally (Tardieu 1997; Tardieu 1998). This morphology is not adapted to the increased weight bearing that occurs during full extension of the knee, as it is in humans, which explains, in part, the unstable bent-knee bent-hip stance great apes assume during bipedal episodes (Heiple and Lovejoy 1971). In fact, mediolateral lengthening and circular condyles are traits that are best suited for a mobile knee joint (Tardieu 1998).
1.3.1.3. Area of contact between diaphysis and distal epiphysis
The infradiaphyseal plane is a feature that is subject to much influence from mechanical loading as it is the region directly adjacent to the growth plate. It is a trait on which little research has been done, and therefore it is still relatively absent from the current literature, yet it is probably the one trait of the knee joint that provides a direct demonstration of the effects of pressure on the growth plate and on the development of the femur. As previously mentioned, the growth plate adjusts its orientation such that it lies perpendicularly to the combined forces acting on it. In humans, the infradiaphyseal plane is relatively flat throughout
childhood and youth. Because the ground reaction force and the force generated by body
weight do not deviate much Figure 1.6.: The distal metaphyseal surface of the femur in chimpanzees (far left), humans (middle), and A.
from the tibial and femoral long axes, this flatness allows the growth plate to lie
perpendicularly to these forces (Preuschoft and Tardieu 1996). The simple fitting of the diaphysis into the epiphysis is likely to be related to the limited repertoire of movements in relation to gravity that humans exhibit; bipedal running, walking and jumping mean that the knee joint, when loaded, is extended most of the time, and that it is exposed to high
compressive force and very little shear stress, leaving the infradiaphyseal plane relatively flat, with only a few low cusps to resist the minimal shearing loads (Preuschoft and Tardieu 1996; Tardieu and Preuschoft 1996).
The infradiaphyseal plane of great ape femora is very different (Fig. 1.6.). It is highly convoluted, with deep mediolateral and anteroposterior grooves creating a very irregular surface (Tardieu and Preuschoft 1996). This creates a very tight fit between the epiphysis and the diaphysis. In the same way that the flat infradiaphyseal plane reflects bipedal locomotion in humans, the irregular plane and the tight fit with the epiphysis are direct femoral responses to great ape locomotor behaviour. Great apes use their hind limbs in various positions during arboreal activity. The tight fit of the diaphysis into the epiphysis could serve to prevent separation by resisting loads and shearing forces that come from all directions (Tardieu and Preuschoft 1996). The many different movements result in forces that have more variable directions, which largely deviate from the long axis of the femur; the many different facets allow the growth plate to resist forces coming from various directions, minimizing shearing forces across the entire surface (Preuschoft and Tardieu 1996). The irregularity of this surface is perhaps what makes it difficult to obtain consistent values when measuring diaphyseal angles, because its development is probably dissimilar to the development of the infradiaphyseal plane in humans, which remains mostly flat until fusion (Tardieu and Preuschoft 1996). Knowing how the surface develops in apes should allow researchers to identify a plane of reference that remains consistent throughout growth and therefore, which would permit more precise measurement and thus more meaningful values of femoral obliquity angles in those species.
1.3.1.4. Proximal Tibia
While the femur undergoes the most changes as a result of bipedality, the tibia also displays morphological characteristics that are indicative of bipedal locomotion. As the proximal femoral joint is horizontal, we can reasonably expect the tibial plateau to be horizontal as well. Because the ankle also needs to be directly below the center of gravity, an obliquity angle of the tibia is not observed in humans. Because knuckle-walkers take a bent-knee bent-hip stance when walking bipedally, the ankle is located medially relative to the knee joint, meaning the tibia in chimpanzees and gorillas should show an obliquity angle.
The topography of the tibial plateau, however, is indicative of the mode of locomotion. In humans, the medial portion of the plateau is slightly concave, which
increases the area of contact between it and the medial femoral condyle (Javois et al. 2009). This increases knee stability during full extension and minimizes stress. In contrast, the lateral portion of the tibial plateau in great apes is more convex, reducing the area of contact with the lateral femoral condyles and increasing mobility of the knee joint. However, it was found that there is some significant overlap in the degree of curvature of the lateral tibial condyle between humans and great apes (Javois et al. 2009). Fossil data is similar to great apes but also falls within the human range. This lack of distinction in the morphology of the lateral tibial condyle between species with different locomotor
behaviour suggests that this trait is not suitable for reconstruction of mode of locomotion in fossil hominid species (Organ and Ward 2006).
1.3.2. Genetic features of the knee associated with bipedality
1.3.2.1. Genetic traits of the femur
The distal end of the femur in humans is also marked by an anterior trochlear groove, with an elevated lip on the lateral side. While the elevation of the lateral trochlear lip and the deepening of the trochlear groove are associated with a bipedal gait, they are traits, unlike the previously mentioned features, that are already present in foetuses, and
therefore appear to be genetically determined. There is no correlation between the degree of femoral obliquity and the degree of projection of the lateral lip, supporting the hypothesis that a high lateral trochlear lip and trochlear groove do not develop through the same process as the bicondylar angle and the flattening of the epiphysis; instead of resulting from developmental plasticity, the two trochlear traits appear to be determined genetically
(Tardieu et al. 2006).
Despite the lack of correlation between a bicondylar or metaphyseal angle and the elevation of the lateral trochlear lip, the latter must have been genetically selected because of femoral obliquity. The angle resulting from the position of the knee - under the centre of gravity - inflicts a high lateral force vector on the patella. The quadriceps femoris muscle, which attach to the patella, pull it laterally and tends to dislocate it when contracting (Preuschoft and Tardieu 1996). The lateral lip prevents this lateral pull from dislocating the patella during extension of the knee and the deep trochlear groove also provides more mediolateral stability (Heiple and Lovejoy 1971; Preuschoft and Tardieu 1996; Tardieu 1981; Tardieu et al. 2006). Similarly, horses, for instance, possess very deep trochlear grooves which permit very rapid flexion and extension motion, but only in the parasagital plane, while bears display a flat trochlea and therefore a knee joint that has little movement restrictions (Tardieu 1981). As such, a flat trochlea is also a feature of pongids’ femora which allows for a repertoire of varied motion for tree-dwellers or knuckle-walkers, as the patella is less constrained in its movements (Heiple and Lovejoy 1971; Tardieu 1997; Tardieu 1998).
1.3.2.2. Genetic traits of the tibia
Non-skeletal traits designed to protect the knee joint from damage caused by muscle forces are also present at the proximal tibial epiphysis, namely, the lateral meniscal shape and insertions. Menisci are pieces of cartilaginous tissue in the knee that serve to prevent friction and disperse the weight load from the point at which the femoral condyles and the tibial plateau come into contact (Standring 2005). This “soft-tissue” trait leaves insertion marks on the tibial plateau, which allowed researchers to evaluate the presence of this trait in fossil species. The results suggest that the shape and number of insertions is likely a
genetically determined trait (Tardieu 2010). In humans, the lateral meniscus is in the form of a crescent and inserts in two places, leaving two visible insertion points on the tibial plateau. This double insertion, unique among mammals, restricts mobility of the lateral meniscus which prevents it to move forward excessively during full extension; it provides more stability which is necessary for regular full extensions of the knee joint as we see in bipedality (Javois et al. 2009; Tardieu 1988; Tardieu 1999). Non-human primates exhibit varied lateral menisci shapes, but the lateral menisci is always marked by a single insertion point, which is, again, a marker of a more mobile knee joint. Another interesting effect of bipedality on the tibia is the width of the tibial spine, linked to the width of the
intercondylar notch. These two values are similar in humans, creating a tight fit which provides more stability to the knee, again at the expense of mobility (Tardieu 1981).
1.3.3. Summary of biological context
The effects of mechanical pressure brought about by bipedality on skeletal
development have been described, and it can be concluded that a growth plate’s activity is influenced by both the magnitude of the forces acting on it as well as by their orientation. In the lower limbs of humans, positioning of the knee under the center of gravity sets in
motion the development of traits such as the remodelling of the carrying angle, the
anteroposterior elongation of the distal femoral epiphysis in inferior view, and development of the elliptical profile of the lateral femoral condyles. Additionally, this posture in our ancestors also triggered selection for genetic traits of the knee joint, such as a double meniscal insertions and a deep trochlea with a prominent lateral lip. Mechanical loading also creates forces that modify the appearance of the infradiaphyseal plane of the femur, maintaining it much flatter than in non-human primates. The emergence of all these characteristics in the palaeoanthropological record should reflect an increasing use of full extension of the knee joint in our ancestors.
1.4. Palaeoanthropological context
Anatomical comparisons of the knee joints in humans and great apes allow researchers to infer locomotor behaviour from the remains of fossil hominids. Some contextual information on A. afarensis is necessary because this thesis is devoted to comparing the anatomy of certain traits of the knee in humans, gorillas, chimpanzees, orang-utans with that of this species, one of the earliest known hominids. Additionally, since ontological development of knee traits related to bipedality is the main focus of this project, an assessment of growth patterns in humans, great apes and A. afarensis is also essential.
1.4.1. Australopithecus afarensis: dates, environment, morphology
If Australopithecus afarensis is a famous species in the popular scientific literature, it is for good reasons. The large quantity of fossils – more than 300 hominin specimens and countless animal fossils– discovered in Eastern Africa since the 1970’s have yielded a great deal of information about the environment in which that species evolved, as well as
provided clues to their diet, social behaviour, and cognitive ability. The following is a brief description of A. afarensis anatomy and environment after (Boyd and Silk 2003). Their crania showed ape-like traits: a prognathic lower face, and an endocranial capacity of less than 500 cc, which is not too different from that of modern chimpanzees. Also, their bodies were shorter, and their arms were long with curved fingers. They were strongly sexually dimorphic. Their jaws and teeth, however, presented features that place them between great apes and humans; namely, we see little sexual dimorphism in the canines, which were smaller, and their jaw is marked by a V-shaped dental arcade. The fossils date from 3.9 to 2.9 million years, and their location suggests that A. afarensis lived in different types of environment, ranging from woodland, scrubs and grasslands such as at Hadar, to dry
grasslands such as in Laetoli. The fact that this species has survived for close to one million years suggests that the mix of ape-like and human-like physical attributes allowed them to successfully adapt to a range of different environmental conditions.
1.4.2. Locomotion information and debate
Because so many Australopithecus afarensis fossils have been discovered compared to other hominid species, a great deal of skeletal and biomechanical information has been extracted by researchers. While fossils are often incomplete, there is enough material to make realistic inferences, but because it is an extinct species with its unique morphology, uncertainties about its locomotion remain. Thus, researchers still debate whether this species was completely bipedal, bipedal with some degree of arboreality, or arboreal with some degree of bipedality. Many skeletal traits are involved in those discussions but the following is an overview of the debate with focus on the lower limb traits in A. afarensis that provide clues on their behaviour.
At one extreme lies the argument that A. afarensis was a palmigrade-plantigrade quadruped, putting the whole hand and foot upon the ground when walking (Sarmiento 1998). However, there are very few supporters of this hypothesis (Ward 2002). The two following hypotheses have many proponents and both sides agree that the bipedality of A. afarensis is undeniable. One position proposes that A. afarensis was bipedal in conjunction with arboreal activity, while the other suggests that A. afarensis was exclusively bipedal. Some features of the lower limb bones in A. afarensis are not consistent with a human-like bipedality and therefore have lead some researchers to doubt the idea that the members of this species were exclusively bipedal. For instance, the tibia only presents one lateral meniscal insertion, not two as in humans (Javois et al. 2009; Tardieu 1999). Other traits, like curvature of the toe bones, or the retention of brachiation traits in the upper limbs are also use as evidence for the assertion that A. afarensis regularly climbed trees (Prost 1980; Stern and Susman 1983; Susman et al. 1984). Supporters of this theory operate under the assertion that the retention of primitive, ape-like features in A. afarensis was a functional adaptation (Ward 2002).
For others, A. afarensis was fully bipedal, and rarely engaged in arboreality. The total morphological pattern seen in A. afarensis is so indicative of bipedality that some authors speak of a directional vector of natural selection moving away from traits
pelvis, femur and tibia (Latimer 1991; Ward 2002). The pelvis of A. afarensis is quite similar to that of humans: the ilia have rotated in a more sagittal plane to accommodate a fully upright posture, and they show attachment points for the abductor muscles, muscles which stabilize the pelvis during walking (Lovejoy 1988). The femoral obliquity angle found in a number of fossils of this species gave values ranging in the upper limits of those of modern human, even in younger individuals (Lovejoy and Heiple 1970; Tardieu and Trinkaus 1994). For instance, two well known juvenile specimens, AL 333-110 and AL 333-111, already present a diaphyseal angle of 6 and 11 degrees respectively, while adult values for australopithecines exceed that of humans (Lovejoy 2007; Tardieu and Preuschoft 1996). The high values, which are dependent on the large interacetabular distance on the pelvis, allow the knee to be placed under the center of gravity during the single support phase of gait in spite of the wider pelvis in A. afarensis (Heiple and Lovejoy 1971; Lovejoy and Heiple 1970; Tardieu 2010). This has been interpreted by many as proof that A.
afarensis individuals practiced bipedal walking, a new behavioural trait, from an early age, doing so frequently enough that the trait appears early in their development, since we know that the femoral obliquity angle is a developmental, epigenetic trait (Preuschoft and Tardieu 1996; Tardieu 2010). The presence of a human-like obliquity angle on the femur is also evidence against A. afarensis having retained a certain degree of arboreality, for a high knee valgus would have induced shear forces high enough to cause injury during arboreal activities (Lovejoy 2007). In fact, the high femoral obliquity angle of Australopithecus afarensis is such a solid proof of bipedality that it is the predominant feature that has allowed them to be included in the human lineage (Tardieu and Damsin 1997).
As in humans, it is hypothesized that the presence of a femoral obliquity angle in A. afarensis triggers the appearance of its associated traits. In fact, the distal femoral epiphysis of A. afarensis is similar in morphology to that of humans. The lateral condyles are
flattened and display an elliptical profile and, in distal view, also present a slight
anteroposterior elongation, a shape that appears to be intermediate between humans and chimpanzees (Fig. 1.4.); this would have allowed for efficient force transfer during full extension of the knee during bipedal gait (Heiple and Lovejoy 1971). Furthermore, the deep trochlear groove seen in humans is also found in A. afarensis femora along with a slightly elevated lateral lip. The presence of these genetic traits suggests that they are the result of
selection for patellar stability on the mediolateral plane during full knee extension, a safety feature associated with the carrying angle and bipedality in humans (Heiple and Lovejoy 1971). The distal femoral infradiaphyseal planes of juvenile specimens AL 333-110 and AL 333-111 are also similar to what is observed in human juveniles. The surface in both great apes and humans is marked by four cusps, where their elevation creates grooves in between them, one running mediolaterally and the other anteroposteriorly (Fig. 1.6). Great apes, as we have seen, have a more convoluted growth plate surface, with highly elevated cusps and deep grooves, while humans exhibit only very low cusps. In the fossil specimens, the mediolateral and anteroposterior grooves appear to be shallow, and the cusps only slightly elevated, giving the surface an overall flat and horizontal appearance (Preuschoft and Tardieu 1996). This suggests that the growth plates were subjected to more or less vertical loads which are associated with a fully extended posture. This further suggests that they are not adapted to resist large loads coming from any other direction, as it is inferred for
arboreal locomotion in apes. However, the morphology of the femur of A. afarensis is mostly described qualitatively. Quantified measurements of the infradiaphyseal surface of the femur will be useful for comparison between species, and may provide more insight as to whether A. afarensis is really closer to humans in terms of femoral morphology.
1.4.3. Growth patterns
To provide accurate comparisons of the development of knee traits linked to
locomotion between humans, great apes and australopithecines, it is essential to understand the differences in growth rate between these species. Humans and great apes do not mature at the same rate: both sexual and osteological maturation take about five to seven years longer to occur in humans (Tardieu 1997). This is seen in the fusion of femoral epiphyses: they fuse at the age of 16-18 years in humans and at 11-12 years in chimpanzees (Tardieu 1997). Therefore, the appearance of a particular feature at the age of three, for example, has different ontological implications in each species. Humans also differ from the great apes in that they go through a short period of very rapid growth, referred to as the “adolescent growth spurt”. During this period, which occurs relatively late in chronological age, the femur grows rapidly and develops further the epiphyseal traits that are associated with the bicondylar angle (Tardieu 1998). In australopithecine juveniles, the patterns and rates of
dental growth, patterns of facial growth, short hind-limbs, and ape-like growth of the pelvis are all indicative of a short growth period in childhood and in adolescence more similar to that of chimpanzees (Tardieu 1997; Tardieu 1998). So, even though Australopithecus afarensis fossils present some very human-like characteristics, especially in the post-cranial skeleton, they still retain many features which suggest they had a short, ape-like growth.
1.5. Objectives
The biomechanical, palaeoanthropological and ontological information provided in this chapter raises many interesting issues, one of which relates to the development of bipedality in Australopithecus afarensis. While the development of the knee joint is well known in humans, there is a lack of quantifiable data from great ape species, and even less from fossil species. As mentioned earlier, one problem when it comes to the measurement of the femoral obliquity angle, for example, is the absence of a proper method to measure it on great ape femora, since the shape and most likely the development of the metaphyseal plane differs greatly from what is observed on human elements. If hard data was available on the development of the infradiaphyseal plane, accurate comparisons could be made between human and great ape femora at different growth stages, and those comparative methods could be applied to the fossils of A. afarensis juveniles. The purpose of this thesis is therefore to test a 3D measurement method on the metaphyseal plane of the distal femora and proximal tibiae of humans, great apes, and A. afarensis fossils of different ages, with the objective of obtaining quantifiable data regarding the development of tibial and femoral knee growth plates, and use these data to evaluate the morphology and development
of bipedality in Australopithecus afarensis.
In light of the current data on the development and locomotor behaviour of A. afarensis, the hypotheses to be tested through this project are as follows:
1. The distal femoral metaphyseal topography should change in parallel with the acquisition of locomotion. This means in humans, we should see a development of slight cusps and grooves in response to the minor shearing forces associated with bipedality. The topography should remain nearly flat, however, since there are never
much transverse loads. In chimpanzees, gorillas and orang-utans, we should expect the development of more pronounced facets and a more convoluted surface in response to the development of the individual, as these three species have modes of locomotion which, albeit different, apply loads coming from many different
directions. This hypothesis opposes the null one, which is that there is no significant effect of age or development on the topography of the metaphyses of the knee. 2. The pattern and rates at which the topography develops differs depending on the
species, or primary mode of locomotion. The null hypothesis would see no significant effect of species on the development of the topography of the metaphyses.
3. If A. afarensis was exclusively bipedal and had abandoned arboreal locomotion, the distal femoral metaphysis of A. afarensis juveniles will remain similar to that of humans, that is relatively even, with low cusps to resist minor shearing forces.
Chapter 2: Materials and Methods
_________________________________________________________________________
2.1. Materials
The comparative data consists of human and great ape juveniles at different stages of development. A total of 138 individuals were examined. The human sample consisted of individuals aged 0 to 18 years from the Mistihalj archaeological collection curated by the Peabody Museum of Archaeology and Ethnology of Harvard University. The Mistihalj skeletons were excavated by the joint Stanford University-Yugoslavian Expedition to the Trebisnjica River Valley during the summer of 1967. The Mistihalj cemetery is located in Bosnia-Herzegovina and dates to late medieval period; analysis of tombstones, grave goods and coins date the site to 1400-1475 A.D. The remains are culturally associated with the Vlakhs, a group of nomadic pastoralists.
The non-human sample included chimpanzees (Pan troglodytes), aged 1 to 12 years old; gorillas (Gorilla gorilla), aged 2 to 12 years old; and orang-utans (Pongo pygmaeus), aged 0 to 12. The apes are curated in the Mammals Collection of the Smithsonian Museum of Natural History and the Haman-Todd Osteological Collection at the Cleveland Museum of Natural History. The breakdown of individuals on which data was analyzed is presented in Table II.I. While more specimens were included in the initial data collection, many could not be included in the analysis, as the infradiaphyseal area was not accessible or too
damaged. Some of the elements were fragmented or missing, some long bones were still connected by dried tissue, and in some cases the unfused epiphyses had been re-glued to the shafts prior to this study. One method for measuring the femoral obliquity angle was based Table II.I: Sample size of the taxa included in the infradiaphyseal analyses and the photographic femoral obliquity analysis
Species Femur
Infradiaphyseal Infradiaphyseal Tibia Photographic Femur
Homo sapiens 34 17 46
Pan troglodytes 13 26 24
Gorilla gorilla 17 26 29
on photographs. This method was therefore not as dependent on the state of the specimens with regards to fragmentation and similar issues. Thus, the sample for femoral obliquity photographical analysis is larger, as presented in Table II.I. Right elements were chosen when available. Seven juvenile A. afarensis fossils, which are curated at the National Museum of Ethiopia, were also measured. However, due to the aforementioned issues, only 4 could be included in the analyses: A.L. 333-110, A.L. 333-111, A.L. 333-140, and A.L. 333-39.
2.2. Methods
The nature of this project necessitated two distinct data-collecting and processing methods. The first was photography and applied only to the measurement of femoral obliquity angles. The second is the collection of three-dimensional data and applied to the analysis of femoral and tibial obliquity angles, as well as to the analysis of the topography of the knee joint’s metaphyses.
2.2.1. Data Collection
2.2.1.1. Photography
The femurs were photographed using a Canon Rebel XT (8 MP, EF-S 18-55mm lens) for humans, a Panasonic DMC-FZ18 (8.3MP, 28-504mm lens) for great apes, and a Canon PowerShot A100-IS (10 MP) for the fossils. They were placed proximal side up, posterior side against a metric board. The femurs were rested on the two condyles or on the metaphyseal surface depending on whether the epiphyses were attached to the diaphysis or not. To eliminate the possibility of parallax distortion, the camera was placed at a distance of at least 12 times the length of the element being photographed (Griffin and Richmond 2010). This resulted in the camera being placed at a distance of about 5 meters from the elements, except in the case of a few very small specimens, where the camera had to be placed at a distance of 2 meters for picture clarity. The picture was taken using a remote
trigger, or if not available, using the multiple shot function, in order to keep the camera as stable as possible during exposure.
2.2.1.2. Three Dimensional Data Collection
Three-dimensional analysis of the infradiaphyseal plane was done from points recorded in 3D space using a Microscribe digitizer. In total, more than 100 landmarks were chosen on the femur and tibia. For each landmarks, x, y, and z coordinates were recorded. These landmarks were
chosen to give the best quantifiable
morphology of the knee epiphyses, as well as the position of the diaphysis (Fig. 2.1.). As
mentioned in Chapter 1, the femoral metaphysis is marked by peaks and grooves, and these are
more developed in great ape specimens, resulting in a much more convoluted topography. Landmarks were selected to allow calculation of angles between these protuberances, and to get the general the topography of the metaphysis.
The infradiaphyseal plane of the proximal tibia, unlike that of the femur, is much less convoluted with no clear grooves of peaks, so points were taken at regular intervals, again with the intention of measuring angles, but more specifically, to see if there was a difference in general trends of curvature of this plane between humans and great apes. In both the tibia and femur, three points were taken along the diaphyseal axis, at 25%, 50% and 75% of the total diaphyseal length. Data collection started first with the femur or tibia being stabilized with museum putty or modelling clay. The points were then recorded in the exact same order and sent directly to a Microsoft Excel (2007) file, with a separate sheet for every individual. In the sheet, each row corresponded to a different landmark and the x, y
Figure 2.1.: Diagram of landmarks used in this study. Distal view of the right distal femoral metaphysis (left) and proximal view of the right proximal tibial metaphysis (right). Shaded area represents grooves or creases in the surface of the femoral metaphysis.
and z coordinates were in three separate, consecutive cells, thus resulting in an x column, a y column and a z column. When a landmark was not recordable because of fragmentation or because of attached epiphyses, for example, the points were skipped and the
corresponding cells in the sheet were left blank.
2.2.2. Preparation
2.2.2.1. Measurement of femoral obliquity angle from photographs
The femoral obliquity angles were measured from the photos using the program ImageJ
(Abramoff et al. 2004). The angles were measured between the long axis of the diaphysis and the axis perpendicular to the plane on which the condyles rested or, in the case of unfused epiphyses, the plane on which rested the distal end of the femur (Fig. 2.2.). Adducted knee joints result in a positive femoral obliquity value as the diaphyseal axis pivots counter clockwise from the plane of reference, while abducted knee joints, where the axis of the diaphysis pivots clockwise from the axis of reference, result in negative angle values. The program allows the user
to define two axes and calculates the angle between them. To minimize intra-observer variation, the angles were measured 10 times for each specimen, and the average of those 10 results was plotted as the final value for each individual. When the right femur was not available, the photo of the left femur was taken and the photographs were flipped prior to taking the measurement.
Figure 2.2.: An example of the method used for measuring the femoral obliquity angle, using the right femur of a juvenile Gorilla individual.