Scale effects on the response of composite structures under impact loading
Texte intégral
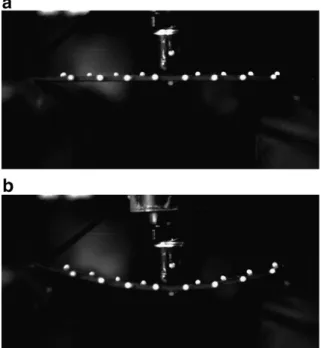
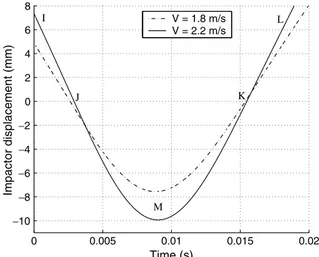
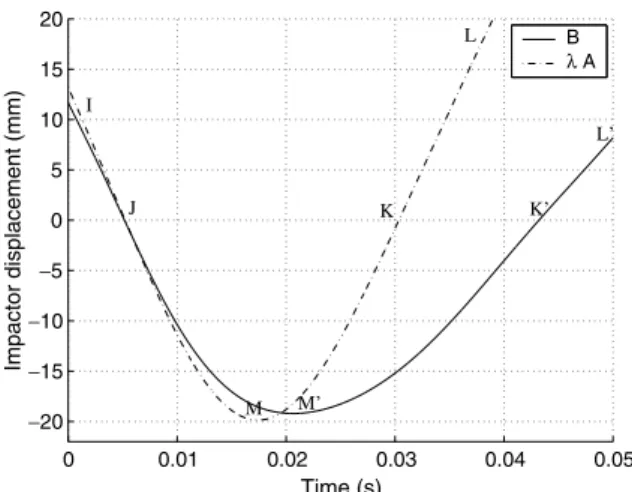
Figure


Documents relatifs
La matière ; codifiée par une structure moléculaire, déterminée après sa synthèse ou son extraction du règne naturel, est mise à profit selon l'activité intrinsèque
Ainsi, la présence ou l’absence de cire d’abeille, de corps gras et de résines de conifères ne relevait pas du hasard mais bien d’une volonté de préserver le corps, et donc
En effet, la populationll,gal€ des communes comportera, dans la popu- lation comptde dL part, tous les 6tudiants r6sidant dans les logements ordinaires d'autres communes
However, for dynamic complex fenestration systems whose optical behavior (transmission, reflection and scattering) may change during simulation (such as windows with shadings),
Summary. We study the stability of travelling wall profiles for a one dimensional model of ferromagnetic nanowire submitted to an exterior magnetic field. We prove that these
L’article d’Akerlof comprend une démonstration formelle de l’écroulement du marché des voitures usagées en contexte d’information asymétrique. La version qui suit
Sustainable and inclusive territorial rural development requires that family farming assume a leading role in rural transformations.. Family farming is part of the solution to
Comme nous l'avons mentionné précédemment, l'organisme communautaire Tandem VSP offre une panoplie d'activités en matière de sécurité pour améliorer la qualité
