Science Arts & Métiers (SAM)
is an open access repository that collects the work of Arts et Métiers Institute of Technology researchers and makes it freely available over the web where possible.
This is an author-deposited version published in: https://sam.ensam.eu Handle ID: .http://hdl.handle.net/10985/6888
To cite this version :
Etienne PESSARD, Franck MOREL, Anne MOREL - The anisotropic fatigue behavior of forged steel - Advanced Engineering Materials - Vol. 11, n°9, p.732-735 - 2009
The anisotropic fatigue behaviour of forged steel
ETIENNE PESSARDa, FRANCK MORELa, ANNE MORELa
a
Arts et Métiers ParisTech,
Laboratoire Procédés Matériaux Instrumentation Centre d’Angers, 49035, Angers cedex 01
Abstract This work deals with the anisotropic fatigue behaviour of the Bainitic
Steel Metasco®MC and aims at improving the fatigue criteria used for the design of forged components (suspension arm). This material contains elongated manganese sulphide (MnS) inclusions oriented parallel to the rolling or forging direction. Specimens with different orientations relative to the rolling direction have been tested in fatigue under push-pull uniaxial loads. The influence of “inclusion clusters” is clearly demonstrated via the observation of the fracture surfaces. A fracture mechanics approach together with a statistical approach is proposed to account for the anisotropic fatigue behaviour.
1 INTRODUCTION
Forged components are recognized as having good mechanical properties, in particular in fatigue. This is mainly due to the microstructure induced by the forging process which leads to: the improvement of the material compactness, a finer and more homogeneous microstructure (e.g. a broken dendritic structure) and fibering. The latter can result in considerable variation of the fatigue limit, depending on the fiber orientation. This variation has been reported as being 35% for 42CrMo4 steel [7] and 15% for a duplex stainless steel [4]
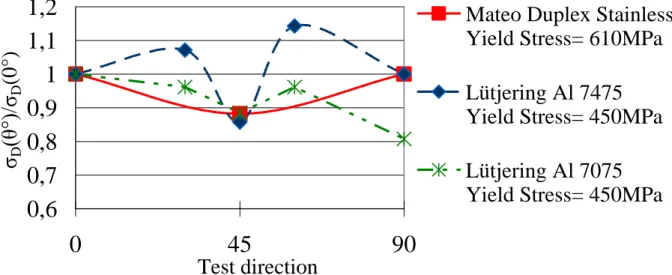
From a review of the scientific literature, regarding the anisotropic fatigue behaviour of metallic materials, two different types of fatigue behaviour can be observed. Specifically, two different fatigue initiation mechanisms, depending on the ultimate tensile strength of the material, are often discussed [3-4-6-7]. The first group is for polycrystalline metallic materials with an ultimate tensile strength lower than 1000 MPa. In this case the high cycle fatigue is very often governed by localized plasticity mechanisms in the matrix. For instance, Mateo and Lütjering [3-4] showed that for a duplex stainless steel and an aluminium alloy the anisotropic monotonic mechanical properties do not necessarily follow the same trend as the anisotropic high cycle fatigue behaviour [3-4]. They reported that the pancake microstructure in the rolled plate from which the specimens were machined causes a significant drop in the fatigue limit when the effective slip induced by the loading is a maximum. Under push-pull loading, this is observed when the specimen axis is oriented 45° to the rolling direction. That is, when the elongated grains lie on the maximum shear stress plane (see
figure 1). These authors observed that, the principal effect of the different phases and grain boundaries is to stop short crack growth. Moreover, the fraction of the fatigue life during which the principal crack is blocked by successive boundaries (or microstructural barriers) strongly exceeds that of the long crack propagation part of the fatigue life.
0,6
0,7
0,8
0,9
1
1,1
1,2
0
45
90
Test direction σD (θ°)/ σD (0°)Mateo Duplex Stainless Steel Yield Stress= 610MPa
Lütjering Al 7475 Yield Stress= 450MPa Lütjering Al 7075 Yield Stress= 450MPa
Figure 1: Push-Pull Fatigue Limit (Normalised by the 0° value) as a function of the test direction for metallic materials with a UTS<1000MPa.
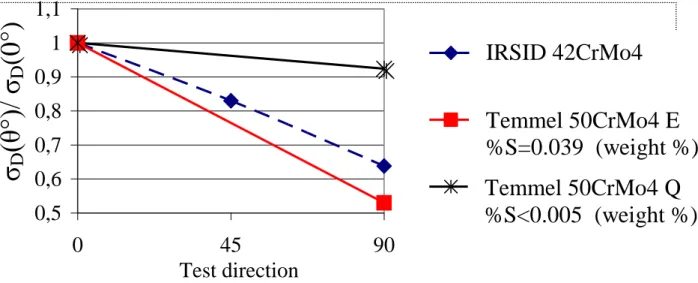
The second type of anisotropic fatigue behaviour, discussed in the literature, is observed in forged or rolled hardened steels, in which the UTS is greater than 1000 MPa (see figure 2). In some cases, the fatigue strength of these steels, in the transverse direction, is only 50% of that in the longitudinal direction. This behaviour can for the most part be attributed to the existence of elongated manganese sulphide (MnS) inclusions, oriented parallel to the rolling or forging direction. Indeed, these manganese sulphide inclusions are appreciated for their beneficial role during machining but, due their relatively high ductility, they deform strongly during forging or rolling. The resulting oriented microstructure leads to a continuous decrease in the fatigue limit with increasing fibering orientation angle and shows a minimum at 90 Degrees when the inclusions are perpendicular to the stress axis. Temmel et al. [6] reported thatthe anisotropy, in terms of fatigue, is more pronounced in a standard sulphur steel (50CD4 QS) with a dense manganese sulphide population, than in a low sulphur steel (50CD4 LS). This implies that the anisotropy level depends on both the volume and distribution of inclusion, and on the mechanical properties of the material matrix. Temmel and co-workers [6] also show that the Murakami empirical model [1] fails to account for the fatigue limit variation and that Murakami predictions are non-conservative.
0,5 0,6 0,7 0,8 0,9 1 1,1 0 45 90 Test direction IRSID 42CD4 Temmel 50CD4 E Temmel 50CD4 Q
σ
D(θ°)
/ σ
D(0°
)
IRSID 42CrMo4
Temmel 50CrMo4 E
%S=0.039 (weight %)
Temmel 50CrMo4 Q
%S<0.005 (weight %)
Figure 2: Push-Pull Fatigue Limit (Normalised by the 0° value) as a function of the test direction for steels with UTS>1000MPa.
2 MATERIAL AND EXPERIMENTAL PROCEDURE A Materials preparation
The material studied in this work is a Bainitic steel commercially referred to as Metasco®MC (25MnCRSiVB6) and is commonly used for the hot forging of automotive components. Its chemical composition is given in Table I. The material is produced in the form of bars with a deformation ratio of about 15. Figure 3 shows that the bainitic microstructure including some inclusions (MnS, Al2O3, TiN,VN). The Ultimate tensile strength of the material is 1283 MPa, 1193 MPa and 1007 MPa for the 0°, 45° and 90° orientations respectively. The yield stress is approximately 650 MPa and the hardness is 318 HV.
Table I. Chemical Composition (weight %).
Element C Mn Si Cr S Mo V Ti
Weight % 0.255 1.30 0.9 0.8 0.075 0.075 0.185 0.025
Figure 3: Microstructure of the Metasco®MC steel. MnS inclusion
10μm
B Materials preparation
Fourty five hour glass specimens for HCF uniaxial testing were machined from rolled bars (diameter 80mm) in 3 different directions with respect to the rolling direction: parallel (0°), perpendicular (90°) and at 45 degrees (45°). The specimen diameter was equal to 6 mm.
All specimens were annealed at 525°C for one hour in a vacuum to eliminate residual stresses introduced via polishing or machining. Push Pull (R=-1) fatigue tests were performed in a servo-hydraulic Instron testing machine at a frequency of 25Hz. The fatigue limits were evaluated using the staircase method, at 2x10⁶ cycles. All tests were carried out at room temperature and pressure in air. Non-broken specimens from the staircase were re-tested at a higher stress level in order to estimate the shape of the Wöhler curve.
The fracture surfaces of all the tested specimens were examined using a Scanning Electron Microscope (SEM).
3 EXPERIMENTAL RESUTS
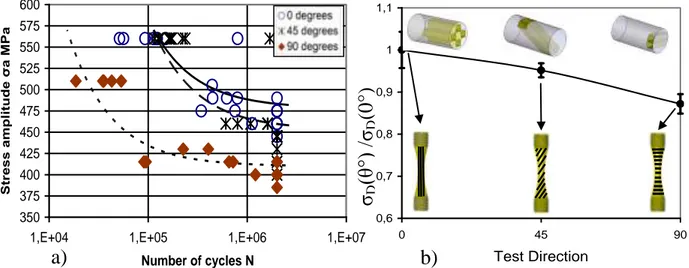
As observed in the literature for steels with a UTS>1000 MPa, the fatigue limit is highest for an orientation of 0° and lowest at 90° (see Figure 4 a ). In terms of the finite fatigue regime (i.e. for a stress level of 560 MPa) the average fatigue life is the same for the 0° and 45° orientations, but is much lower for 90°. The standard deviation or scatter (in terms of stress) is similar for the 45° and 90° orientations, however it is twice as large for the 0° orientation.
Figure 4: a)Wöhler curves for different specimen orientations with respect to the rolling direction, b) Push-Pull Fatigue Limit (Normalised by the 0° value) as a
function of the test direction.
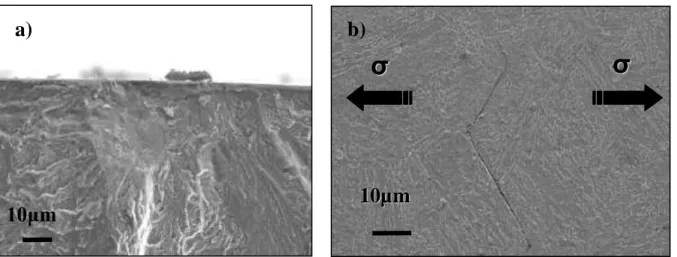
SEM observation of the tested specimens clearly highlight that the fatigue initiation mechanism strongly depends on the specimen orientation. For the 0° specimens, where the inclusions are parallel to the applied stress, the cracks seem to initiate in the material matrix. Observations of the crack path on the
a) σD (θ °) /σ D (0°)
Courbes de Wöhler en traction/compression R=-1
350 375 400 425 450 475 500 525 550 575 600
1,E+04 1,E+05 1,E+06 1,E+07
Number of cycles N Str ess am pl itu de σa M Pa 0 degrees 45 degrees 90 degrees b) 0,6 0,7 0,8 0,9 1 1,1 0 45 90 Test Direction σ (θ°) / σ (0°)
specimen surface show that the inclusions do not significantly influence crack initiation and that the bainitic microstructure governs the micro-crack growth (see Figure 5 b).
Figure 5: a) Fracture surface initiation site b) Crack path in bainite microstructure on specimen surface.
For specimens oriented at 45°, the initiation site is centred on a group of inclusions or a “cluster of inclusions” (see Figure 6).
Figure 6: observation at 45° a) Rupture surface b) Inclusion cluster on the Fatigue crack initiation site.
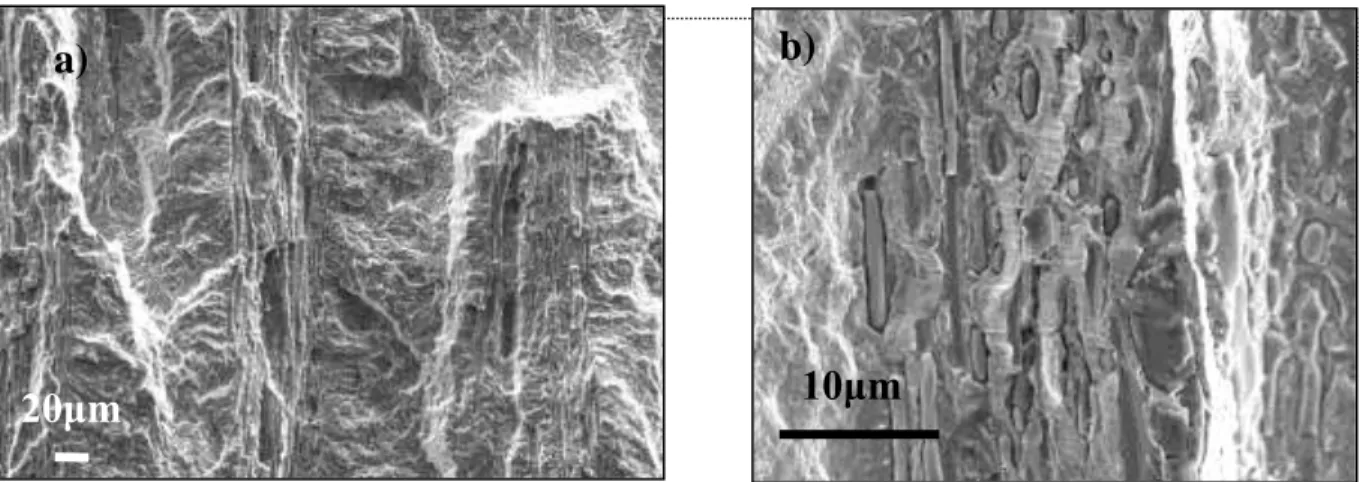
For 3 out of the fifteen specimens tested with the 90° orientation, crack initiation occurred at alumina bands. For the other samples the rupture surface observations show long “band of MnS inclusions” (Figure 7 a). In these bands micro-cracks appear between the inclusions (Figure 7 b) and join each other to create the final crack.
10μm MnS Cluster b) 1mm a)
σ
σ
σ
σ
1 100µµmm 10μm a) b)Figure 7: a)MnS Bands b) Cracks between MnS inclusion.
The fracture surfaces show that the orientation of the specimen greatly influences the type of fatigue mechanism. At 0° the cracks are initiated in the material matrix and both the fatigue limit and the standard deviation are high. At 45°, the cracks initiate at MnS clusters, and the fatigue limit and the standard deviation are lower. At 90°, the MnS clusters appear on the fracture surface as bands which govern the fatigue behaviour and further decrease the fatigue limit.
Figure 8: a) Inclusion bands b) distribution of the MnS band width.
To characterise the MnS inclusion population, the width (d) and the distance between the bands (D) were measured. The resulting distribution of the band width is shown in Figure 8b. The average MnS band width is 32 m with a standard deviation of 20 m. The average distance between bands is 58 m with a standard deviation of 35 m. A Beta law is used to characterise the distribution (see Figure 8 b).
4 ANALYSIS
The Murakami empirical criterion [1] which defines the relationship between the effective defect area and the fatigue limit is found to be inappropriate, especially for the 90° orientation.
20μm a) d D b) Based on 300 measurements on 8 specimens f
Normalised MnS band width (d/dmax)
0 0,5 1 1,5 2 2,5 3 0 0,2 0,4 0,6 0,8 1 Série1 20μm a) b) 10μm b)
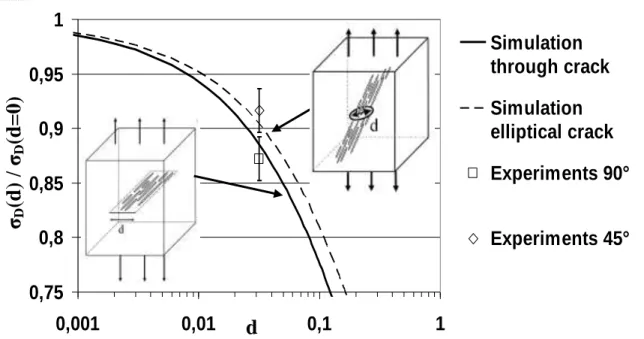
Figure 9: Normalised Fatigue Limit as a function of the band width and the test direction.
To account for the different fatigue limits at 0°, 45° and 90°, a non-propagation criterion built in the framework of Linear Elastic Fracture mechanics (LEFM) is proposed. More precisely, the defects (here the MnS clusters or bands) are assumed to be cracks. The average elastic strain energy within a critical area ahead of the crack tip is calculated (similar to the Taylor theory of critical distances [5]). The size of the critical area as well as the threshold of the average energy is assumed to be material dependent. The application of this approach to different defect sizes leads to the evolution of the normalised fatigue limit
D(d)/D(d=0) with respect to the crack/defect size, d (see Figure 9). As can be seen from Figure 9, this approach correctly reproduces the main trend of the well-known Kitagawa diagram, in particular, the size independence of the fatigue limit when the size tends to zero.
The approach can then be used to predict the anisotropic behaviour at 45° and 90°. For the 90° orientation and as seen in figure 9, the clusters are modelled as being through cracks of size d. For the 45° orientation, the fatigue cracks still initiates from MnS clusters (figure 6 b) but the intersection between the clusters (or inclusion bands) and the plane of maximum normal stress is an ellipse. Hence for the 45° case the defects are modelled as elliptical cracks [2]. As shown in figure 9, the two crack types (through and elliptical) do not lead to the same predictions, the through crack being the most detrimental. From the statistical work conducted on the cluster size, a mean value of 32 m was derived. For this size and as observed in figure 9, the two experimental fatigue limits lie close to the two curves. For the 0° orientation and as can be proved by numerical simulations using Finite Element Methods the clusters are no longer critical and should not be considered as cracks.
0,75 0,8 0,85 0,9 0,95 1 0,001 0,01 0,1 1 Simulation through crack Simulation elliptical crack Experiments 90° Experiments 45° d σD (d ) / σ D (d=0 )
5 CONCLUSIONS AND PROSPECTIVES
The forged bainitic steel Metasco®MC is found to show an anisotropic fatigue behaviour due to a change in the crack initiation mechanism. At 0°, i.e. when the inclusions are parallel to the applied stress, the micro-crack initiation is controlled by the matrix. At 45° and 90°, elongated manganese sulfide inclusions clusters are at the origin of crack initiation and the fatigue strength drops significantly. A comprehensive statistical study of the cluster size and relative position leads in both cases to a Beta type distribution law and a mean size of the same order as the average austenite grain size.
An energetic criterion built in the framework of Linear Elastic Fracture Mechanics and following the critical area concept allows the prediction of the fatigue limit for any defect size (Kitagawa type diagram), the defect being considered as a crack. This criterion is used to explain the different fatigue limit values at 45° and 90° compared to the 0° orientation.
The next steps of this work will be :
to investigate the anisotropic High Cycle Fatigue behaviour under different loading modes, in particular under torsion.
To study the spatial cluster distribution effect on the fatigue strength To extend the energetic criterion to any loading modes
6 ACKNOWLEDGMENTS
This work is being performed within the ANR (National Research Agency) Optiforge project, in a partnership including several industrial (Ascoforge, Ascometal, Cetim, PSA, Setforge, Transvalor) and academic (INSA Lyon, ENSMP-CEMEF, ENSAM Angers) institutions.
7 REFERENCES:
[1] Y. Murakami, Metal fatigue, Elsevier, 2002.
[2] V.S. Kirilyuk, O.I Levchuk, Eng. Fract. Mech. , 2007, 74, 2881.
[3] G. Lütjering, J. Albrecht, C. Sauer, T. Krull, Mater. Sci. Eng. A, 2007, 468 [4] A.Mateo, L. Llanes, N. Akdut, J Stolarz.and M.Abglada, Int. J. Fatigue.,
2003, 25, 481.
[5] D. Taylor, Eng. Fract. Mech. , 2008, 75, 1696.
[6] C. Temmel, B. Karlsson, N.G. Ingesten, Metall. Mater. Trans. A, 2008, 1-13. [7] J.Y. Berard, K. Dang Van, G. Baudry, IRSID Internal Report 93 062, 1993.