HAL Id: hal-01436215
https://hal.archives-ouvertes.fr/hal-01436215
Submitted on 10 Jan 2020
HAL is a multi-disciplinary open access
archive for the deposit and dissemination of
sci-entific research documents, whether they are
pub-lished or not. The documents may come from
teaching and research institutions in France or
abroad, or from public or private research centers.
L’archive ouverte pluridisciplinaire HAL, est
destinée au dépôt et à la diffusion de documents
scientifiques de niveau recherche, publiés ou non,
émanant des établissements d’enseignement et de
recherche français ou étrangers, des laboratoires
publics ou privés.
Comparison of DASH Adaptation Strategies Based on
Bitrate and Quality Signalling
Francesca de Simone, Frederic Dufaux
To cite this version:
Francesca de Simone, Frederic Dufaux. Comparison of DASH Adaptation Strategies Based on Bitrate
and Quality Signalling. IEEE International Workshop on Multimedia Signal Processing (MMSP 2013),
IEEE, Sep 2013, Pula, Italy. �hal-01436215�
Comparison of DASH Adaptation Strategies Based
on Bitrate and Quality Signalling
Francesca De Simone, Frederic Dufaux
Dept. Traitement du Signal et des Images, T´𝑒l´𝑒com ParisTech 75014 Paris, France
francesca.de-simone@telecom-paristech.fr frederic.dufaux@telecom-paristech.fr
Abstract—During a Dynamic Adaptive Streaming over HTTP
(DASH) video transmission, the client can dynamically adapt the bitrate of the requested stream to changes in network conditions, by switching between different versions of the same content encoded at different bitrates, called representations. Each representation is split in smaller portions, called segments, and representation switching can be done at each segment. In this paper, we propose a comparative analysis of different adaptation strategies for representation switching, which exploit information on the bitrate and the visual quality of the different available versions of the requested content, at representation or at segment level. The results allow to identify the advantages and drawbacks related to each strategy in terms of bandwidth exploitation, maximization of visual quality and risk of buffer underflow.
I. INTRODUCTION
The Dynamic Adaptive Streaming over HTTP (DASH) standard [1] provides an efficient solution to deliver audio-visual content over networks with fluctuating bandwidth, by dynamically adapting the bitrate of the transmitted stream to network changes. Particularly, in the DASH architecture, the same media file is encoded at several bitrates. Each encoded version of the same media is referred to as a representation. The set of representations of the same media constitutes an adaptation set, stored on an HTTP server. The streams in an adaptation set are chopped into portions that can be independently decoded, called segments. Each segment can be individually requested by the client via a TCP request. Infor-mation regarding the characteristics (such as the bitrate) of the representations available in the adaptation set is delivered to the client in a dedicated file, called media presentation description (MPD). Thus, the client can decide to switch between different representations during the streaming session, dynamically adapting the bitrate of the requested stream to changes in network conditions. This dynamic rate adaptation capability is particularly useful for multimedia content stream-ing scenarios involvstream-ing highly variable network conditions, such as mobile video streaming.
Due to the reliable nature of the transport layer, adaptive video streaming over HTTP does not suffer from data packet MMSP’13, Sept. 30 - Oct. 2, 2013, Pula (Sardinia), Italy. 978-1-4799-0125-8/13/$31.00 ⃝2013 IEEE.c
loss. However, depending on the network conditions and the rate adaptation strategy adopted by the client, there can be playout interruptions, i.e. video player buffer underflow events, and video quality fluctuations, which affects the quality of experience (QoE) of the end user, as discussed in [2], [3], [4], [5].
Few works are available in literature proposing client-driven rate adaptation solutions for dynamic HTTP streaming aiming at maximizing user’s QoE. Zhou et al. [6] have proposed a control-theoretic approach for rate adaptation to minimize the risk of buffer underflow and overflow, while maximizing the bitrate of the selected segment. Miller et al. [7] have proposed an adaptation algorithm to avoid the risk of buffer underflow, while maximizing the bitrate of the selected segments and minimizing the number of bitrate switches that may results in visual quality fluctuations. The start-up time, needed to start the playout after the user requests a content, is also taken into account. The bitrate of the segments is approximated to the average bitrate of each representation, as this is the information available at the end user side.
Recently, in the framework of the MPEG standardization activities on DASH, a core experiment has been established to study the benefits that can be obtained by signalling to the client information regarding not only the bitrate but also the visual quality of each representation or even each segment [8]. The basic idea behind quality signalling at representation or segment level is that this information can be used to refine the representation switching strategy performed at the client side, for example in order to avoid annoying quality fluctuations or to guarantee a certain threshold of visual quality of the sequence displayed to the user.
In this paper, we propose a comparative analysis of different client-driven bitrate adaptation strategies based on the bitrate and quality information available at the client side, either at representation or segment level. While the evolution of the buffer size for each adaptation strategy is analyzed, the network and coding conditions used in this paper exclude the occurrence of actual buffer underflow events. For this reason, the adaptation strategies proposed in [6] and [7] have not been included in the comparison. This work can be considered as an extension of the preliminary study in [9], where only one content, relatively high coding bitrates and good bandwidth
conditions have been considered. Particularly, in our study, several realistic video contents, challenging network condi-tions and lower coding bitrates are considered. Also, a new adaptation strategy, exploiting bitrate and quality information at segment level and based on the concept of visual quality saturation and just noticeable distortion (JND), is proposed and included in the comparison. The obtained results allow to identify the advantages and drawbacks related to each strategy in terms of exploitation of the available bandwidth, maximization of visual quality and risk of buffer underflow.
The rest of the paper is organized as follows. In Section II, the experimental framework set up for our study, from the content preparation process to the simulation of the network conditions and the video player behavior, is described. The adaptation strategies implemented and included in the com-parison are illustrated in Section III. The obtained results are presented and discussed in Section IV. Finally, Section V concludes the paper, summarizing the major achievements of the proposed study and drawing directions for future work.
II. EXPERIMENTAL FRAMEWORK
The main functionalities implemented in our experimental framework are detailed below. Only the video channel of the audio-visual content has been considered in the simulations. A. Content preparation
In order to simulate a realistic scenario, video content from YouTube1 has been used. Eight video sequences have been selected, for which a high quality version at 4K, HD1080 or HD720 resolution is available. The characteristics of the selected source sequences are summarized in Table I. These streams have been downloaded, decoded to YUV 4:2:0 raw format (fourcc i420) and scaled to a common lower target spatial resolution, keeping the original aspect ratio. A target resolution of 640x360 pixels has been chosen for this study. This allows to directly compare our results to those in [9], where such resolution has been considered. Also, this is a realistic resolution for an application like mobile video streaming that would match the network conditions modeled in our study (refer to subsection II-B for details). The frame rate has been scaled to approximately 24 or 25 fps, depending on the frame rate of the source version. Decoding and scaling have been performed using the ffmpeg tool2.
The first 2 minutes of each uncompressed stream at 640x360 resolution have been used as input sequence fed into the H.264/AVC encoder. The x264 encoder3 has been used, with rate control for variable bit rate coding and the settings specified in [9], but the following target bit rates: [1600, 1100, 800, 600, 500, 300, 200, 100] kbps. Since our goal is to simulate rate adaptation under critical network conditions, the considered bitrate range is lower than that used in [9] (in between 8000 and 500 kbps). Additionally, we have noticed that the subjective visual quality of the encoded videos would
1http://youtube.com 2http://www.ffmpeg.org/
3http://www.videolan.org/developers/x264.html
be very high when considering bitrates between 8000 and 500 kbps for 640x360 resolution. Particularly, we could not visually distinguish one representation from another. In such conditions, the usefulness of any adaptation strategy would be limited, as the user would already be fully satisfied by receiving the lowest bitrate representation. Figure 1 shows the PSNR values of the representations considered in our study.
Finally, each encoded stream has been split into 2 seconds long DASH-compliant segments, using the MP4Box tool in-cluded in the GPAC framework4.
0 200 400 600 800 1000 1200 1400 1600 30 35 40 45 50 55 bitrate (kbps) average PSNR (dB) content 1 content 2 content 3 content 4 content 5 content 6 content 7 content 8
Fig. 1. Average PSNR value of each representation in the adaptation set.
B. Bandwidth model
Similarly to [9], the following artificial model of band-width fluctuations has been used. The available bandband-width (𝐵𝑊𝑎𝑣𝑎𝑖𝑙) starts at 200 kbps and jumps up every 7 seconds, with step of 200 kbps. When it reaches 1Mbps, the bandwidth starts to jump down every 7 seconds, again with step of 200 kbps, till it reaches the starting 200 kbps. The ramp repeats itself till the end of the streaming, with 7 seconds at 100 kbps in between each ramp. The fluctuations of available bandwidth can be visualized in Figure 3.
C. Client model
The client model includes the video player buffer and the bandwidth estimation. Both are based on the assumption that a new segment is requested only once the previous segment has been completely downloaded. Also, a segment is played-out only after its complete download. We define 𝑡𝑘 as the time when segment𝑘 is downloaded completely.
The simulated buffer has an unlimited maximum size and a minimum size of 2 seconds (i.e., the duration of one segment). Thus, independently from the adaptation method, at the beginning of the streaming, and every time the buffer size goes under the threshold of 2 seconds, the client requests a segment at the lowest bit rate in order to fill in the minimum
TABLE I
CHARACTERISTICS OF THESELECTEDVIDEOSEQUENCESUSED TOPRODUCEUNCOMPRESSEDSAMPLES AT640X360 RESOLUTION.
ID Genre Description YouTube url Resolution Frame rate Codec
1 movie trailer (action) fast motion, many scene cuts s3r74atUqic 3840x2160 23.9 AVC
2 movie trailer (fantasy) fast motion, many scene cuts t56ooXC9VmY 4096x2304 23.9 AVC
3 movie trailer (drama) slow motion, many scene cuts fJ1O1vb9AUU 1920x1080 23.9 AVC
4 cartoon ad slow motion, no scene cuts ntOdEO84SnY 1920x1080 29.9 AVC
5 tv series (comic) some scene cuts uT6Destt22Q 1920x1080 24.9 AVC
6 natural scenes fast motion NIE3ubfMeik 1920x1080 23.9 AVC
7 news static scene, some close up HvaKBU Q1TY 1280x720 24.9 AVC
8 sport (tennis) static scene, some scene cuts and close up pdcwbQa7S5E 1920x1080 23.9 AVC
buffer. The buffer size is measured every time a segment has been completely downloaded, as:
𝐵𝑢𝑓(𝑡𝑘) = 𝐵𝑢𝑓(𝑡𝑘−1) − 𝐷𝑤𝑇 𝑖𝑚𝑒𝑘+ 𝐷𝑢𝑟𝑎𝑡𝑖𝑜𝑛𝑘 (1)
where𝐵𝑢𝑓(𝑡𝑘−1) is the size of the buffer measured when the
previous segment (𝑘 − 1) has been completely downloaded, 𝐷𝑤𝑇 𝑖𝑚𝑒𝑘 is the time that was needed to download segment
𝑘 (during this time, data from the buffer is played-out), and 𝐷𝑢𝑟𝑎𝑡𝑖𝑜𝑛𝑘 is the duration of segment 𝑘 in playout time (2
seconds in our case).
The estimation of the available bandwidth is based on the assumption that the output of the TCP layer is directly exposed to the client, thus there is no difference between estimation and measurement. The bandwidth estimation takes place every time a segment has been completely downloaded, as:
𝐵𝑊𝑒𝑠𝑡(𝑡𝑘) = 𝑆𝑖𝑧𝑒𝑘/𝐷𝑤𝑇 𝑖𝑚𝑒𝑘 (2)
where 𝑆𝑖𝑧𝑒𝑘 is the size of the downloaded segment𝑘 in bits. Based on𝐵𝑊𝑒𝑠𝑡(𝑡𝑘) and on the adaptation strategy, the client
selects what is the next segment (𝑘+1) to request, as discussed in the next section.
III. ADAPTATION STRATEGIES
Two sets of adaptation strategies have been implemented and included in the comparison: those based on per-representation information available at the client side (adap-tation on represen(adap-tation basis) and those based on per-segment information available at the client side (adaptation on per-segment basis).
As adaptation on per-representation basis, we distinguish among strategies relying on:
1) average bitrate information (R-AVGBR). The informa-tion available at the client side is the average bitrate of each representation. The requested segment is that of the representation having average bitrate lower than but closest to (or equal to) the estimated bandwidth. 2) maximum bitrate information (R-MAXBR). The
infor-mation available at the client side is the maximum bitrate of each representation (i.e. the maximum bitrate across the segments of the representation) [9]. The requested segment is that of the representation having maximum bitrate lower than but closest to (or equal to) the estimated bandwidth. If none of the representations has bitrate lower than the available bandwidth, that corresponding to the lowest bitrate is selected.
As adaptation on per-segment basis, we distinguish among strategies relying on:
3) average bitrate information (S-BR). The information available at the client side is the average bitrate of each segment [9]. Thus, the requested segment is that having bitrate lower than but closest to (or equal to) the estimated bandwidth.
4) average bitrate information, quality saturation and JND quality threshold (S-BR-Q). The information available at the client side is the average bitrate of each seg-ment, as well as its average PSNR. We propose an adaptation strategy according to which the requested segment is selected among those having average bi-trate lower than (or equal to) the estimated bandwidth and average quality falling in a range of significant PNSR values [𝑃 𝑆𝑁𝑅𝑚𝑎𝑥, 𝑃 𝑆𝑁𝑅𝑚𝑖𝑛]. 𝑃 𝑆𝑁𝑅𝑚𝑎𝑥 is an upper bound PSNR value above which no perceptual quality improvement can be detected. 𝑃 𝑆𝑁𝑅𝑚𝑖𝑛 is a lower bound PSNR value below which no further perceptual quality degradation can be detected. In this set of samples, if there are segments having PSNR values that differ for less than a JND value 𝑃 𝑆𝑁𝑅𝑗𝑛𝑑, only that corresponding to the lowest bitrate is considered. Finally, in this reduced set, the sample corresponding to the bitrate closest to the estimated bandwidth is selected. If all the samples having average bitrate lower than (or equal to) the estimated bandwidth have PSNR values above (below) the upper (lower) bound, that correspond-ing to the lowest bitrate is selected.
If none of the samples has bitrate lower than the avail-able bandwidth, that corresponding to the lowest bitrate is selected.
As an example, Figure 2 shows the bitrate and PSNR values computed at representation and segment level for one sequence in our test set. As it is clear from the figure, the segment bitrate and PSNR can be very different from the values computed over the entire representation. Similarly to [9], the considered adaptation algorithms are very simple: they have been selected because they allow an unbiased analysis of the impact of the information available at the client side, via the MPD. More complex adaptation strategies will be added to the comparison in future works.
0 10 20 30 40 50 60 0 1000 segment bitrate (kbps) 0 10 20 30 40 50 60 0 50 100 segment number segment PSNR (dB)
Content 1 − Representation at avg bitrate = 500 kbps max bitrate = 1511.15 kbps, avg PSNR = 48.88 dB
Fig. 2. Example of bitrate and PSNR values computed at representation and segment level for one representation (content 1, coding bitrate 500 kbps).
IV. RESULTS
The results reported in this section have been obtained considering 𝑃 𝑆𝑁𝑅𝑚𝑎𝑥 = 50𝑑𝐵, 𝑃 𝑆𝑁𝑅𝑚𝑖𝑛 = 30𝑑𝐵 and
𝑃 𝑆𝑁𝑅𝑗𝑛𝑑= 2𝑑𝐵. These thresholds have been defined, after
visually analyzing all the representations, as general content-independent values. The optimization of these thresholds is out of the scope of this paper and will be addressed in future works.
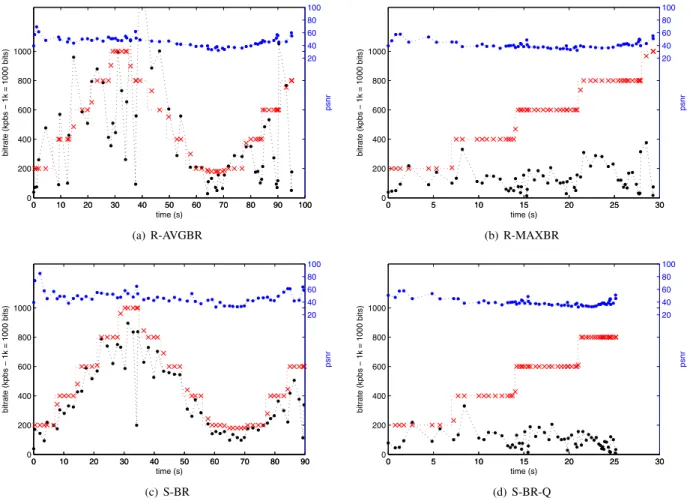
Figure 3 shows the results of the different adaptation strategies for one example content, in terms of bitrate of the selected segments with respect to the estimated (and available) bandwidth. The PSNR of the selected segments is also shown in the upper part of the plots. Figure 4 show the corresponding buffer size evolution during the entire duration of the streaming, for all the four adaptation strategies.
0 10 20 30 40 50 60 70 80 90 100 0 20 40 60 80 100 120 time (s) buffer size (s) R−AVGBR R−MAXBR S−BR S−BR−Q
Fig. 4. Buffer size (𝐵𝑢𝑓(𝑡)) evolution during the entire duration of the streaming of content 1, for all the adaptation strategies shown in Fig. 3. Each curve ends when the last segment has been received: different algorithms request different segments, thus fill the buffer at different speed, that is why the curves have different lengths.
On one hand, it can be noticed from the plots in Fig. 3 that, as expected from the strategy adaptation design, the algorithms that fully exploit all the available bandwidth are R-AVGBR and S-BR (Fig. 3 (a) and (c)). At the same time, as visible in Fig. 4, S-BR limits the risk of buffer underflow, as there are never segment transfers for bitrates higher than the estimated bandwidth. Instead, R-AVGBR constitutes a less robust approach against the risk of buffer underflow, in case of further, even short, degradation of the network conditions. This is due to the fact that, when the content is encoded at variable bitrate, the client underestimates the bitrate of some segments, since it relies only on the average representation bitrate information.
On the other hand, the algorithms R-MAXBR and S-BR-Q under-exploit the available bandwidth, as the bitrate of the requested segments is often much lower than the available bandwidth. In R-MAXBR, this is due to the fact that, espe-cially when the content is encoded at variable bitrate, the client strongly underestimates the bitrate of most of the segments, since it relies only on the maximum representation bitrate. This may cause the delivery of content at lower visual quality than expected to the user. A similar approach, but controlled by a set of quality thresholds, is applied in S-BR-Q. In this case, the idea is that if the quality of the encoded content is already acceptable, than there is not need to ‘waste’ bandwidth for the current user, as delivering higher bitrates does not necessarily lead to a remarkable increase in video quality. This defines a sort of ‘energy saving’ and ‘community friendly’ modality, as the computational complexity of the decoding at the end user terminal is expected to be reduced and, at the same time, the saved bandwidth can be used to better allocate the network resources among the different users who are sharing them. In both R-MAXBR and S-BR-Q, the under-exploitation of the available bandwidth allows to fill in the buffer very quickly and increase the robustness against the risk of buffer underflow.
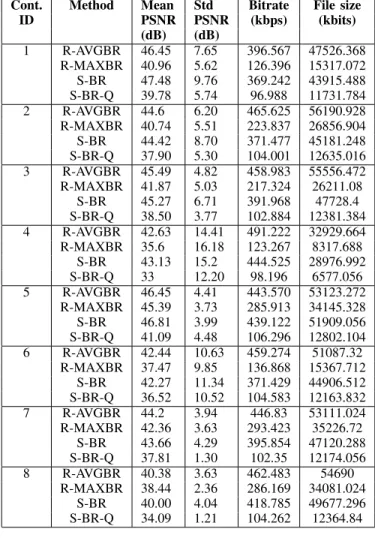
To allow an overall comparison of the performance of the different adaptation strategies, the average and standard deviation of the PSNR values computed on the sequence resulting from each adaptation (i.e., the video that the user would actually watch), its average bitrate and file size are listed in Table II for all the contents considered in our simulations (refer to Table I for a description corresponding to the content ID).
Across the entire set of test material, the lowest overall bitrate and visual quality (in terms of average PSNR) is always obtained when using S-BR-Q. Instead, the highest overall bitrate always correspond to R-AVGBR but this does not always lead to the highest average PSNR, which is sometimes reached by using S-BR (content 1, 4 and 5). Finally, it is interesting to notice that the strongest PSNR variations are occurring for S-BR, with some particular content dependent behavior, like for content 5, for which the strongest PSNR variation (still very small) is detected for S-BR-Q.
TABLE II
OVERALLCOMPARISON OF THERESULTSOBTAINED WITHDIFFERENT
ADAPTATIONSTRATEGIES.
Cont. Method Mean Std Bitrate File size ID PSNR PSNR (kbps) (kbits) (dB) (dB) 1 R-AVGBR 46.45 7.65 396.567 47526.368 R-MAXBR 40.96 5.62 126.396 15317.072 S-BR 47.48 9.76 369.242 43915.488 S-BR-Q 39.78 5.74 96.988 11731.784 2 R-AVGBR 44.6 6.20 465.625 56190.928 R-MAXBR 40.74 5.51 223.837 26856.904 S-BR 44.42 8.70 371.477 45181.248 S-BR-Q 37.90 5.30 104.001 12635.016 3 R-AVGBR 45.49 4.82 458.983 55556.472 R-MAXBR 41.87 5.03 217.324 26211.08 S-BR 45.27 6.71 391.968 47728.4 S-BR-Q 38.50 3.77 102.884 12381.384 4 R-AVGBR 42.63 14.41 491.222 32929.664 R-MAXBR 35.6 16.18 123.267 8317.688 S-BR 43.13 15.2 444.525 28976.992 S-BR-Q 33 12.20 98.196 6577.056 5 R-AVGBR 46.45 4.41 443.570 53123.272 R-MAXBR 45.39 3.73 285.913 34145.328 S-BR 46.81 3.99 439.122 51909.056 S-BR-Q 41.09 4.48 106.296 12802.104 6 R-AVGBR 42.44 10.63 459.274 51087.32 R-MAXBR 37.47 9.85 136.868 15367.712 S-BR 42.27 11.34 371.429 44906.512 S-BR-Q 36.52 10.52 104.583 12163.832 7 R-AVGBR 44.2 3.94 446.83 53111.024 R-MAXBR 42.36 3.63 293.423 35226.72 S-BR 43.66 4.29 395.854 47120.288 S-BR-Q 37.81 1.30 102.35 12174.056 8 R-AVGBR 40.38 3.63 462.483 54690 R-MAXBR 38.44 2.36 286.169 34081.024 S-BR 40.00 4.04 418.785 49677.296 S-BR-Q 34.09 1.21 104.262 12364.84 V. CONCLUSIONS
In this paper, we have described the implementation of an experimental framework to compare different client-driven bitrate adaptation strategies based on the availability of bitrate and quality information at the client side. Particularly, three simple adaptation strategies, based on bitrate information at representation or segment level, and one novel solution, exploiting bitrate and quality information at segment level and the concepts of visual quality saturation and JND, have been compared. The test scenario under analysis included several realistic video sequences, challenging network conditions and coding bitrates.
The obtained results allow to identify the advantages and drawbacks related to each strategy in terms of exploitation of the available bandwidth, maximization of visual quality and risk of buffer underflow. As a conclusion of the anal-ysis, for content encoded at variable bitrate, the optimal solution appears as a combination of the R-AVGBR, S-BR, S-BR-Q algorithms, with switches from one algorithm to another depending on: the presence of other users sharing the network resources; specific user’s quality requirements; the occurrence of strong degradations of network quality. In these
circumstances, the availability of segment-level information and specifically visual quality information, can provide useful advantages.
The conducted analysis has been based on the simple evaluation of visual quality by mean of PSNR, accompanied by informal expert viewing sessions to confirm the findings shown by the objective results. Thus, future works will focus on the subjective quality assessment of the produced test ma-terial and the definition of content-dependent thresholds to be exploited for quality-driven adaptation. More complex adap-tation strategies, as well as quality optimization approaches based on objective quality metrics other than PSNR, will also be added to the comparison. Furthermore, the adaptation of the audio channel of the considered multimedia content will be integrated in the developed framework, as well as new network and encoding models. Finally, while the focus of the proposed study was on client-driven adaptation, the design of a server-client joint quality optimization, including the definition of optimal encoding bitrates to avoid quality saturation and redundancy and reduce the need for signalling at the end user, will be investigated.
ACKNOWLEDGMENT
This work was partly funded by the FUI AUSTRAL project. The authors would also like to thank Prof. Jean Le Feuvre for the useful discussions and the technical support provided in the usage of MP4Box.
REFERENCES
[1] I. Sodagar, “The MPEG-DASH standard for multimedia streaming over the Internet,” Transactions on MultiMedia, IEEE, vol. 18, no. 4, pp. 62– 67, 2011.
[2] O. Oyman and S. Singh, “Quality of experience for HTTP adaptive streaming services,” Communications Magazine, IEEE, vol. 50, no. 4, pp. 20–27, 2012.
[3] K. Singh, Y. Hadjadj-Aoul, and G. Rubino, “Quality of experience estimation for adaptive HTTP/TCP video streaming using H.264/AVC,” in Proceedings of the IEEE Consumer Communications and Networking
Conference (CCNC), 2012, pp. 127–131.
[4] R. Mok, E. Chan, and R. Chang, “Measuring the quality of experience of HTTP video streaming,” in Proceedings of the IFIP/IEEE International
Symposium on Integrated Network Management (IM), 2011, pp. 485–492.
[5] S. Akhshabi, A. C. Begen, and C. Dovrolis, “An experimental evaluation of rate-adaptation algorithms in adaptive streaming over HTTP,” in
Proceedings of the second annual ACM conference on Multimedia systems (MMSys ’11), 2011, pp. 157–168.
[6] C. Zhou, X. Zhang, L. Huo, and Z. Guo, “A control-theoretic approach to rate adaptation for dynamic HTTP streaming,” in Proceedings of the
IEEE Visual Communications and Image Processing (VCIP) Conference,
2012, pp. 1–6.
[7] K. Miller, E. Quacchio, G. Gennari, and A. Wolisz, “Adaptation algo-rithm for adaptive streaming over HTTP,” in Proceedings of the 19th
International Packet Video Workshop (PV), 2012, pp. 173–178.
[8] Systems subgroup/DASH, “w13082 Descriptions of Core Experiments on DASH amendment,” MPEG meeting 102, Shanghai, 2012.
[9] S. Zhang, Y. Xu, P. Di, C. Ai, A. Giladi, X. Wang, and R. Yue, “m28172 Experiment results on quality driven streaming,” MPEG meeting 103, Geneva, 2013.
0 10 20 30 40 50 60 70 80 90 100 0 200 400 600 800 1000 time (s) bitrate (kpbs − 1k = 1000 bits) 0 10 20 30 40 50 60 70 80 90 100 20 40 60 80 100 psnr (a) R-AVGBR 0 5 10 15 20 25 30 0 200 400 600 800 1000 time (s) bitrate (kpbs − 1k = 1000 bits) 0 5 10 15 20 25 30 20 40 60 80 100 psnr (b) R-MAXBR 0 10 20 30 40 50 60 70 80 90 0 200 400 600 800 1000 time (s) bitrate (kpbs − 1k = 1000 bits) 0 10 20 30 40 50 60 70 80 90 20 40 60 80 100 psnr (c) S-BR 0 5 10 15 20 25 30 0 200 400 600 800 1000 time (s) bitrate (kpbs − 1k = 1000 bits) 0 5 10 15 20 25 30 20 40 60 80 100 psnr (d) S-BR-Q
Fig. 3. Results of the different adaptation strategies for content 1, in terms of bitrate and PSNR of the selected segments. The estimated bandwidth (𝐵𝑊𝑒𝑠𝑡) and available bandwidth (𝐵𝑊𝑎𝑣𝑎𝑖𝑙) are shown as the red× and red dotted line, respectively.