Titre:
Title:
New Simplified Method for Designing Seismically Isolated Highway
Bridges with Massive Piers
Auteurs:
Authors
:
Yudong Mao, Robert Tremblay, Pierre Léger et Jianzhong Li
Date: 2017
Type:
Article de revue / Journal articleRéférence:
Citation
:
Mao, Y., Tremblay, R., Léger, P. & Li, J. (2017). New Simplified Method for Designing Seismically Isolated Highway Bridges with Massive Piers. Journal of Bridge Engineering, 22(8). doi:10.1061/(asce)be.1943-5592.0001084
Document en libre accès dans PolyPublie
Open Access document in PolyPublieURL de PolyPublie:
PolyPublie URL: https://publications.polymtl.ca/5616/
Version: Version finale avant publication / Accepted version Révisé par les pairs / Refereed Conditions d’utilisation:
Terms of Use: Tous droits réservés / All rights reserved
Document publié chez l’éditeur officiel
Document issued by the official publisher
Titre de la revue:
Journal Title: Journal of Bridge Engineering (vol. 22, no 8)
Maison d’édition:
Publisher: ASCE
URL officiel:
Official URL: https://doi.org/10.1061/(asce)be.1943-5592.0001084
Mention légale:
Legal notice:
This material may be downloaded for personal use only. Any other use requires prior permission of the American Society of Civil Engineers. This material may be found at https://doi.org/10.1061/(asce)be.1943-5592.0001084
Ce fichier a été téléchargé à partir de PolyPublie, le dépôt institutionnel de Polytechnique Montréal
This file has been downloaded from PolyPublie, the institutional repository of Polytechnique Montréal
1
A New Simplified Method for Designing Seismically Isolated Highway
1
Bridges with Massive Piers
2
3
Yudong Mao1, Robert Tremblay2, Pierre Léger3 and Jianzhong Li4
4
1Ph.D. Candidate, State Key Laboratory of Disaster Reduction in Civil Engineering, Tongji Univ., Shanghai 200092, China;
5
presently, Visiting Researcher, Dept. of Civil, Geological, and Mining Engineering, Polytechnique Montréal, Montréal, QC
6
H3C 3A7, Canada. E-mail: 1310200@tongji.edu.cn
7
2Professor, Dept. of Civil, Geological, and Mining Engineering, Polytechnique Montréal, Montréal, QC H3C 3A7, Canada.
8
E-mail: robert.tremblay@polymtl.ca
9
3Professor, Dept. of Civil, Geological, and Mining Engineering, Polytechnique Montréal, Montréal, QC H3C 3A7, Canada.
10
E-mail: pierre.leger@polymtl.ca
11
4Professor, State Key Laboratory of Disaster Reduction in Civil Engineering, Tongji Univ., Shanghai 200092, China. E-mail:
12
lijianzh@tongji.edu.cn13
14
Abstract15
This paper proposes two new models for the simplified seismic analysis of seismically isolated highway bridges with
16
massive piers. Both models include two components: one of which includes the superstructure mass, the isolators and
17
massless pier, and the other one the pier with its distributed mass and stiffness properties. In one model, the isolator stiffness
18
is added at the top of the pier in the second component. The total seismic response is obtained from the square root of the
19
sum of squares (SRSS) of the two individual component results. Applicability and accuracy of the models are assessed by
20
considering bridges with wide ranges of stiffness and mass properties of piers, Mp, and superstructures, Mss. Multimode
21
Spectral Analysis (MMSA) and Nonlinear Time History Analysis (NLTHA) are used to define reference solutions for the
22
superstructure displacements, vibration periods, and shears and moments at pier bases. Results from four currently available
23
models including the model prescribed in AASHTO and CAN/CSA S6-14 codes are also examined. The study shows that
24
current models for the simplified analysis method yield good estimates of superstructure displacements and vibration periods;
25
however, they generally underestimate the shear and moment demands at pier bases. The errors are more significant for more
26
massive piers or when the stiffness of the piers is high compared to that of the isolators. In contrast, for all bridges studied,
27
the seismic responses from the proposed models show very good agreement with those from the MMSA. Better predictions
28
Manuscript Click here to download Manuscript Manuscript-YM-RT-PL-JL-2017-02-07F.docx
2
are obtained when considering the isolator stiffness in the second component of the model. The NLTHA results also show
29
that the proposed models give overall satisfactory predictions for pier base shears and moments. The proposed models extend
30
the range of application of the AASHTO and CAN/CSA S6-14 simplified method to isolated bridges with massive piers,
31
while preserving its simplicity with limited extra computational effort.
32
Keywords: Highway bridges; Seismic isolation design; Massive piers; Simplified method; Multimodal analysis; Nonlinear
33
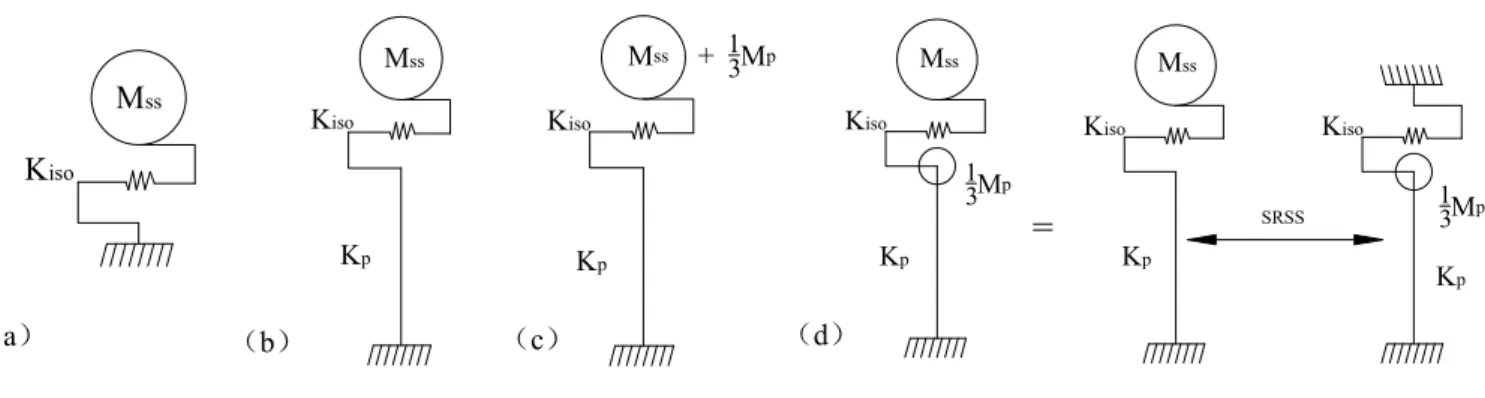
time history analysis
34
35
Introduction
36
Seismic isolation, i.e., decoupling the structure from the ground, provides an effective passive method of protecting
37
structures against severe seismic events. Because most isolation systems are nonlinear, it initially appears that only nonlinear
38
analysis methods can be used in their design, such as a nonlinear time-history analysis (NLTHA). However, if the nonlinear
39
properties can be linearized, equivalent linear (elastic) methods may be used, in which case many methods are suitable for the
40
design and analysis of isolated bridges (Buckle et al. 2006; Constantinou et al. 2011; AASHTO 2014; CSA 2014; FHWA
41
2014). Simplified analysis methods often use a single-degree-of-freedom (SDOF) system with effective linear (elastic) and
42
equivalent viscous properties to predict the displacement demand directly from prescribed response spectra (Hwang et al.
43
1997; Guyader and Iwan 2006; Feng and Lee 2009). Using fundamental assumptions, such as those of effective linear springs
44
and equivalent viscous damping, and neglecting pier mass contributions, simplified methods can give satisfactory results for
45
regular isolated bridges (e.g., bridges with small mass piers with approximately straight continuous decks in the longitudinal
46
direction and no abrupt changes in weight, stiffness or geometry, or with simply supported decks with no significant
47
interaction between piers; Dicleli et al. 2005; Jara and Casas 2006; Cardone et al. 2009; Jara et al. 2012). They are
48
conceptually simple and easy to apply because the dynamic response of the substructure is ignored. While not necessarily the
49
most accurate, they are particularly useful in preliminary design or when verifying the feasibility of seismic isolation for a
50
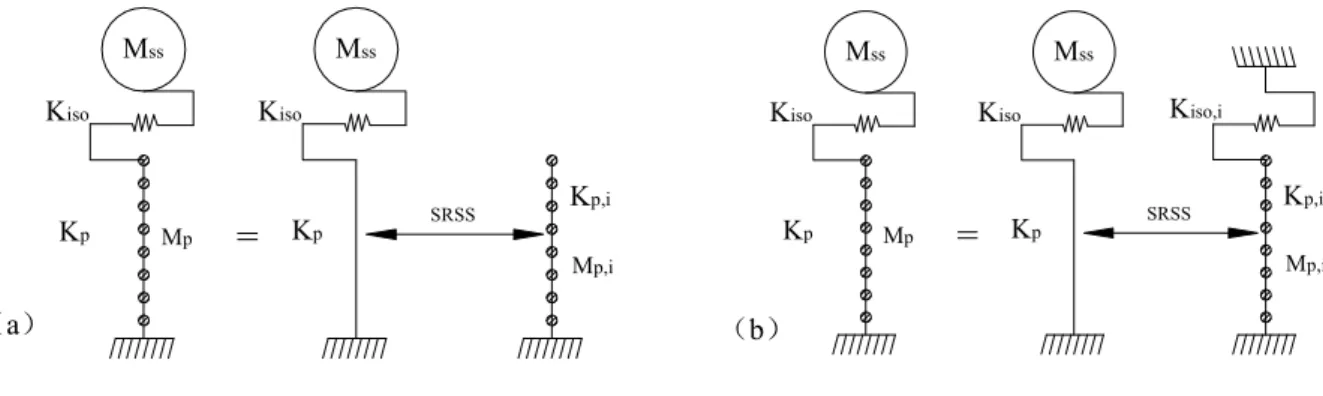
particular bridge. They are therefore generally the starting point in seismic isolation design, followed by more rigorous
51
methods as the bridge design progresses. These simplified analysis methods have been adopted in AASHTO Guide
52
Specifications for Seismic Isolation Design (AASHTO 2014) and CAN/CSA S6-14 Canadian Highway Bridge Design Code
53
(CSA 2014) used in North America.
54
In seismic isolation, the substructure is not isolated from ground motions but is decoupled from the relatively larger
55
mass of the superstructure (Priestley et al. 1996). Therefore, neglecting or approximating the effect of pier masses may lead
3
to a serious underestimation of the total base shears of massive piers, which may be approximately 50% less than the actual
57
seismic force (Reinhorn et al. 1998; Franchin et al. 2001; Buckle et al. 2011). A number of studies have been conducted to
58
extend the application of the simplified methods to a broader range of bridges, and new solutions are continuously being
59
proposed and investigated (Tsopelas et al. 1997; Fadi and Constantinou 2010; Ozdemir and Constantinou 2010; Wei and
60
Buckle 2012; Wei et al. 2013; Al-Ani and Singh 2014). Among these studies, some assumptions are commonly used for the
61
case of bridges with heavy piers, such as modeling a certain percentage of individual pier masses Mp (generally 1/3rd of the
62
total pier masses) and the tributary superstructure mass Mss lumped at the pier top, with the rest of the pier assumed massless.
63
The approach is applied in the design examples included in AASHTO (2014). This assumption is valid for short- to
64
moderate-span isolated bridges, but may exhibit significant limitations for long-span bridges with Mp/Mss ratios above 0.2
65
(Franchin et al. 2001; Adhikari 2010; Wei et al. 2013).
66
This paper proposes an alternative approach in which isolated highway bridges are analyzed as two components with or
67
without interactions. One component includes the superstructure mass, and the other includes the pier masses. The seismic
68
response of the total system is obtained from the square root of the sum of squares (SRSS) of the individual component
69
results. The proposed simplified method considers the actual pier mass and stiffness distributions rather than using a portion
70
of the pier masses as the participating masses. The intent is to extend the range of application of the AASHTO and
71
CAN/CSA S6-14 simplified methods to isolated bridges with massive piers while preserving its simplicity without significant
72
additional computational effort. Time history analysis (THA), multimode spectral analysis (MMSA) and current simplified
73
analysis methods (SM) are first briefly reviewed and compared. The new simplified method is introduced and described. It is
74
shown that the proposed simplified method could be declined in two variants (later labeled E and F in the paper) with
75
progressive modelling refinements to improve accuracy. The proposed simplified method is validated against the results from
76
multimode spectral analysis for a regular 4-span bridge with various substructure mass and stiffness ratios and a 5-span
77
bridge with heavy non-uniform substructure. The method is verified further by nonlinear time history analysis methods for
78
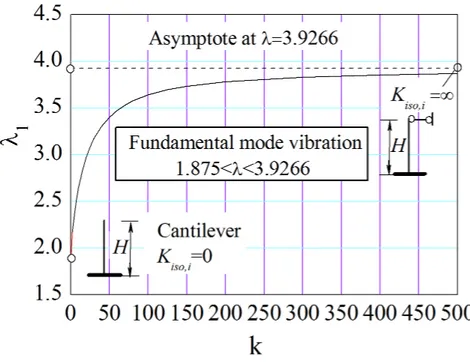
the regular 4-span bridge.
79
Current Analysis Methods of Seismically Isolated Bridges
80
Time History Analysis Methods
81
Time history analysis methods use nonlinear or equivalent linear properties for isolators and are suitable for complex
82
structures when linear spectral methods are inappropriate or explicit modeling of the isolators and energy dissipaters is
4
required to better represent isolation systems that have high levels of damping. For the latter case, nonlinear time history
84
analysis (NLTHA) is generally used. However, these methods require more computational time and largely depend on the
85
ground motion record selection and scaling procedure to match the target spectrum.
86
Multimode Spectral Analysis Methods
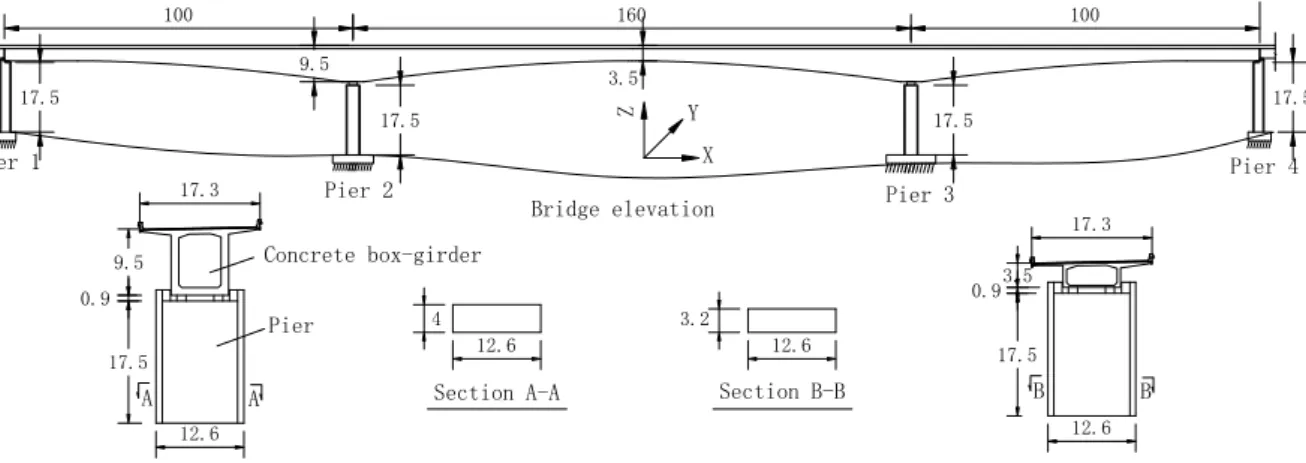
87
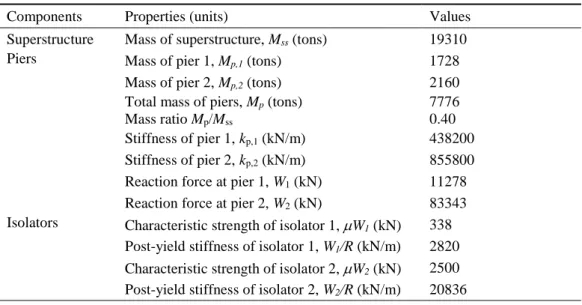
When the Multimode Spectral Analysis (MMSA) is applied to an isolated bridge, an estimate of the design displacement
88
must be made to determine the equivalent linear properties of the isolators. This is followed by iterations if the initial
89
estimate has significant error. The 5 percent damped design spectrum is modified to recognize large amount of damping in
90
the “isolated” modes. This is performed by scaling the spectrum by the damping reduction coefficient, B, for periods longer
91
than 0.8 Teff, where Teff is the effective isolation period, which is calculated by the equivalent linear stiffness and damping
92
properties of the isolators. The 5 percent damped spectrum is used for all other modes in the multimode method.
93
Current Simplified Methods
94
Both THA and MMSA account for the dynamic response of the entire bridge structure, including all components of the
95
superstructure, isolation system, and substructure. In simplified methods, the superstructure is assumed to have a single
96
degree of freedom corresponding to the horizontal displacement, the substructure and isolation system are reduced to a single
97
spring having effective linear stiffness and equivalent damping properties. Figure 1 illustrates different models that have been
98
proposed to perform simplified analysis for seismically isolated bridges.
99
Model A (isolated superstructure only): In this model, the superstructure is modeled as a single-degree-of-freedom
100
(SDOF) system with mass Mss and the piers are assumed infinitely rigid and massless. Thus, all the isolators supporting the
101
superstructure experience the same displacement. The properties of individual isolators are lumped into a single isolator
102
represented by its effective stiffness Kiso. Equivalent damping properties are used to reflect the energy dissipation capacity of
103
the isolation system. The analysis requires iterations as stiffness and damping properties of the nonlinear isolators depend on
104
the structure displacement. The flexibility and mass of the piers are totally ignored in this model (FHWA 2014).
105
Model B (flexible massless piers): Model B improves Model A by taking into account the horizontal stiffness of the
106
piers in the bridge. At every pier, an effective stiffness is determined using the isolator effective stiffness Kiso and the pier
107
stiffness Kp acting in series, and the total effective stiffness of the SDOF system is obtained by summing the effective
108
stiffnesses of the individual piers. Equivalent damping representing energy dissipation of all isolators is also considered.
109
Once the superstructure displacement is known, displacements and forces in each isolator and pier are determined based on
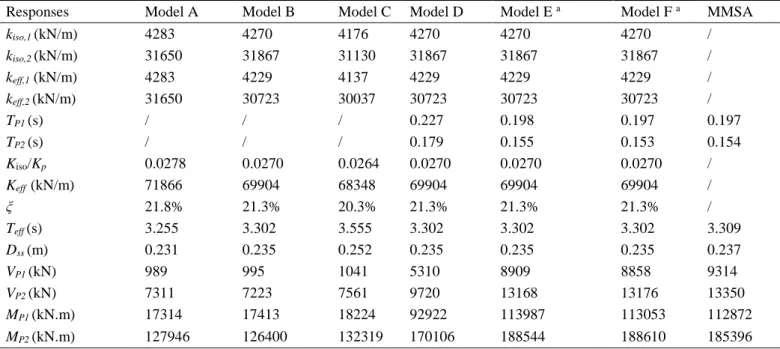
5
their respective stiffness properties. Likewise, the pier masses are not considered. This model has been adopted in North
111
American codes such as AASHTO (2014) and CAN/CSA S6-14 (2014).
112
Model C (flexible piers with lumped 1/3 piers mass at the superstructure level): The masses of piers are taken into
113
consideration by adding one-third of their masses to the superstructure. This transfer of mass increases the period of the
114
system in an unrealistic way, which affects the demand on the isolation system, and the pier shear forces can have substantial
115
errors (Priestley et al. 1996; Cardone et al. 2009; Buckle et al. 2011; Wei and Buckle 2012).
116
Model D (two SDOF systems with lumped 1/3 pier mass at the tops of piers): In this recently proposed model, the
pier-117
isolator-superstructure unit is divided into two SDOF systems. One SDOF system considers only the superstructure mass and
118
the other SDOF considers only the participating mass of the piers, which is assumed to be one-third of the pier masses. The
119
effective stiffnesses of the isolators and piers are assumed equal in the two SDOF systems. The superstructure does not move
120
in the second SDOF system. The results are obtained by combining the superstructure and pier results using the SRSS
121
method (Wei et al. 2013; Al-Ani and Singh 2014).
122
In seismic isolated bridges, the substructure is not isolated from ground motions but merely decoupled from the
123
relatively larger mass of the superstructure. Therefore, the pier base shears and moments contributed by the substructure mass
124
are also important design parameters, in addition to the superstructure displacement. In the above four simplified models, the
125
assumptions of rigid or massless piers or combining the pier mass equal to 1/3 (or a certain percentage) of the total pier mass
126
are valid for bridges with light piers; however, they may lead to serious underestimation of the total base shears and moments
127
in massive piers.
128
Proposed Simplified Method
129
Description and Assumptions
130
Figure 2 shows two new simplified models that are proposed to effectively consider the contributions of the pier masses
131
to base shears and moments in the substructure.
132
Model E (superstructure SDOF system and flexible piers with mass): The whole bridge is modeled with two
133
components: (1) the superstructure mass supported by the isolators and flexible massless piers acting in series at each pier, as
134
in Model B in Fig. 1(b), and (2) flexible piers with distributed mass along their heights. Analysis of the first component
135
permits to obtain the structure displacement, the displacements and forces in the isolators, and pier forces induced by the
136
isolators. The second component is used to determine forces in the piers induced by their seismic responses. While the
6
analysis of the first component is iterative, as described earlier, analysis of the second component is not. The structural
138
responses are obtained by the SRSS of the component results (Leroux 2015). In this model, the piers are free at their top ends
139
in the second component, assuming that the piers are sufficiently stiff compared to the isolators such that their seismic
140
responses are not significantly influenced by the response of the superstructure and isolators.
141
Model F (superstructure SDOF system and flexible piers with mass and top isolators): Model F is identical to Model E
142
except that the effective stiffness of the isolators is introduced at the top of the piers in the second component. Parameters
143
kiso,i and kp,i are effective stiffnesses of individual isolator and pier. Parameters Kiso (Kiso=kiso,i) and Kp (Kp=kp,i) represent
144
the total effective lateral stiffnesses of the isolators and piers, respectively. The ratio of the total effective stiffnesses of the
145
isolators to that of the piers varies depending on the simplified model used. The dynamic responses of the piers, including
146
vibration periods and forces, are therefore influenced by the lateral restraint imposed by the isolators. After the analysis of the
147
superstructure (first model component) is completed, individual piers are analyzed linearly using the isolators effective
148
stiffnesses obtained from the superstructure analysis. Iterations are therefore not needed for the analysis of the piers. The
149
final results are obtained by combining the results of the components using SRSS.
150
Analysis Methodology for Proposed Models E and F
151
For Models E and F, the analysis of the superstructure with isolators and massless piers (first model component) is
152
performed using an equivalent SDOF system and an iterative approach, as currently specified in AASHTO and CAN/CSA
153
S6-14 codes. A value is initially assigned to the superstructure displacement Dss. The effective linear stiffnesses of the
154
isolators are determined from this displacement, which allows for the calculation of the system effective stiffness and
155
equivalent damping properties. Using these values, a new displacement is obtained from the design spectrum and the process
156
is repeated until convergence is reached. Forces in each pier are obtained using their individual effective stiffnesses. The
157
method is summarized herein for a bridge isolated with isolators exhibiting bilinear load-deformation response defined by the
158
initial elastic stiffness ke, the characteristic strength, Qd, and the post-yield stiffness kd, as will be used in the examples
159
presented later. For this structure, the displacement in the isolator at pier i is obtained from:
160
, , , , , p i ss d i iso i d i p ik D
Q
D
k
k
(1)161
where kp,i is the lateral stiffness of the pier. The force and effective stiffness of the isolator can then be determined:
162
, , , ,
iso i d i d i iso i
F Q k D (2)
7
, , , iso i iso i iso iF
k
D
(3)164
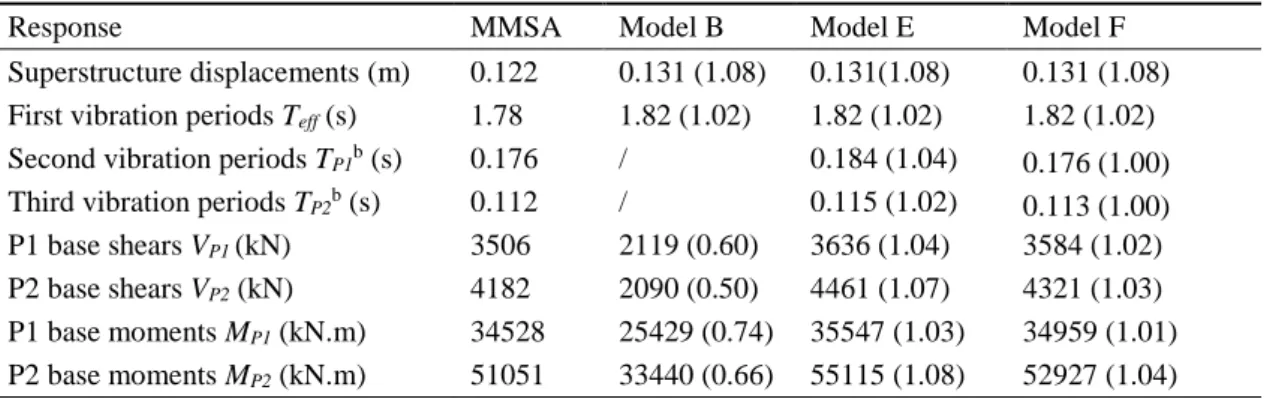
The effective stiffness of each pier keff,i is the combined stiffness of the pier and the isolator acting in series:
165
, , , , , iso i p i eff i iso i p ik
k
k
k
k
(4)166
The effective period of the SDOF system,
T
eff, is then given by:167
2
ss eff effM
T
K
(5)168
where Mss is the superstructure mass and Keff is the total effective lateral system of the SDOF system:
K
eff
k
eff i, .169
The new superstructure displacement,Dss, is computed from:
170
0.3 ( ) , where 0.05 d eff ss S T D B B
(6)171
In this equation, Sd(Teff) is the 5% damped displacement spectral value for the site at the period Teff, is the damping
172
reduction coefficient and
is the equivalent damping ratio for the bridge-isolator system. The latter is obtained from the total173
energy dissipated per cycle by all isolators, EDC, when the structure oscillates at the displacement Dss:
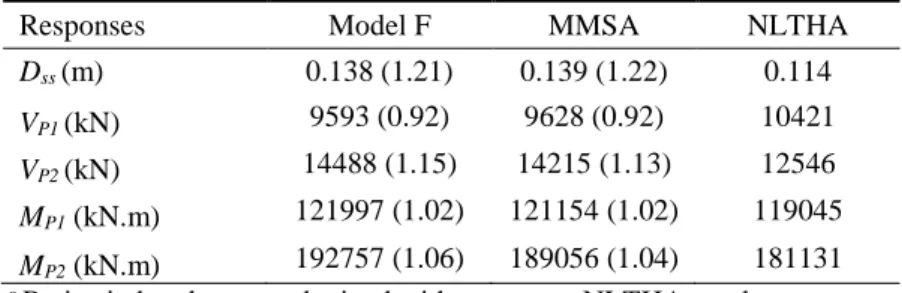
174
2 2 eff ss EDC K D
(7)175
The new displacement Dss is used in subsequent iterations until convergence is achieved. Forces Fp,i at the top of each
176
pier are then computed to determine shears and bending moments in the piers due to the superstructure displacement:
177
, ,
p i eff i ss
F
k
D
(8)178
Analysis of the second component of Models E and F is performed to obtain the additional shears and bending moments
179
in the piers due to the dynamic seismic response of the piers themselves. Elastic models of the piers are established using the
180
actual mass and stiffness distribution of each pier. For Model F, the effective stiffness of each isolator kiso,i is taken equal to
181
the value obtained in the last iteration of the superstructure analysis. Using the 5% damped acceleration spectrum at the site,
182
the individual piers are elastically analyzed using the modal response spectrum method, from which the internal forces of
183
individual piers can be obtained. Forces in the isolated bridge are then obtained by combining the results of the superstructure
184
and piers using the SRSS method.
8
Typically, the seismic demand on individual piers can be obtained from their first mode response. For a single pier with
186
uniform stiffness and mass properties, the fundamental period is given by Eq. (9). For Model E,
1 = 1.875. For Model F,187
1
is the minimum positive root of the frequency equation given by Eqs. (10) and (11) (Karnovsky and Lebed 2000):188
2 1 1 2 1 2 2 c cr E I T m H
(9)189
31 cos cosh
sinh cos
sin cosh
k
(10)190
3 , iso i c crk
H
k
E I
(11)191
where m is the pier mass per unit length, H is the pier height, Ecis the modulus of elasticity, Icr is the effective inertia
192
moment of the pier in the vibration direction, and
k
iso i, is the effective stiffness of the isolator. Alternatively, using the value193
of k from Eq. (10),
1 can be determined from Fig. 3.194
The first mode shape 1(x) is computed as follows.
195
1 1
1 1 1 1 1
1 1
sin
sinh
( )
sinh
sin
(cosh
cos
)
cos
cosh
x
x
x
x
x
H
H
H
H
(12)196
where
x
is the distance from the pier base. Thus, the fundamental period and mode shape of the pier with uniform mass197
and stiffness can easily be computed, and the analysis of the pier component is simple. Later in the paper, accuracy of using
198
single mode pier response is verified against the solution obtained with the MMSA method. For more complex pier
199
geometries, multimode pier response can be computed using a structural analysis program.
200
Range of Validity for Different Simplified Methods for a Regular Bridge Structure
201
Bridge Model and Seismic Input
202
The bridge selected in this study is representative of regular multi-span highway bridges with continuous superstructure,
203
prestressed concrete box girders with symmetrical geometry and four piers of equal height. The geometry and dimensions of
204
the piers and superstructure are illustrated in Fig. 4. The piers have uniform rectangular cross-sections with a width of 12.6 m.
205
The piers at intermediate supports are however thicker (4 m) compared to those at the bridge ends (3.2 m). The girder depth
206
varies from 9.5 m at the intermediate supports to 3.5 m at the midspan as a parabolic curve. The mass properties of the
9
superstructure and separate components are given in Table 1. For this bridge, the Mp/Mss ratio is 0.40. With such a high mass
208
ratio, the bridge would classify as a bridge with “massive piers” (Buckle et al. 2011; Wei et al. 2013; Al-Ani and Singh 2014).
209
Table 1 also gives the lateral stiffness properties of the piers, kp,i. Herein, a reduced flexural stiffness is taken equal to 0.7
210
EcIg , where Ig is the moment of inertia of the gross, uncracked cross-section, as recommended for reinforced concrete
211
members when only a moderate amount of cracking and no plastic hinging is expected (ATC 1996). As shown, pier 2 is 25%
212
more massive and approximately twice as stiff as pier 1. A more rigorous approach to define the cracked flexural stiffness,
213
EIcr, is to perform a nonlinear moment-curvature reinforced concrete cross-section analysis to compute the cracking moment,
214
Mcr, and identify EIcr. However, nonlinear cross-section analysis is deemed unnecessary while using the proposed simplified
215
analysis method in preliminary design.
216
The bridge is isolated at every pier for the seismic demand along the longitudinal direction and the Friction Pendulum
217
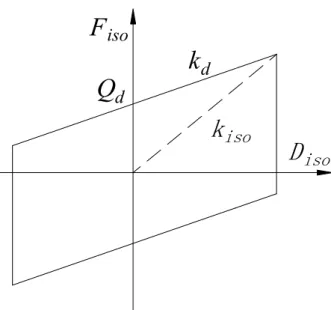
System (FPS) is selected for the seismic isolators. The force-displacement hysteresis loop for FPS isolators is shown in Fig. 5.
218
The characteristic strength of the isolator is the force at initiation of slip (Diso = 0), i.e, Qd = μW, whereas the post-yield
219
stiffness, kd, is equal to W/R. The initial stiffness ke is assumed infinite. The horizontal force Fiso, at any displacement Diso can
220
then be obtained from (Earthquake 1999; Dicleli and Mansour 2003):
221
iso isoW
F
W
D
R
(13)222
In the SM and MMSA analyses, the effective isolator stiffness kiso is used and the equivalent viscous damping ratio of
223
the system,
, is obtained to reflect the energy dissipation of the isolators. The effective stiffness of the isolator is obtained224
by dividing the maximum horizontal force by the maximum isolator displacement, Diso.
225
iso isoW
W
k
D
R
(14)226
For FPS isolators, the energy dissipated per cycle corresponds to the area enclosed by the hysteresis loop: EDC = 4 μW
227
Diso. The total value of EDC for the bridge is used in Eq. 7 to determine
of the equivalent linear system.228
The radius R and friction coefficient μ of the isolators at all piers are chosen as 4 m and 0.03 respectively, and the main
229
parameters for the isolators are given in Table 1. As shown, the resistance and post-yield stiffness of the isolators at the
230
interior piers are much larger than at the exterior piers due to the differences in vertical reactions between the two piers.
231
The bridge is assumed to be located on a class C site in Vancouver, British Columbia, and the design of the isolation
232
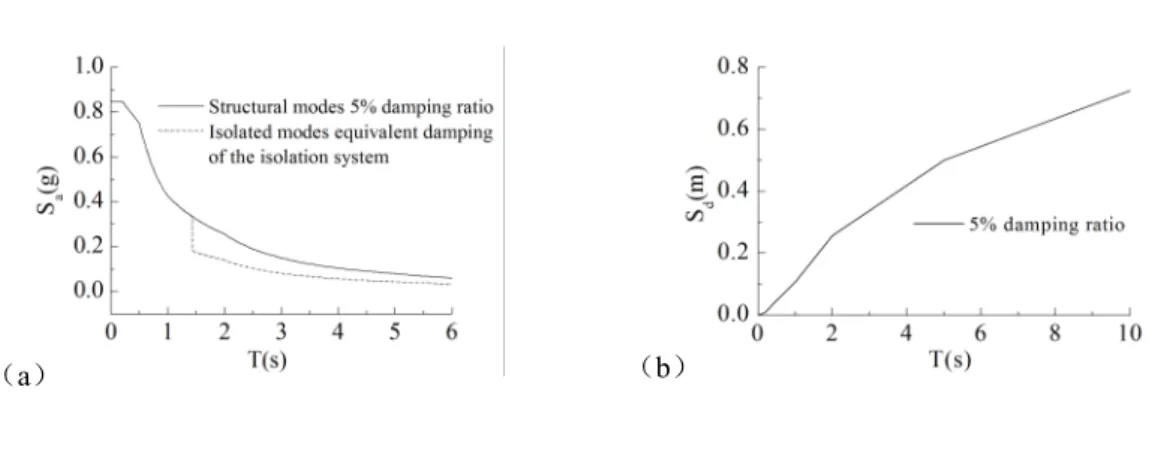
system is performed in accordance with CAN/CSA S6-14. In CAN/CSA S6-14, the design seismic input is represented by the
10
5% damped uniform hazard acceleration response spectrum (UHS) established for a probability of 2% in 50 years. The
234
acceleration spectrum and corresponding displacement spectrum are plotted in Fig. 6. The peak ground acceleration for this
235
site and same hazard level is PGA=0.369 g.
236
When the bridge is analyzed with Simplified Methods using Models A to F, the displacement spectrum shown in Fig.
237
6(b) is used to determine the bridge displacement. The 5% damped response spectrum of Fig. 6(a) is used for the analysis of
238
the second component of Models E and F. When a MMSA is conducted, the 5% damped acceleration spectrum (Fig. 6a) is
239
used except that it is modified for larger damping in the fundamental mode of vibration introduced by the isolators. This
240
modification is performed by dividing all spectral acceleration values at periods longer than 0.8 times the effective period of
241
the bridge, Teff, by the damping reduction factor, B obtained with the equivalent viscous damping ratio from Eq. (7).
242
Simplified Methods versus Multimodal Spectral Analysis
243
For Model A, the effective stiffness at each pier is taken equal to the effective stiffness of the isolator at that pier. For
244
Model B, the effective stiffness of the bridge system is derived by combining the isolator and pier stiffnesses in series. For
245
Model C, the superstructure mass is increased by 1/3 of the pier masses compared to the method used in Model B. For
246
Models D, E, and F, the first component is the same as that used in Model B. In the second component of Models D and F,
247
the effective stiffness of the isolators is equal to that obtained in the first component and only the first mode response of the
248
piers is considered. The main difference between Models D and F is that Model D lumps 1/3 of all pier masses on the top of
249
the pier, whereas Model F uses the actual pier mass distribution. Table 2 gives the results obtained from Models A to F.
250
Detail of the calculations for Models E and F is given in Appendix I.
251
When MMSA is used, the analysis of the bridge is conducted with a 3D MDOF model of the bridge using the
finite-252
element structural analysis software SAP2000 (CSI 2014). The superstructure is modeled using 3D beam elements, which are
253
divided into a number of segments, and its mass is lumped at each nodal point connecting the segments. The superstructure
254
mass is assigned only to the horizontal degree of freedom of the nodes to avoid triggering insignificant modes of vibration
255
that are not useful in the analysis because only the seismic response in the longitudinal direction is considered in this study.
256
Each pier is also modeled with beam elements, and their tributary masses are lumped at the nodes connecting each segment.
257
Likewise, for each pier node, the pier mass is assigned only to the horizontal degree of freedom. In the MMSA, effective
258
linear springs and equivalent viscous damping are used to represent the isolators. The model is iteratively analyzed to obtain
259
final estimates of the superstructure displacement and the required effective properties of each isolator. The results from the
11
simplified Model A are used to determine the initial values for the effective damping and stiffness of the isolators to initiate
261
the iterative process. Table 2 also gives the results of the MMSA, which are used as the reference solutions.
262
Figure 7 illustrates the comparisons of the isolated periods, superstructure displacements, and shear forces and bending
263
moments at pier bases from all models. The SM results are all normalized by the MMSA results. Due to symmetry, only the
264
forces in piers 1 and 2 are plotted.
265
According to Table 2 and Fig. 7, there are no significant differences regarding periods and displacements among the
266
various models, except for Model C which overestimates the isolated period and superstructure displacement. Conversely,
267
the accuracies of the pier base shears and moments vary dramatically for different models. Models E and F provide very
268
accurate results for both piers. Models A to C significantly underestimate the shears and moments at pier bases, especially for
269
pier 1 for which the minimal ratio with the MMSA is approximately 0.1. Although Model D gives better approximations
270
compared to those of models A-C, it still exhibits large discrepancies compared to the MMSA. Therefore, for this particular
271
bridge structure, Models E and F are capable of yielding accurate results for predicting the reference values from the MMSA.
272
For this bridge with massive piers, the ratio of the total effective stiffnesses of the isolators (Kiso = kiso,i) to that of the
273
piers (Kp = kp,i) varies between 0.0273 to 0.0279 depending on the model used. This small ratio indicates that the piers are
274
relatively very stiff and the isolators at the top of the piers do not affect much the dynamic response of the individual piers
275
(piers can vibrate under the superstructure as independent structures). This is why Models E and F give almost equal
276
results. However, this is not always valid. When the piers are not so stiff, differences exist, and omitting the isolator stiffness
277
at the pier tops in Model E may decrease the accuracy of this model, as will be shown in the next section.
278
Influence of Bridge Stiffness and Mass Properties on the Accuracy of Simplified Methods
279
To assess and compare the accuracy of the different simplified models A to F under a number of mass ratios and
280
stiffness ratios, SMs and MMSAs were performed on the same bridge structure with Mp/Mss ratios ranging from 0.05 to 0.60
281
and Kiso/Kp ratios ranging from 0.03 to 0.36. These ratios were obtained by changing the pier masses and pier stiffnesses
282
independently. In the process, the relative mass and stiffness properties between piers 1 and 2 were preserved and the
283
properties of the isolators remained unchanged. The ranges of mass and stiffness ratios were selected to be reasonable for
284
seismically isolated bridges (Wei et al. 2013; Al-Ani and Singh 2014). The results of this comprehensive parametric analysis
285
were used to identify the ratios at which the assumptions of rigid or massless piers or lumping the pier masses equal to 1/3rd
286
of the total pier masses cause significant unconservatism. The acceptance criterion for a simplified method of seismically
287
isolated bridges is typically limited to within 0.9-1.1 of the reference MMSA values.
12
Figure 8 compares the seismic responses from Model A to the results from MMSA for the different mass and stiffness
289
ratios. For all mass ratios, superstructure displacements Dss and effective periods Teff from Model A can provide good
290
estimates of superstructure displacements and first-mode periods T1 when Kiso/Kp ≤ 0.15. When the pier is more flexible
291
compared to the isolation system, both the displacements and effective periods are underestimated using Model A. In Figs. 8c
292
and 8e, for all mass and stiffness ratios, Model A considerably underestimates the base shears and moments at the more
293
flexible pier 1. The situation is less critical for the stiffer and more massive pier 2 as Model A predicts reasonable and even
294
conservative force demands for small mass ratios and high stiffness ratios. For this pier, shears are however underestimated
295
when Mp/Mss > 0.15 to 0.24 and moments are underestimated when Mp/Mss > 0.2 to 0.5. For both piers, the errors are also less
296
pronounced for bending moments compared to shears. Nevertheless, Model A is therefore not appropriate for designing
297
bridges with massive piers.
298
Figure 9 compares the seismic responses from Model B to those from MMSA. This model can better predict the
299
superstructure displacements and first periods because pier flexibility is taken into account in the calculations. For all mass
300
ratios and stiffness ratios, the accuracies of displacements and first periods are within the acceptance range of 0.9-1.1.
301
However, similar to Model A, Model B significantly underestimates the shears and moments in pier 1 and generally give
302
non-conservative force estimates for pier 2, except for small mass ratios, less than approximately 0.15 for shears and 0.20 for
303
moments. Exact limits also depend on the stiffness ratio. Model B is still not appropriate for designing bridges with massive
304
piers.
305
The seismic responses from Model C is examined in Fig. 10. This model consistently overestimates the superstructure
306
displacements and first mode periods for all stiffness ratios and mass ratios. The errors increase as the mass ratio is increased
307
or the stiffness ratio is decreased. Like Model B, the pier shear forces and moments are substantially underestimated for
308
larger stiffness and mass ratios. For the base shears in pier 2, the mass ratios (Mp/Mss) must still be limited to within 0.15 to
309
meet the acceptance criteria for all stiffness ratios. That limit can be extended to 0.2 for bending moments.
310
Figure 11 presents the base shears and moments from Model D. For this model, the superstructure displacements and
311
first periods are similar to those from Model B. As shown in the figure, Model D yield better predictions of shears and
312
bending moments in both piers. For pier 1, however, both the base shears and bending moments are still underestimated for
313
all stiffness and mass ratios. In pier 2, acceptable shears and moment estimates are obtained when Mp/Mss ≤ 0.20 and Mp/Mss
314
≤ 0.50, respectively, regardless of the stiffness ratio.
13
The seismic responses from Model E are given in Fig. 12. In Models E and F, the first component of the model
316
corresponds to Model B and the structure displacements and effective periods are therefore same and correspond well to the
317
MMSA predictions shown in Fig. 9. These comparisons are not repeated here. In Figs. 12 (a) and (b), the fundamental
318
periods of the individual piers in the model second component, Tp1 and Tp2, are compared to the periods corresponding to the
319
fundamental modes of these piers in the 3D structure model (T2 and T3). As shown, periods Tp1 and Tp2 are longer than their
320
3D model counterparts because the stiffness of the isolators is not included at the top of the piers in the model second
321
component. Overall, Model E gives relatively accurate estimates of the forces acting in the piers. As shown, shears and
322
moments are generally on the conservative side and generally less than 1.10 times the values obtained from MMSA. Values
323
in excess of this limit are obtained for the structures with larger Kiso/Kp values.
324
The results from proposed Model F are compared to those from MMSA in Figure 13. For this model, the periods of the
325
individual piers match very well those obtained from the structure 3D model because isolator stiffness is considered at the top
326
end of the piers. The model also gives very accurate predictions of the base shears and moments as the ratios for all seismic
327
forces are within the 0.9-1.1 range for all the stiffness ratios and mass ratios considered in the study. When compared to
328
Model E, improvements in predictions are attributed to the better representation of the boundary conditions for the individual
329
piers in the model second component. Thus, Model F can be safely used for both initial and final designs of regular
330
seismically isolated bridges with Kiso/Kp ≤ 0.36 and Mp/Mss ≤ 0.60.
331
Generalization Considering an Irregular Bridge Structure with Different Pier Heights
332
In this section, a bridge with non-prismatic massive piers having different heights is selected to verify the accuracy of
333
the proposed models E and F. As in the previous example, the bridge is assumed to be located on a site class C in Vancouver,
334
BC, and its seismic response is examined in the longitudinal direction. For such a bridge with complex pier geometries,
335
analytical solutions of the dynamic characteristics of the piers are not available. The stiffness properties of the piers (kp,i) for
336
the model first component and the seismic force demands on individual piers for the model second component are therefore
337
obtained from finite element (FE) analysis of the piers. As the analysis of the individual piers is linearly elastic and no
338
additional iteration is required, using the simplified method with Models E and F is still much simpler than MMSA.
339
Description of the Bridge
340
The geometry of the multi-span continuous girder bridge considered in this section is given in Fig. 14. The bridge has
341
five 50 m spans with a superstructure composed of a multi-cellular steel girder supported on four intermediate V-shaped
14
concrete piers and two abutments at the ends. The bridge is symmetrical with respect to its mid-length. As shown, piers 1 and
343
4 are 12 m high whereas piers 2 and 3 are 16 m high. The elevation of the 16 m tall piers is illustrated in the figure. The total
344
weight of the superstructure is W=79547 kN, with moments of inertia about the strong and weak axes of Iy=87.57 m4 and
345
Ix=1.37 m4, respectively, and a modulus of elasticity of E=200 GPa. As in the previous example, the flexural stiffness of the
346
pier was obtained using 70% of the gross section stiffness of the piers to account for concrete cracking. In the longitudinal
347
direction, the lateral stiffnesses of individual piers 1 and 2 are 415973 kN/m and 208030 kN/m, respectively. The two
348
abutments are assumed to be infinitely stiff. The total mass of the piers and abutments is 0.32 times the mass of the
349
superstructure.
350
The seismic isolators at each pier and abutment are composed of two identical High Damping Rubbers (HDR) which are
351
assumed to exhibit a bilinear hysteretic force-displacement curve as shown in Fig. 15. For this example, the total values of
352
parameters ke, Qd, and kd, for the two isolators at each support are 71451 kN/m, 1377 kN, and 5880 kN/m, respectively.
353
The 3D finite element model used in MMSA and NLTHA is shown in Fig. 16. The superstructure and piers are expected
354
to remain within the linear elastic range and were modeled as linear elastic beam-column elements. As for nonlinear isolators,
355
link elements are selected to represent the effective linear stiffnesses in MMSA. In NLTHA, links exhibiting bi-linear
356
responses were used. Modeling of the piers in Models B, E and F was identical as was used in the 3D bridge model.
357
Comparisons of Results from Model B, Proposed Models E and F and MMSA
358
The purpose of this paper is to extend the range of application of simplified models currently used in relation to
359
AASHTO and CAN/CSA S6-14. Model B has been most often adopted when a simplified design method is used. Our
360
previous results from a regular highway bridge show that Models A, C and D are not appropriate for designing bridges with
361
massive piers. However, Models E and F are able to improve significantly result accuracy as compared to Model B.
362
Therefore, to further confirm the applicability of the proposed models (E, F) in a bridge with complex piers, only results from
363
Models B, E, and F are compared in this section of the paper. At the end of the iterative procedure with Model B, kiso,1 =
364
16797 kN/m, kiso,2 = 17243 kN/m, Teff = 1.82 s, = 33%, and the superstructure displacement is 0.131 m. With these values,
365
the stiffness ratio for the bridge considering only piers 1 to 4 is 0.08. The results obtained from Model B and proposed
366
Models E and F are compared with the reference results from the MMSA in Table 3. As for the previous bridge structure,
367
Model B provides a good estimate of the structure displacement and effective period but under-predicts shears and bending
368
moments at the bases of the piers. Conversely, Models E and F give displacement, period and pier force estimates that are in
369
the range of 1.02-1.08 and 1.00-1.08, respectively. For such a bridge, with different pier heights and complex pier geometry,
15
the simplified method using proposed Models E and F can therefore provide good accuracy and simplicity compared to the
371
relatively complex MMSA.
372
Comparisons of Results from Simplified Methods and NLTHA
373
In the preceding sections, the responses from the simplified methods have been compared with the results of MMSA.
374
While MMSA can account for the contribution of higher vibration modes, there are some approximations in this method,
375
such as (1) the equivalent linearization of isolators and (2) modal combination methods (SRSS, CQC). To better assess the
376
validity of Models E and F, the results from these methods are compared to those obtained from nonlinear time history
377
analysis (NLTHA) for the regular 4-span bridge studied earlier. A horizontal ground motion accelerogram recorded at the
378
Coyote Lake Dam station during the 1989 Mw 6.93 Loma Prieta earthquake is used. This acceleration time history and
379
corresponding response spectrum are illustrated in Fig. 17. As shown, this record was selected because it matches well the
380
design spectrum in the period range of interest. Nevertheless, in order to eliminate differences between spectral based
381
analysis methods and NLTHA due to dissimilarities between spectral shapes and effects of ground motion scaling, the
382
simplified analysis with Model F and the MMSA were performed using the ground motion spectrum rather than the design
383
spectrum.
384
Numerical integration in NLTHA was performed using the Newmark-Beta approach with a constant time step of 0.005 s.
385
Rayleigh damping corresponding to 5% of critical in the mode associated with was considered. As explained in the CSI
386
Analysis reference manual (CSI 2014), the damping matrix for element j is computed as follows:
387
j m j k j
C
c M
c K
(15)388
where cm and ck are the mass and initial (elastic) stiffness-proportional damping coefficients, Mj is the mass matrix
389
and Kjis the initial stiffness matrix. During the NLTHA, problems associated with inaccurate damping forces and the
390
inelastic softening of nonlinear isolators are solved by transferring stiffness-proportional damping from the dynamic load
391
case, for the entire structure, to the materials of individual components. This is performed as follows: (1) in the time-history
392
load case, the cm value is kept, but ck becomes zero; and (2) for all elastic materials (superstructure and piers), ck is set to
393
the initial elastic value. The energy dissipation of seismic isolators is then considered only based on its nonlinear
force-394
displacement hysteretic actions.
395
The seismic responses from the simplified method with Model F and from MMSA are compared with the reference
396
results from the NLTHA in Table 4. The results from Model F and MMSA are different from those given in Table 2 because
16
the analyses were performed using the ground motion spectrum. As was observed when using the design spectrum, both
398
methods here give very similar results. As discussed previously, Model F and MMSA give very similar results. When
399
compared to NLTHA, Models F and MMSA over-predict the superstructure displacement by approximately 20%. However,
400
both approaches predict pier base shears and moments that are within 0.90-1.15 times the results from NLTHA. The
401
maximum errors are for the base shear in pier 2 which is also over-estimated by a greater margin (15% for Model F and 13%
402
for MMSA). These differences are mainly due to the simplification made when using an equivalent linear system is used in
403
spectral based method to predict the response of a structure that includes a nonlinear isolation system. Hence, for this
404
particular bridge, the simplified method with Model F yields satisfactory approximations compared to the rigorous NLTHA
405
method.
406
Conclusions
407
Two enhanced models are proposed and validated for the application of the simplified method specified in North
408
American codes for the seismic analysis of isolated highway bridge structures with massive substructures. In the first model,
409
“Model E”, the bridge is divided into two independent components: a first component which is an equivalent SDOF system
410
that includes the superstructure, the isolators, and the flexible massless piers, and the second component which includes the
411
flexible massed piers. “Model F” is identical to Model E except that the stiffness of the isolators is added at the top of the
412
piers in the second component. In both models, the first component corresponds to the model already described in the 2014
413
AASHTO and CAN/CSA S6-14 standards for the simplified analysis method. Seismic analysis results from both components
414
are combined using the SRSS method. The applicability of the two models was verified for regular and irregular bridges
415
having ratios of the masses of piers to the mass of the superstructure, Mp/Mss, between 0.05 and 0.6 and ratios between the
416
isolators stiffness and piers stiffnesses, Kiso/Kp, varying between 0.03 to 0.36. Results from the two models were compared to
417
those obtained from multimode spectral and nonlinear time history analyses. The following conclusions can be drawn from
418
this study:
419
The simplified analysis methods using currently available Models A to D generally give good estimates of the
420
superstructure displacements and first-mode effective periods. However, for most of the bridges analyzed, they underestimate
421
the shear and moment demands at the pier bases, with the errors being more important when the mass ratio Mp/Mss is
422
increased and the stiffness ratio Kiso/Kp is decreased.
423
Proposed Models E and F both yield improved shear and moment predictions for the separate components. For the
424
bridges studied, Model E gives predictions higher than 0.9 times the results from multimode spectral analysis but can result
17
in overly conservative force demands for bridges with larger stiffness ratios. This excessive conservatism is mitigated when
426
using Model F. In addition, Model F is found to give satisfactory predictions of pier base shears and moments compared to
427
those from rigorous nonlinear time history analysis. In view of the small added computational complexity of Model F
428
compared to Model E, Model F is thus recommended to achieve safe and cost-effective solutions.
429
Acknowledgements
430
This research was supported by the Key Consulting Project of Chinese Academy of Engineering (Grant no.
2016-XZ-431
13). The authors would like to acknowledge financial support from the China Scholarship Council (CSC) and the Natural
432
Sciences and Engineering Research Council of Canada (NSERC).
433
References
434
AASHTO. (2014). Guide specifications for seismic isolation design, 4th Edition, Washington, D.C., USA.
435
Adhikari, G., Petrini, L., and Calvi, G.M. (2010). “Application of direct displacement based design to long span bridges.”
436
Bulletin of Earthquake Engineering, (8): 897-919.
437
Al-Ani, M., and Singh, C. (2014). “Influence of substructure properties on analysis and design of seismically-isolated
438
bridges.” Proc., 9th Austroads Bridge Conf., Sydney, New South Wales, Australia.
439
Applied Technology Council (ATC). (1996). Seismic Evaluation and Retrofit of Concrete Buildings, Redwood City, Calif.,
440
USA.
441
Buckle, I.G., Al-Ani, M., and Monzon, E. (2011). Seismic isolation design examples for highway bridges. Technical Rep. No.
442
NCHRP Project 20-7-Task 262, National Cooperative Highway Research Program, Washington, D.C., USA.
443
Buckle, I.G., Constantinou, M., Dicleli, M. and Ghasemi, H. (2006). Seismic isolation of highway bridges. Technical Rep. No.
444
MCEER-06-SP07, State Univ. of New York at Buffalo, Buffalo, N. Y., USA.
445
Cardone, D., Dolce, M., and Palermoa, G. (2009). “Evaluation of simplified methods for the design of bridges with seismic
446
isolation systems.” Earthquake Spectra, 25(2), 221-238.
447
Constantinou M. C., Kalpakidis I., Filiatrault A., and Ecker Lay R.A. (2011). LRFD-Based analysis and design procedures
448
for bridge bearings and seismic isolators. Technical Rep. No. MCEER-11-0004, State Univ. of New York at Buffalo,
449
Buffalo, N. Y., USA.
450
CSA (2014). “Canadian highway bridge design code”, CAN/CSA-S6-14, Canadian Standards Association (CSA), Rexdale,
451
Toronto, Canada.
18
CSI (2014). SAP2000: Integrated finite element analysis and design of structures basic analysis reference manual.
453
Computers and Structures Inc., Berkeley CA., USA.
454
Dicleli, M., and Mansour, M. (2003). “Seismic retrofitting of highway bridges in Illinois using friction pendulum seismic
455
isolation bearings and modeling procedures.” Eng. Struct., 25(9):1139-1156.
456
Dicleli, M., Mansour, M. Y., and Constantinou, M. C. (2005). “Efficiency of seismic isolation for seismic retrofitting of
457
heavy substructured bridges.” ASCE J. Bridge Eng., 10(4), 429-441.
458
Earthquake Protection Systems Inc. (1999). Friction pendulum seismic isolation bearing: Details and specifications for
459
bridges. Richmond, Calif., USA.
460
Fadi, F., and Constantinou, M. C. (2010). “Evaluation of simplified methods of analysis for structures with triple friction
461
pendulum isolators.” Earthquake Engng Strut. Dyn., 39(1), 5-22.
462
Federal Highway Administration (FHWA). (2014). LRFD seismic analysis and design of bridges reference manual.
463
Publication No. FHWA-NHI-15-004, U.S. Dept. of Transportation, Washington, D.C., USA.
464
Feng, M. Q., and Lee, S. C. (2009). Determining the effective system damping of highway bridges. Rep. No.
CA-UCI-2009-465
00, Univ. of California, Irvine, Calif., USA.
466
Franchin, P., Monti, G., and Pinto P. E. (2001). “On the accuracy of simplified methods for the analysis of isolated bridges.”
467
Earthquake Engng Strut. Dyn., 30: 363-382.
468
Guyader, A. C., and Iwan, W. D. (2006). “Determining equivalent linear parameters for use in a capacity spectrum method of
469
analysis.” ASCE J. Struct. Eng., 132(1), 59-67.
470
Hwang, J.S., Chang, K.C., and Tsai, M.H. (1997). “Composite damping ratio of seismically isolated regular bridges.” Eng
471
Struct, 19(1), 55-62.
472
Jara, M., and Casas, J. R. (2006). “A direct displacement-based method for the seismic design of bridges on bi-linear
473
isolation devices.” Eng Struct, 28(6), 869-879.
474
Jara, M., Jara, J. M., Olmos, B. A., and Casas, J. R. (2012). “Improved procedure for equivalent linearization of bridges
475
supported on hysteretic isolators.” Eng Struct, 35, 99-106.
476
Karnovsky, I.A., and Lebed, O.I. (2000). Formulas for Structural Dynamics: Tables, Graphs and Solutions.. McGraw Hill Inc.
477
New York, USA.
478
Leroux, M. (2015). Seismic isolation: A study of inertial forces in bridge’s piers. Master of Engineering thesis, Ecole
479
Polytechnique de Montreal, Quebec, Canada (in French).
19
Ozdemir, G., and Constantinou, M. C. (2010). “Evaluation of equivalent lateral force procedure in estimating seismic isolator
481
displacements.” Soil Dyn. Earthquake Eng., 30(10), 1036-1042.
482
Priestley, M. J. N., Seible, F., and Calvi, G. M. (1996). Seismic design and retrofit of bridges. Wiley, New York, USA.
483
Reinhorn, A. M., Simeonov, V. K., DeRue, G., and Constantinou, M. C. (1998). Sensitivity of response of isolated bridges to
484
modeling and design parameters: A case study. Technical Rep. No. 98-0015, Columbia Univ., New York, USA, 213-223.
485
Tsopelas, P., Constantinou, M. C., Kircher, C. A., and Whittaker, A. S. (1997). Evaluation of simplified methods of analysis
486
for yielding structures. Technical Rep. No. NCEER-97-0012, State Univ. of New York at Buffalo, Buffalo, N. Y., USA.
487
Wei, C., and Buckle, I.G. (2012). “A simplified method of analysis of isolated bridge with yielding substructure.” Proc.
488
Structures Congress, ASCE, Chicago, USA, 559-570.
489
Wei, C., Al-Ani, M., and Buckle, I.G. (2013). “An improved simplified method for the analysis of seismically isolated
490
highway bridge with heavy substructure.” Proc., 7th National Seismic Conf. on Bridges and Highways, Oakland, CA,
491
USA, 1-7.
492
Appendix I. Manual calculation examples using Models E and F
493
This appendix provides detail of the calculations of the shear forces and moments at the base of pier 2 of the regular
4-494
span bridge in Fig. 4 using the simplified method with Models E and F. The final results of the calculations presented herein
495
are summarized in Table 2, and the accuracy of Models E and F is verified against MMSA results in Fig. 7. Properties of the
496
piers and Model B used for the superstructure analysis (model first component) are given first. For each model, analysis of
497
individual pier 2 (model second component) is then described and the results are combined with those from Model B analysis.
498
Properties of the Piers
499
Piers heights: H1 = H2 = 17.5 m
500
Distributed mass of the piers: mp,1 = 98.7 tons/m; , mp,2 = 123.4 tons/m
501
Modulus of elasticity of concrete: Ec = 3.25x10⁷ kPa
502
Moment of inertia of the gross section of the piers: Ig,1 = 34.4 m4; Ig,2 = 67.2 m4
503
Lateral stiffness of the piers:
504
pier 1: 0.7EcIg,1 = 0.7x3.25x107x34.41 = 0.783x10⁹ kNm2=> kp,1 = 3x(0.783x109)/17.53 = 438200 kN/m
505
pier 2: 0.7EcIg,2 = 0.7x3.25x107x67.20 = 1.529x10⁹ kNm2=> kp,2 = 3x(1.529x109)/17.53 = 855800 kN/m
506
Model B (first component of Models E and F)
507
In the final iteration, Dss = 0.235 m, which gives:
508
20
Diso,1 = (438200x0.235–338)/(2820+438200) = 0.233 m (Eq. 1)509
Fiso,1 = Fp,1 = Vp,1 = 338+2820x0.233 = 995 kN (Eq. 2)510
Mp,1 = 995x17.5 = 17413 kN.m511
kiso,1 = 995/0.233 = 4270 kN/m512
keff,1 = (4270x438200)/(4270+438200) = 4229 kN/m (Eq. 4)513
Diso,2 = (855800x0.235 – 2500)/(20836+855800) = 0.2267 m (Eq. 1)514
Fiso,2 = Fp,2 = Vp,2 = 2500 + 20836x0.2267 = 7223 kN (Eq. 2)515
Mp,2 = 7223x17.5 = 126400 kN-m516
kiso,2 = 7223/0.2267 = 31867 kN/m517
keff,2 = (31867x855800)/(31867+855800) = 30723 kN/m (Eq. 4)518
Keff, = 2(4229+30723) = 69904 kN/m519
Teff = 2(19310/69904)0.5 = 3.302 s520
Sd(3.302 s) = 0.362 m521
EDC = 2(4x338x0.233 + 4x2500x0.2267) = 5164 kN.m522
= 5164/(2x69904x0.2352) = 21.3%523
= (0.213/0.05)0.3 = 1.545524
new Dss = 0.362 m / 1.545 = 0.234 m (close to assumed value)
525
Forces in pier 2 using Model E
526
First-mode vibration period
527
For Model E, the pier in the model second component vibrates like a cantilever as there is no translational spring support
528
at the pier top. The first-mode period is obtained from Eq. (9) with the frequency parameter
1= 1.875.529
2 9 ,2 21.875
1.529 10
2
0.155
123.4
17.5
pT
s
530
The acceleration spectrum value (5% damping ratio) is obtained from Fig. 6a.
531
2
( P ) 0.848
S T g
532
Mode shape and modal participation factor