QUANTITATIVE MICROTEXTURE ANALYSIS
OF CARBONATE ROCKS USING
BIREFLECTANCE IMAGING
Rafael Jaimes Contreras, Dimitri Pilawski, Arnaud Califice & Eric Pirard
Université de Liège, GeMMe – Sart Tilman, B52, 4000 Liège, Belgique. Email : [email protected]
Abstract
Microtextural analysis of rocks has been addressed by several authors as an essential means to better understand the natural genesis of the material. But, it is also of paramount importance to those who try to predict the geotechnical or industrial behaviour of a rock under many forms of solicitation (mechanical, thermal, etc.). Quantitative modal (phase) analysis using point counting has already been discussed in depth by authors such as Chayes more than fifty years ago. Nowadays, automated image analysis with millions of pixels is easily available and improves statistical accuracy provided the classification step is correctly performed. Spitefully the assignment of a pixel to a given mineral phase or to a given crystal is often poorly satisfactory and remains the bottleneck of a fully automated textural analysis. Methods using a manual rotation of a polarizer in transmitted light microscopy have been developed by Starkey and Samantaray (1993) and further automated and improved by Fueten (1997). These allow to better delineate individual crystals in a thin section due to contrast in birefringence.
In this paper a similar technique using multiple orientations of a polarizer in reflected light microscopy has been used to contrast individual crystals in carbonated rocks. The maximum and minimum grey levels registered for each pixel allow for computing a bireflectance image whose variance is a good indicator of the misalignment of cristallographical orientations in the section. Moreover, the maximum of the reflectance gradient obtained for each orientation generates a good image of the grain boundaries and the presence of pores. This last one is quantitatively analysed using the intercept method to estimate the mean and variance of the grain size distribution. The paper presents a quantitative comparison of several different microtextures.
Keywords: Textures, modal analysis, automated image analysis, polarizer, transmitted light microscopy, bireflectance, intercept method.
1. Introduction
Quantitative analysis of rocks is an essential step in understanding their genesis but also their behaviour under different kinds of solicitations (e.g. mechanical; thermal; etc.). Following the conceptual model suggested by Griffiths (1988) a complete description of any physical property (P) of a sedimentary rock can be achieved using five fundamental variables
P
=
f m s sh o p
(
i, ,
i i, ,
i i)
Where mi designates the modal analysis or mineralogical composition; si the grain size
distribution; shi the grain shape distribution; oi the orientation and pi the packing of grains
within the sediment.
Quantitative modal analysis of rocks has been addressed by many authors and the theoretical basis behind point counting and stereology is well known since Chayes (1956). The remaining fundamental variables are accessible in the most favourable cases through advanced digital imaging and image analysis, but unless the microtextures are rather simple and made of well contrasted components (Higgins, 2006, Francus 2005) the accurate analysis of microtextures is still a challenge.
When rocks are made of huge amounts of a single mineral (e.g. quartz; calcite;…) it is essential to use an imaging technique that not only contrasts minerals but also individual crystals and grains. In transmitted light optical microscopy this has been achieved by making use of a rotating polarizer (Fueten (1997), Starkey and Samantaray (1993)). Under the electron microscope it can also be obtained using a so-called orientation imaging or electron backscattered diffraction pattern analysis (Dingley, 2004). In this paper, reflected light optical microscopy is the privileged technique, hence the optical anisotropy (bireflectance) of individual grains will be exploited.
2. Materials and methods
2.1. Multiradial imaging
Because optical properties of minerals will be used to identify and delineate individual grains, it is essential to acquire images in a properly calibrated way. In other words, the value (or multiplet of values) associated to any pixel must be as free as possible from artefacts due to the optical pathway, the aberrations of the optics or the uneven illumination of the scene. The image calibration protocol in reflected light has been described in detail in Pirard (2004).
When dealing with properties of optical anisotropy displayed by grains, the same reasoning applies and additional calibration steps have to be performed for each orientation of the polarizer (see multiradial imaging by Lebichot et al. (2007)).
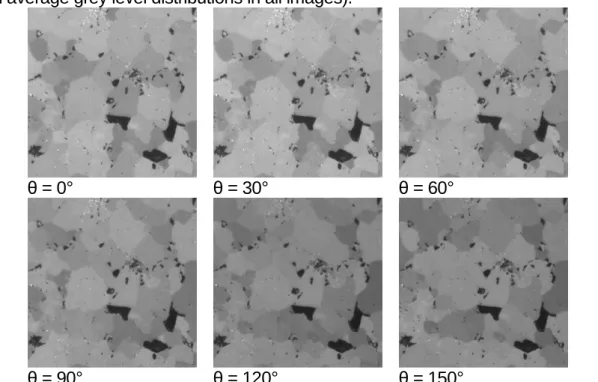
Figure 1 displays a series of calibrated images of a carbonate rock taken under reflected light by rotating the incident polarizer. The amplitude of the angular step used for multiradial imaging is a compromise to be found between the time needed to acquire images and the desired accuracy of grain boundary imaging. For the present study, a step of 30° has been privileged.
When acquiring a series of images sequentially, it is important to keep in mind that any change in optical conditions might induce a shift in the (x,y) plane but also a change in the overall intensity of the scene. This is why, prior to any further processing, the images are eventually
coregistered (manually or automatically using autocorrelation functions) and levelled (to obtain identical average grey level distributions in all images).
θ = 0° θ = 30° θ = 60°
θ = 90° θ = 120° θ = 150°
Figure 1. A series of six reflected light microscopy images of the same scene under different orientations of the incident polarizer. (10x objective; spatial resolution ∆x=0,67µm)
Once this has been done, three different images are computed from the initial set: a porosity image
a grain boundaries image a grain bireflectance image
a b
c d e
Figure 2. Reflected light image before (a) and after (b) an alternate sequential filter of size 7. Resulting images for porosity (c), grain boundaries (d) and bireflectance (e). (Note that the last one comes from a different location in the section).
2.1.1. Porosity image
The image of pores in reflected light can be readily obtained by thresholding values below a given grey level intensity (figure 2c). However, because poorly reflecting surfaces are also generated by scratches and pits due to polishing, it is often advisable to perform an erosion reconstruction operation to eliminate the smallest features. This limits the ability to measure pores smaller than three times the pixel resolution (<2µm in the present study) but avoids overestimating the global porosity.
2.1.2. Grain boundaries image
This image is obtained through a sequence of operations: Firstly, images acquired for each orientation of the polarizer (fig. 1) are filtered using an alternate sequential filter (Serra, 1982) to remove all features that are either brilliant (internal reflections, opaque minerals) or dark (pores, scratches) and are smaller than the smallest carbonate grain of interest. Secondly, a morphological gradient (dilation minus erosion) is computed for each orientation and the maximum of all gradients is kept as a result. Finally, a binary image of grain boundaries is obtained by keeping only those pixels that have gradients higher than a given threshold (typ. 25 for the present study). A more detailed explanation of a similar procedure can be found in Demanet et al. (2001). Additionally, it is advisable to remove pseudoboundaries generated by the outlines of pores by masking the resulting image with a dilated porosity image.
2.1.3. Bireflectance image
For each pixel in the scene, it is possible to compute an “apparent bireflectance” value by taking the difference between maximum and minimum over the range of polarizer orientations. This is not a perfect measure of bireflectance due to the improper polarisation of light in a reflected light microscope with a semi-reflecting mirror, but it is sufficient to reveal crystallographic variability among grains.
For the purpose of this study, three different textures have been selected and resulting measures will be illustrated (fig. 3).
A B C
2.2. Image analysis
2.2.1. PorosityThe porosity image gives a straightforward estimation of the local porosity in the image by simple denumbering of PP: the ratio of pore pixels in the image. One should keep in mind that
this measure, though theoretically unbiased, is sensitive to the image magnification (influence of support) and to the limited pixel resolution. The average porosity over a set of images is more valuable for sake of comparison between specimens rather than as an absolute measure of porosity.
When pores are present as well individualized features, it is possible to derive a 2D pore size distribution, which will again be valuable even without stereological correction for sake of comparison between samples.
2.2.2. 2D microtexture
The grain boundaries obtained from multiradial imaging will never provide perfectly well delineated and closed grains. Hence, the image is not amenable to classical blob or feature analysis. Because, only a statistical perception of the grain size distribution and preferred orientation is required, it is more advisable to make use of intercepts or run length distributions in the image (Underwood, 1970). This method has been adapted to petrology by Launeau and Robin (1996) and made available for analysis and orientation modelling through a freeware “Intercepts2003” (Launeau, 2010).
In the present study, intercepts have been measured on binary images of grain boundaries using a spacing of 2 pixels. Intercept lengths distributions have been analysed for a series of orientations between 0° (parallel to the Y axis of the image) and 180° by steps of 18°.
The result is a rose of mean intercept lengths which can be modelled by a best ellipse fit or a Fast Fourier transform to derive the average length (La) and width (Lb) of grains.
2.2.3. 3D microtexture
The bireflectance image cannot be used stricto sensu to reveal crystal (c axis) orientation in 3D. But, for the simple purpose of microtexture comparison it is interesting to assess the homogeneity of crystallographic orientations. A wide variability of the bireflectance values means that grain orientation is almost randomized, whether a small variability points toward a possible recrystallization in a given direction. As a rough estimate, a variance of pixel bireflectance (σ) is computed and its value is normalized with respect to the average grain size
in the scene as obtained from the intercept data.
b a L L + σ . 2
3. Results and discussion
Table 1 shows the essential statistics of the total porosity distribution in a series of images from the same plane (in this case perpendicular to the bedding plane). Values are in fraction of area coverage.
Sample P0 P50 P100
A 0,54 2,16 6,12 B 3,00 3,88 24,53 C 0,88 1,11 8,51
Table 1. Percentiles of the total porosity (in % of area) distribution from a series of images from samples of figure 3.
Figure 4 shows the result of modelling the rose of intercepts for the three carbonate microtextures. No significant anisotropy is revealed by the analysis of the three graphics, whereas the average grain size is clearly different as demonstrated more precisely by the omnidirectional intercept distribution from figure 5. The variation in the intercept distribution functions points towards differences in grain shape and interlocking.
A B C
Figure 4. Modelling of the rose of intercepts obtained for the three different textures. Figures are not at scale. Major and minor axis are respectively for A (La= 77.96µm; Lb=75.69µm) for B (La= 37.89µm; Lb=36.29µm) for C (La= 63.65µm; Lb=61.22µm). 0% 10% 20% 30% 40% 50% 60% 70% 80% 90% 100% 1 10 100 1000 L (µm) C u m u la te d a b c 0 100 200 300 400 500 600 700 800 900 1 10 100 1000 L (µm) N l w e ig h te d b y l e n g th a b c
Bireflectance variability is given in table 2, indicating a more homogeneous crystallographic orientation in sample A with respect to both other samples which appear almost randomized.
Sample La +Lb σ . 2 A 0,18 B 0,47 C 0,46
Table 2: Standard deviation of apparent bireflectance normalized by the average grain size as obtained for a series of images from the same plane perpendicular to the bedding plane.
4. References
Chayes, F., 1956, Petrographic modal analysis; : an elementary statistical appraisal: New York, Wiley, 113 p.
Demanet, D., Renardy, F., Pirard, E., and Jongmans, D., 2001, Application and processing of geophysical images for mapping faults: Computers and Geosciences, v. 29, p. 1031-1037. Dingley, D., 2004. Progressive steps in the development of electron backscatter diffraction and orientation imaging microscopy. J. Microsc. 213 (3), pp. 214-224.
Francus, P., 2005, Image Analysis, Sediments And Paleoenvironments, Springer, 330 p. Fueten, F., 1997. A computer-controlled rotating polarizer stage for the petrographic microscope. Comput. & Geosci. 23 (2), pp. 203-208.
Griffiths, J.C., 1988, Measurement, sampling and interpretation – in : Quantitative Analysis of Mineral and Energy Resources, Chung C.F. et al. Eds: NATO A51-C223
Higgins, M. D., 2006, Quantitative Textural Measurements In Igneous And Metamorphic Petrology, Cambridge Univ. Press, 265 p.
Launeau, 2010, Intercepts2003 software, http://www.sciences.univ-nantes.fr/geol/UMR6112/SPO/Intercepts.html
Launeau, P., Robin, P.-Y.F., 1996. Fabric analysis using the intercept method. Tectonophys. 267, pp. 91-119.
Lebichot, S., Dislaire, G., Pirard, E., and Launeau, P., 2005, Grey level intercepts distributions and grain size estimation, 8th Int. Congress on Stereology and Image Analysis: Zakopane, p. 102-110.
Pirard, E., 2004. Multispectral imaging of ore minerals in optical microscopy. Mineral. Mag. 68, pp. 323-333.
Serra, J., 1982, Image analysis and mathematical morphology: London, Acad. Press, 610 p. Starkey, J., and Samantaray, A. K., 1993, Edge detection in petrographic images: Journal of Microscopy, v. 172, p. 263-266.