Results and Discussion
Climatic and management drivers of CO
2
exchanges by a production crop:
Analysis over three successive 4-year crop rotation cycles
P. Buysse
(1)
, T. Manise
(2)
, A. De Ligne
(1)
, C. Moureaux
(2)
, B. Bodson
(2)
, B. Heinesch
(1)
, M. Aubinet
(1)
(1) University of Liège - Gembloux Agro-Bio Tech, Unit TERRA, Ecosystems-Atmosphere Exchanges, Belgium
(2) University of Liège - Gembloux Agro-Bio Tech, Unit TERRA, Crop Science, Belgium
2
nd
ICOS Science Conference
Helsinki, Finland, 27-29 September 2016
Contact person: Pauline Buysse, PhD (paulinebuysse@gmail.com)
Objectives
To determine climatic and crop management drivers for each crop.
To establish the three crop rotation carbon (C) budgets and to analyze
the different budget terms.
To investigate the role of intercrops in the C budget.
Lonzée Terrestrial Observatory (LTO)
Temperate climate (mean annual T and P: 10 °C, 800 mm)
Land cultivated for more than 80 years
Luvisol (FAO), SOC stock [0-60 cm]: 6.23 ± 0.16 kg C m
-24-year crop rotation: Sugar beet (SB) – Winter wheat (WW) –
Seed Potatoes (SP) – Winter wheat (WW)
Methods
Eddy-covariance measurements over the crop (2.8 m): sonic
anemometer (Solent Research Gill R3) + infrared gas analyzer
(Li-COR Li-7200)
Measurements active since 2004
Crop biomass samplings
Usual EC corrections applied
Data gap-filling and flux partitioning based on air temperature with
the online tool provided by the MPI-BGC Jena
(www.bgc-jena.mpg.de/~MDIwork/eddyproc/)
-20
-15
-10
-5
0
5
10
1/04/04
1/04/05
1/04/06
1/04/07
1/04/08
1/04/09
1/04/10
1/04/11
1/04/12
1/04/13
1/04/14
1/04/15
N
E
E
(
g
C
m
-2d
-1)
SB
WW
SP
MU
MA
S
o
u
rc
e
S
in
k
0
1
2
3
4
0
10
20
30
R
10(µ
m
o
l
m
-2s
-1)
Decades after harvest
No-MU system
MU system
Using night-time half-hourly data with:
Before
vegetation Vegetation After vegetation
C budget = NEE + C
imported
+ C
exported
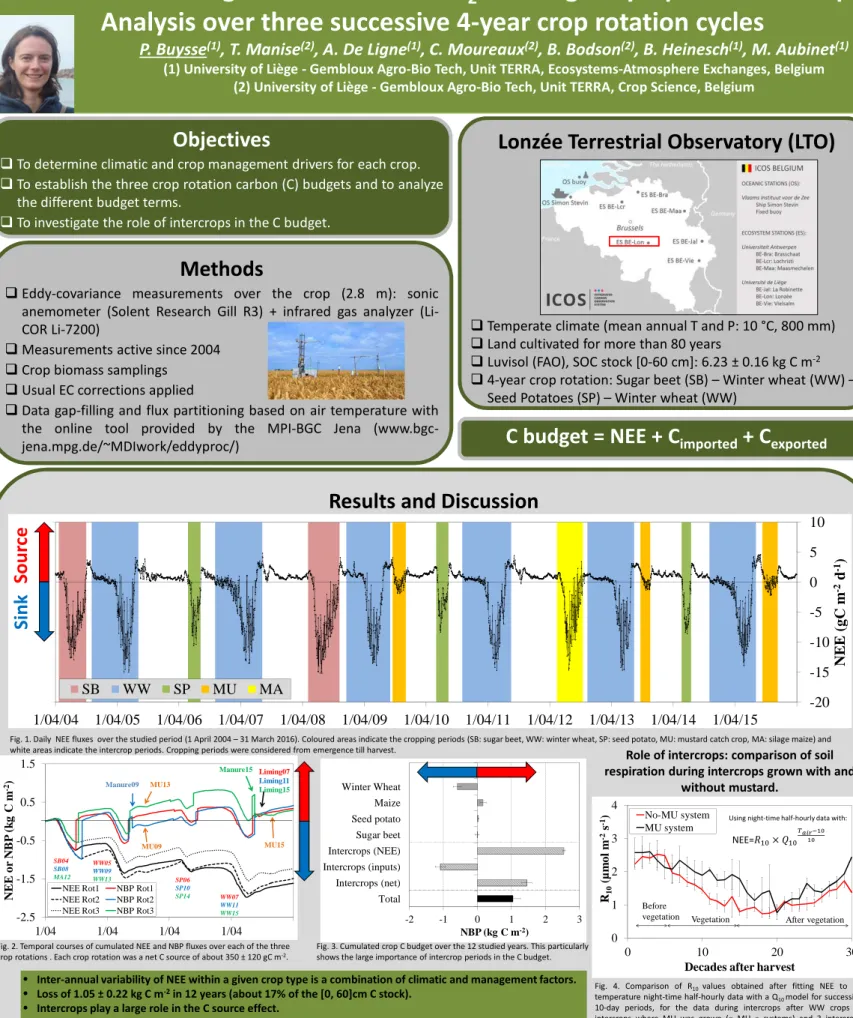
Fig. 1. Daily NEE fluxes over the studied period (1 April 2004 – 31 March 2016). Coloured areas indicate the cropping periods (SB: sugar beet, WW: winter wheat, SP: seed potato, MU: mustard catch crop, MA: silage maize) and white areas indicate the intercrop periods. Cropping periods were considered from emergence till harvest.
-2
-1
0
1
2
3
Total
Intercrops (net)
Intercrops (inputs)
Intercrops (NEE)
Sugar beet
Seed potato
Maize
Winter Wheat
NBP (kg C m
-2)
Fig. 2. Temporal courses of cumulated NEE and NBP fluxes over each of the three crop rotations . Each crop rotation was a net C source of about 350 ± 120 gC m-2.
Fig. 3. Cumulated crop C budget over the 12 studied years. This particularly shows the large importance of intercrop periods in the C budget.
Fig. 4. Comparison of R10values obtained after fitting NEE to air
temperature night-time half-hourly data with a Q10model for successive
10-day periods, for the data during intercrops after WW crops (3 intercrops where MU was grown (« MU » systems) and 3 intercrops where MU was not grown (« No-MU » systems). R10 values were
significantly larger in the « MU » system during and after « vegetation » periods.
NEE=
Overall, our results show that, on average, LTO behaves as a C source of 87 ± 44 gC m
-2
yr
-1
, which agrees
with what is found at other European crop sites, but represents a large proportion of the C stock at LTO.
Validation by soil inventories is foreseen.
•
Inter-annual variability of NEE within a given crop type is a combination of climatic and management factors.
•
Loss of 1.05 ± 0.22 kg C m
-2in 12 years (about 17% of the [0, 60]cm C stock).
•
Intercrops play a large role in the C source effect.
•
Mustard crops lead to more CO
2uptake but enhanced residue decomposition occurs thereafter
no impact
on the C budget.
Role of intercrops: comparison of soil
respiration during intercrops grown with and
without mustard.
-2.5
-1.5
-0.5
0.5
1.5
1/04
1/04
1/04
1/04
N
E
E
o
r
N
B
P
(
k
g
C
m
-2)
NEE Rot1 NBP Rot1 NEE Rot2 NBP Rot2 NEE Rot3 NBP Rot3
MU13 MU15 MU09 Manure09 Manure15 SB04 SB08 MA12 WW05 WW09 WW13 WW07 WW11 WW15 SP06 SP10 SP14 Liming07 Liming11 Liming15