COUPLING OPTIVIEW AND PRODUCTION SIMULATION
Jean David CAPRACE1, Francisco ARACIL FERNANDEZ2, Michael HÜBLER3, Philippe RIGO4 1 ANAST University of Liege, Liege, Belgium, [email protected]
2 ANAST University of Liege, Liege, Belgium, [email protected] 3 Center of Maritime Technologies, Hamburg, Germany, [email protected]
4 ANAST University of Liege, Liege, Belgium, [email protected]
ABSTRACT
This paper presents new developments to link OptiView and a Discrete Event production Simulation (DES) software. The OptiView Software, is designed to maximize the number of ship blocks and ship sections produced in workshops during a certain time window. We decided to combine the strong points of both, the OptiView software and the DES simulation. Indeed, the production simulation is very effective for the modelling of the movement of the gantry crane while OptiView is very powerful for the allocation of blocks and optimization of the surface. This tool was developed to support planners to improve the space utilization and workshop productivity. The combination of both methods will deliver better results for lead time and cost.
1. INTRODUCTION
In shipbuilding process one of the most key “workshop” is the assembly shop where final blocks are assembled just before to be erect in the dry dock. Planning of all the shipbuilding process is strongly linked to this workshop. Starting date and ending date of each block are imposed by this assembly shop. Consequently planning of all previous workshops is imposed in function of these dates. In other words an improvement of the competitiveness on the assembly shop has a strong impact on the total production time of the ship.
In order to facilitate the planning of the assembly shop powerful and useful software has been developed by ANAST: OptiView. Due to big dimensions of blocks the main problem of that kind of workshop is the ground space. This space allocation problem can be solved by the OptiView software that allows the planner to facilitate the planning and to optimise it. The software is composed of a Graphical User Interface (GUI) to manage blocks, to detect overlaps, to obtain graphical results as space occupation, workload, etc. The software contains also an optimisation algorithm to carry out automatically the planning. With a high number of blocks, a manual scheduling takes a lot of time and planner has no time to test alternatives. With a powerful optimiser, different results can easily and quickly be obtained.
Another method to optimise workshop efficiency is to use a Discrete-Event Software (DES) to simulate exactly the behaviour of the workshop. Once the model developed, different tests can be carried out and extra loads of work can be forecasted and thus better solved.
Both software are very efficient but each of them has gaps:
- The OptiView software does not manage resources: number of workers on each block is anticipatively fixed, problem of transport is not taken into account, etc;
- The simulation software does not run an optimisation of the space: simple allocation rules are used but an optimisation of the space is not done.
The goal of this work is to couple OptiView and a DES software in order to benefit of efficiency of each of them. By this way we could easily obtained an excellent planning that minimises total time, space occupation and that takes into account resources management.
The present paper will describe each software, explain the coupling and shows an application case on the building of a Liquefied Natural Gas (LNG) carrier in the assembly shop of the STX France shipyards.
2. PRODUCTION SIMULATION 2.1 Introduction
Production simulation or Virtual Manufacturing (VM) enables the modelling and simulation of production systems and processes to ensure, in advance of the start of production, that they operate at peak efficiency. Simulation is a new key technology of the millennium with considerable expected growth rates per year (Hübler, 2006, Bair, 2009).
Production simulation is the process of designing a model of a real or imagined product and conducting experiments with that model. The purpose of simulation experiments is to understand the behaviour of the product and to evaluate strategies for the production/operation of the product. Assumptions are made about this system and mathematical algorithms and relationships are derived to describe these assumptions – this constitutes a "model" that can reveal how the system works.
The complexity of the system often can not be represented by a simple mathematical model. In this case, the behaviour of the system must be estimated with a simulation. Exact representation is rarely possible in a model, constraining us to approximations concerning a degree of accuracy that is acceptable for the purposes of the study. In each one of these environments, a model of the system has proved to be more cost-effective, less dangerous, faster, or more practical than experimenting with the real system.
Simulation can be used in very different fields with a lot of different methods. The most common method used to modelling the production and fabrication of product is called Discrete Event Simulation (DES). DES only takes points in time (events) into consideration when something is changing. Such events may, for example, be a part entering a station or leaving it, or moving on to another machine. Any movements in between have few interest for the simulation itself. It is only important that the entrance and the exit events are displayed correctly. When a part enters a material flow object, the software calculates the time until it exits that object. Finally, the simulation software makes a list of all events where each event are programmed and executed step by step. The total time needed to run a simulation is really faster and is only limited by the computer speed.
Discrete Event Simulation (DES) programs like Plant Simulation from Siemens solution allows the mobilization of virtual plant like shipyards where product data contains all geometrical and methodical information about the ship while the simulation model includes all parameters describing the production facilities, resources (machines, humans, etc.) and processes. One of the major advantages of the production simulation is that it is possible to integrate the operating rules of each workshop and simulate the complex interactions between the different actors (human and material resources, transportation, machinery and tools, etc.). The production simulation is particularly effective to tackle phenomena such as the surface management, transport management, flow management (identification of bottlenecks), management of failures and hazards, etc. that a simple analytic workload simulation cannot integrate.
The cost assessment of a product starting from simulation model is a quite easy task. Indeed, all individual process times of the manufacturing tasks are a result of the simulation and linked to various resources. To assess the cost of the process, we can just multiply the operating time of each resource by its dedicated cost rate (Euros/hour).
2.2 Strong points and drawbacks
The use of simulation-based design and virtual reality technologies facilitates higher efficiency in terms of work strategy planning, and offers, as a result, significant productivity gains.
Several strong points can be underlined:
• We can easily vary the parameters of a system such as product features, operating procedures, decision rules, information flows, organizational procedures and then evaluate the impacts of these changes.
• Hypotheses about how or why certain phenomena occur can be tested for feasibility so that the errors are made on the model instead of in reality.
• Simulation models often have a visual Graphical User Interface (GUI), sometimes with graphical animations. This makes them more reliable and understandable for the different group of users (manager, planner, worker, etc.).
Nevertheless, some limitations must be highlighted here (Smith, 1999):
• Development of a simulation model requires time and very important resources.
• Production simulation modelling requires special training. It is an art that is learned over time and through experience. The ability to create a model that accurately represents the reality to be simulated is not immediately apparent. Real systems are extremely complex and some assumptions and omissions must be made about the details that will be captured in the model.
• Another limitation is the availability of data to describe the behaviour of the system. It is common for a model to require input data that is unavailable.
2.3 Test case
A free ballast 220 000 m³ LNG has been considered for the integration of the Optiview optimization and the production simulation. Figure 1 (a) shows the amidships section of the LNG. This innovative concept come from the IMPROVE European project (Caprace, 2009). Only the prismatic part (5 tanks) of the ship has been considered for the study. The fore part and the aft part are omitted in this study. The block splitting strategy defined for the study take into account a 1200 tons loading capacity of the main gantry crane of the shipyard (see Figure
1
(b-c)). Finally, the ship is divided in 43 blocks and 172 sections. This case study focuses on the Pre-Assembly Area of the STX France shipyards which contains the assembly shop as well as the dry dock.(b) 1200 tons block splitting strategy (#43)
(a) LNG Free ballast design
(c) section splitting strategy (#172) Figure 1 : Test case presentation
2.4 Model description
A production simulation focused on block erection stage has been developed for the STX France shipyards located in Saint-Nazaire. The model is only focused on the steel assembly of ships and not on the outfitting purpose. Within this model, the ship is first divided into a number of small blocks called “sections”. Sections are conveyed one by one by heavy trucks into the crane working area. Then, each section is assembled in the assembly shop near the dry dock. Large blocks, which are called erection blocks, are made by joining several small sections together. Then, the erection blocks are moved on the dock and welded to each other according to a suitable sequence, which is called the block erection, to complete the final assembly to the ship. That is, the construction process of the ship is similar to the process where a large product is made up of a number of parts like Lego blocks.
The following production stages are implemented inside the production simulation:
• The transport of section by heavy truck from the panel line workshop to the 3 possible inputs of the assembly shop near the dry dock
• The transport of section on the assembly shop with the gantry crane
• The position of block in the assembly shop is chosen with a basic allocation rule • The assembly of sections to make block on the pre-assembly area (tacking and
welding)
• The transport of blocks in the dry dock (block erection)
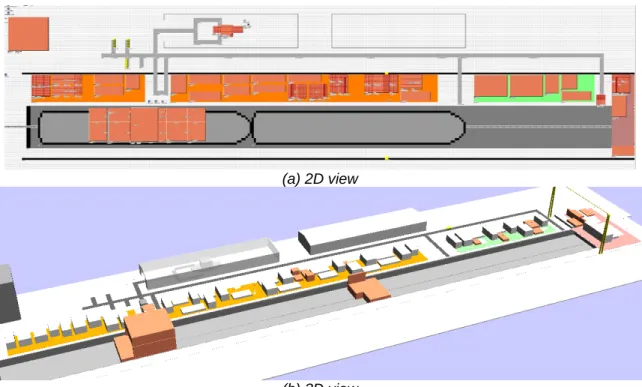
• The assembly of blocks to make the ship on the dry dock (tacking and welding) A 3D model has also been developed – see Figure 2 (b). We can see on this figure the process evolution on the pre-assembly area and in the dry dock. Big halls in the top of the figure are simple representations of workshops as the panel line.
(a) 2D view
(b) 3D view
Figure 2 : Block erection production simulation model This production simulation model has been developed following 3 stages:
1. The implementation of 3 simulation database supporting the following data:
a. The ship work breakdown structure database which contains: all product data including ships, compartments, elements, activities, joins and welds, and some resources data including hourly costs and budgets.
b. The production simulation database which contains: some data required for the simulation and not included in the product database including user parameters, ship position in the dry dock, local and global constraints, assembly strategies, as well as all production simulation results
c. The production facilities of the shipyards are directly recorded inside the simulation model and include the assembly shop dimensions, the transport resources (speed, dimensions, transport strategies of vehicles, etc.), the human resources (number of worker by skills, working strategies, pool worker management, etc.), and working calendar and shift definitions.
2. The implementation of budget assessment module based on all welding data as the welding length, welding position as well as the welding throat or the plate thickness. 3. The implementation of simulation models based on event oriented simulation for
production using the Simulation Toolkit for Shipbuilder (STS) developed for Plant Simulation working with high degree of details and accuracy.
3 SPACE ALLOCATION OPTIMIZATION
3.1 Need to improve the space allocation of blocks
Working surface and sub areas can be modelled inside the production simulation software (Nedeß 2006). These sub areas might be working areas or non accessible areas, like access aisle, equipment storage, parking, etc.
The production simulation model developed in this project do not have a real “nesting” tool to place the block on the assembly shop but some simplistic searching allocation rules. The following rules are available:
• Allocation of the first block in one corner and progressing by rows or by column, • Allocation of the blocks following each border of the shop circularly,
• Allocation of the blocks starting each corner heuristically,
• Allocation of the blocks on the smallest available area (least sub area)
Additionally simple constraints will be considered like safety distance between blocks and the possibility to change the orientation of the block for the allocation procedure.
The main problem during the allocation of the block is that the production simulation does not foresee the scheduling of the block along the time. For an optimal allocation a 4 dimensions nesting tool is necessary because we have three geometrical dimensions plus the fourth one, the time. The software knows only the present status of the assembly shop, and is not able to predict the date when the block is leaving the area. Indeed, a lot of constraints can influence the end date of the block like the delays due to the unavailability of transport and human resources. Another issue is that some advanced production rules are not considered in the simulation module of the assembly areas. For instance, it can be desirable to keep some blocks all together during the assembly stage, or to place some blocks only in one type of assembly shop, or to place some blocks nearest to the exit gate, or to place some blocks nearest to the ship which are currently erected, etc. Due to simplification only blocks with rectangular footprint are included. Also the enlargement of the construction area of a block during the assembly is excluded. These special rules and constraints require extra code (controls) in the simulation. For those adjacent blocks to the ship, we economize the use of the crane if they are built closely in the assembly area. In the same way, the movement duration of workers in the same portion of the ship decreases.
In order to overcome the difficulties presented here we implemented an interface between the DES production simulation and the OptiView software which can deal with these additional constraints. The main idea is to combine the advantage of both, the OptiView software and the DES simulation. Indeed, the production simulation is very effective for the modelling of the movement of the gantry crane while OptiView is very powerful for the allocation of blocks and optimization of the surface.
3.2 Space allocation problem
The space allocation difficulty looks like a nesting problem − cutting different shape in a metal sheet and try to minimize the material loss. This issue can also be considered with the conventional “3D bin-packing problem” where cubes or solid boxes are “packed” into a larger empty container in an effort to maximize the number of boxes in the container. The main difference is generally assumed that the blocks to be packed are all available at time 0. In shipbuilding, the blocks become available for placement at different times. Our problem is thus much more complex than a simple 2D scheduling problem: we have three geometric dimensions and in addition, the time dimension.
The dynamic allocation of blocks in shipyards is a huge, difficult and time-consuming effort. The difficulty in space allocation arises in the fact that:
• The allocation of space to one block significantly affects the availability of floor space for the other blocks. Scheduling production space to satisfy an erection schedule becomes even more complex when unexpected changes to the schedule occur (e.g., upstream process delays, weather-related delays, or subcontractor timeliness).
• The allocation of space in a industrial environments is an issue with different complex production constraints:
o Block height might be important because, sometimes, blocks have to be evacuated by a crane bridge above other blocks.
o Spacing between blocks might be required for safety and accessibility reasons. o Spacing bellow blocks might be required for transportation with skid platforms. o Preferred location for some blocks might be required to allocate block close to
specific tools or equipments.
This illustrates the need for a flexible tool that can assist planners in, not only generating optimal spatial layouts, but also modifying day after day these plans accordingly with the variation of the initial schedule (delays, unplanned maintenance, etc.).
3.3 OptiView approach
An innovative approach has been developed inside OptiView to increase the use of work area space. Complementary information can be consulted in the reference (Caprace, 2008). It contains a visualization tool and an optimization tool. Target workshops are mainly assembly shops where huge blocks and sections of ships are assembled just before they are due to be placed in the dry dock. Nevertheless, the tool has been here adapted to the assembly shop of the STX shipyard. In shipyard workshops, space is the most critical factor; all blocks have to be built at a fixed date and this imposes a good scheduling to respect all constraints. Each block requires a certain surface of the hall ground during a certain time; the time required to build a block depends on the number of workers and the budget dedicated to this particular block.
(a) 2D view
(b) 3D view
The objective of this study is to offer a decision tool to the planner to assist him in utilizing efficiently the surface available in a workshop thanks to:
• The automatic allocation of the activities (blocks, sections, etc.) in the workshops; • The minimization of the surface lost on the ground;
• Long-term and day-to-day simulations of how a delay impacts the global planning; • The generation and processing of the data (generation of allocation plans, display of
labour graphics, management of the industrial calendar, etc.).
This tool should thus provide planning proposals, i.e. a location and a starting day for each block. Unfortunately, it may happen that the available surface in the assembly hall is not sufficient to produce the entire set of blocks. The tool should then try to help the user to take the most efficient decision.
For simplification reasons, no details will be taken into account regarding the production transport resources. It is also assumed that blocks have their final shape during the assembling process. We do not take into account the successive assembly stages. In addition, a block is considered as a simple box. Many blocks are indeed almost parallelepipeds and other shapes could be considered using the same optimization technique.
Dealing with simple data is more convenient, and we believe that a decision tool is only efficient if it keeps things easy to use, even if complex methods are used to solve the problem. Indeed, the software would lose part of its power and efficiency if the time needed to prepare the data becomes excessive. In addition, the ability to make changes quickly and to view the impact of those changes in real time provides a powerful tool that will significantly reduce the cost of planning and re-planning.
3.4 Link between OptiView and the production simulation
The connection between OptiView and the simulation model is not trivial. In fact,
• OptiView will give as a result the “best” position configuration for the parts on the assembling areas to avoid any surface lost; it needs for that purpose to know approximately the time windows when each part has to be built. This is due to the structure of OptiView, which cannot take as input data the sequence of the parts, but needs information about the earliest and latest starting date of production.
• The production simulation can determine for each step of the ship erection the activity duration. But if the activity budget consists in part in pure working time (which can be calculated with the duration of each activity and with a given assembly strategy) it consists also in different waiting times. Waiting times could occur before the loading of each part by the crane (the crane is not always available) and in the carrying time between the initial and final positions of the parts. Furthermore we also have waiting time for other resources: workers must be available. Reasons of unavailability are numerous: workers are all working, workers with required qualification is busy, week-ends, and so on.
As a conclusion, the sole piece of information concerning the sequence of assembly will not be enough to make OptiView and the Plant Simulation run. Each module requires input data from the other one.
Figure 4 shows the flow diagram of the integration of the OptiView inside the production simulation loop. We observe the following stages:
Figure 4 : Integration of OptiView and production
simulation
1. A first budget evaluation is automatically performed for each section and each erected block. The purpose of this module consists to assess the quantity of fabrication work (in hours) starting from all scantling and welding data like welding length, welding position, welding type, welding process, etc. Finally, this module enhances the link between design and production.
2. We perform a first production simulation run with Plant Simulation in order to find the input data for OptiView taking into account rough allocation rule (linear, spiral, etc.) for blocks and section on the assembly shop.
3. The first output of the simulation is an input for the OptiView software. We perform an optimisation of the space allocation of blocks and sections along the assembly shop in order to find the best position of assemblies. The consequence is also the minimization of wasting space.
4. A second run of the production simulation will take place with the output of OptiView in order to check the feasibility of the schedule regarding all movements of the gantry crane.
4. APPLICATION CASE
4.1 Results of the allocation optimization
Table 1 shows the relative results between each intermediate step of the overall process described in the Figure 4 (n° 2, 3 and 4). The 3 main results highlighted here are the total lead time of the process, the average lead time per block and the total surface used, expressed in m²*days. In addition of lead time and surface utilization, the production simulation has the advantage to provide other results like production cost (transport cost, labour cost, surface utilization cost), transport and human resource utilization ratio, etc. But these results are not present here.
The gains after the surface allocation optimization with OptiView are 1.2% for the lead time and 7.4% for the occupation ratio. Moreover the scheduling time is drastically reduced (hours instead of days). Indeed, in the past, space allocation was being done manually by small groups of experienced people using tools such as computer-aided design (CAD), PowerPoint, or Excel and schedule information from their planning systems. Now the shipyard has an integrated tool able to optimize the work of the planners.
For small problems, when space available inside the workshop is largely superior to the sum of the block surface, computation times are between 30 and 150 seconds for ~250 blocks. For more constrained problems, when the space available inside the workshop is quite similar to the sum of the block surface, the time required to find an optimized solution increases from 5 minutes to 1 hour. Solution times are reported for trials performed on a SONY VAIO VGN-FZ with a 2.2 GHz processor. OptiView Optimization Budget Evaluation Production Simulation START END 1 2 3 4
Table 1 : Production and optimization results
4.2 Results of the coupling between the production simulation and the space allocation optimization
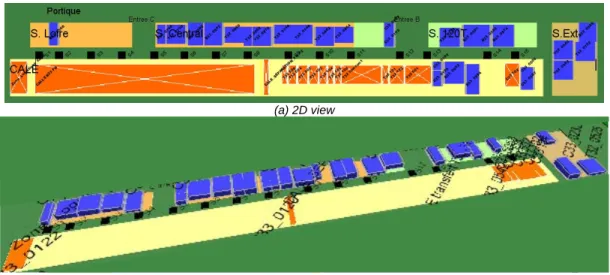
Figure 5 shows the comparison of the block position between the production simulation and OptiView for the beginning of the production simulation when only some blocks are allocated. Afterwards, some problems of delays between the schedules provide by OptiView and the production simulation arises. We can observe in Table 1 an increasing of lead time and a decreasing of the occupation ratio. The conclusion is that the coupling between the production simulation and the space allocation is not completely efficient at the moment.
(a) Production simulation
(b) OptiView
Figure 5 : Comparison of the block position between the production simulation and OptiView The main problem appears during the second production simulation run when some delays regarding the schedule provided by the OptiView software are generated due to resources unavailability or variability (transport or human). The difficulty in space allocation, or spatial scheduling, arises in the fact that the allocation of space to one block significantly affects the availability of floor space to the other blocks. Scheduling production space to satisfy an erection schedule becomes even more complex when unexpected changes to the schedule occur (modification of block duration, production delays, etc.).
The production simulation was initially designed to strictly respect the planning coming from OptiView. But when some delays appear some overlaps between blocks in the assembly shop might be created. Consequently problems/bugs could occur in the simulation and the process must be stopped. In order to avoid this situation we implemented a rule to move all the blocks in an endless store just after that the assembly is finished. Afterwards the blocks are erected on the ship. This correction of the behaviour of the production simulation is not realistic but allows going trough the end of the simulation. That explains why the results presented in Table 1 are not realistic too.
For further development, the idea is to optimise continuously the space allocation with OptiView. When the gap between the initial schedule provided by OptiView and the production simulation
First run of production simulation Allocation Optimization (OptiView) Second run of production simulation Fig.4 - n°2 Fig.4 - n°3 Fig.4 - n°4
Lead time days 174 -1.2% 172 5.5% 182
Average lead time of blocks days 19.8 0.2% 19.83 -8.5% 18.27
Surface used m²*days 989762 6.3% 1056397 -13.7% 928899
Dayly average areas occupation m²/day 5688 7.4% 6142 -20.3% 5104 Total disponible area per day m²/day 39740 0.0% 39740 0.0% 39740
reaches a certain threshold level, the stimulation might be stopped and the OptiView software will optimize again the space allocation. In this way, OptiView receives in real time the up-to-date data with the real duration of all activities like in the reality.
5. CONCLUSIONS
One of the most significant observations for the last decades concerning shipbuilding is the increasing of ship size. The consequence is an increasing of the block size and/or the number of blocks whiles the working surface are almost equal. Then, the optimization of the resource utilization becomes vital to increase the shipyard competitiveness.
A coupling between OptiView, a software able to optimize the allocation of block along the assembly shop, and a DES production simulation has been introduced in this paper. These tools can be used to improve the scheduling of the block allocation on assembly shops.
The main advantage of the methodology developed is to combine the quality of a production simulation tool and a scheduling optimization tool. The production simulation is very effective for the modelling of the human and transport resources like the gantry crane movements while OptiView is very powerful for the allocation of blocks and optimization of the surface.
Some additional developments are required in order to automate the process. Nevertheless the results are already very promising and perspectives are promising.
AKNOWLEDEGMENTS
The authors thank University of Liege and the Center of Maritime Technologies of Hamburg for the collaboration in this project as well as the European MARSTRUCT project (n° TNE3-CT-2003-506141) and the European IMPROVE project (n° 031382- FP6 2005 Transport-4).
REFERENCES
Bair, F. (2009). “Developments of Tools Focused on Production Simulation to Improve Productivity in Shipyards Workshops”. PhD thesis, University of Liege.
Caprace, J., Bair, F., Losseau, N., Warnotte, R., Rigo, P. (2008) “OptiView − A Powerful and Flexible Decision Tool Optimising Space Allocation in Shipyard Workshops”, COMPIT’08, pp 48-59.
Caprace, J., Bair, F., Hübler, M., Lazakis, I., Turan, O., Zanic, V., Andric, J., Prebeg, P., and Piric, K. “Production, operation and robustness module.” (2009), Final Conference of EU FP6 project IMPROVE, page 6, September 2009.
Hübler, M., Krause, M., Roland, F., Steinhauer, D. (2006) “Simulation of production process - a helpful tool for planning and scheduling in shipbuilding”. Black Sea 2006, pp 64-68
Nedeß, C., Friedewald, A., Wagner, L., Hübler, M. (2006) “Simulation of material flow processes in the planning of production spaces in shipbuilding”, COMPIT 2006, pp 186-198.