The role of ventricular–arterial coupling in
cardiac disease and heart failure: assessment,
clinical implications and therapeutic
interventions. A consensus document of the
European Society of Cardiology Working
Group on Aorta & Peripheral Vascular
Diseases, European Association of
Cardiovascular Imaging, and Heart
Failure Association
Ignatios Ikonomidis
1*
, Victor Aboyans
2,3, Jacque Blacher
4, Marianne Brodmann
5,
Dirk L. Brutsaert
6, Julio A. Chirinos
7, Marco De Carlo
8, Victoria Delgado
9,
Patrizio Lancellotti
10,11, John Lekakis
1, Dania Mohty
2,3,
Petros Nihoyannopoulos
12,13, John Parissis
14, Damiano Rizzoni
15,
Frank Ruschitzka
16, Petar Seferovic
17, Eugenio Stabile
18, Dimitrios Tousoulis
13,
Dragos Vinereanu
19, Charalambos Vlachopoulos
13, Dimitrios Vlastos
1,
Panagiotis Xaplanteris
13, Reuven Zimlichman
20, and Marco Metra
211Second Cardiology Department, Echocardiography Department and Laboratory of Preventive Cardiology, Athens University Hospital Attikon, National and Kapodistrian
University of Athens, School of Medicine, Athens, Greece;2Department of Cardiology, Dupuytren University Hospital, Limoges, France;3Inserm 1094, Limoges School of
Medicine, Limoges, France;4Diagnosis and Therapeutic Center, Hypertension and Cardiovascular Prevention Unit, Paris-Descartes University, Hôtel-Dieu Hospital, AP-HP, Paris,
France;5Division of Angiology, Department of Internal Medicine, Medical University Graz, Graz, Austria;6Department of Cardiology, University Hospital Antwerp, Edegem,
Belgium;7Perelman School of Medicine and Hospital of the University of Pennsylvania, University of Pennsylvania, Philadelphia, PA, USA;8Cardiac Catheterization Laboratory,
Cardiothoracic and Vascular Department, Azienda Ospedaliero-Universitaria Pisana, Pisa, Italy;9Department of Cardiology, Leiden University Medical Centre, Leiden, The
Netherlands;10Department of Cardiology, University of Liège Hospital, GIGA Cardiovascular Sciences, CHU SantTilman, Liège, Belgium;11Gruppo Villa Maria Care and
Research, Anthea Hospital, Bari, Italy;12NHLI - National Heart and Lung Institute, Imperial College London, London, UK;131st Department of Cardiology, Hippokration
Hospital, National and Kapodistrian University of Athens, Medical School, Athens, Greece;14Heart Failure Unit, School of Medicine and Department of Cardiology, National and
Kapodistrian University of Athens, Athens University Hospital Attikon, Athens, Greece;15Department of Clinical and Experimental Sciences, University of Brescia, Brescia, Italy; 16Department of Cardiology, University Hospital, Zurich, University Heart Center, Zurich, Switzerland;17Cardiology Department, Clinical Centre Serbia, School of Medicine,
University of Belgrade, Belgrade, Serbia;18Department of Advanced Biomedical Sciences, ‘Federico II’ University, Naples, Italy;19University of Medicine and Pharmacy ‘Carol
Davila’, and Department of Cardiology, University and Emergency Hospital, Bucharest, Romania;20Department of Medicine and Hypertension Institute, Brunner Institute for
Cardiovascular Research, Sackler Faculty of Medicine, The E. Wolfson Medical Center, Institute for Quality in Medicine, Israeli Medical Association, Tel Aviv University, Tel Aviv, Israel; and21Cardiology, Department of Medical and Surgical Specialties, Radiological Sciences, and Public Health, University of Brescia, Brescia, Italy
Received 10 July 2018; revised 9 January 2019; accepted 10 January 2019 ; online publish-ahead-of-print 12 March 2019
*Corresponding author. 2nd Cardiology Department, Attikon Hospital, National and Kapodistrian University of Athens (NKUA), Rimini 1, Haidari, 12462 Athens, Greece. Tel: +30 210 5832187, Fax: +30 210 5832192, Email: ignoik@gmail.com
Ventricular–arterial coupling (VAC) plays a major role in the physiology of cardiac and aortic mechanics, as well as in the pathophysiology of cardiac disease. VAC assessment possesses independent diagnostic and prognostic value and may be used to refine riskstratification and monitor therapeutic interventions. Traditionally, VAC is assessed by the non-invasive measurement of the ratio of arterial (Ea) to ventricular end-systolic elastance (Ees). With disease progression, both Ea and Ees may become abnormal and the Ea/Ees ratio may approximate its normal values. Therefore, the measurement of each component of this ratio or of novel more sensitive markers of myocardial (e.g. global longitudinal strain) and arterial function (e.g. pulse wave velocity) may better characterize VAC. In valvular heart disease, systemic arterial compliance and valvulo–arterial impedance have an established diagnostic and prognostic value and may monitor the effects of valve replacement on vascular and cardiac function. Treatment guided to improve VAC through improvement of both or each one of its components may delay incidence of heart failure and possibly improve prognosis in heart failure. In this consensus document, we describe the pathophysiology, the methods of assessment as well as the clinical implications of VAC in cardiac diseases and heart failure. Finally, we focus on interventions that may improve VAC and thus modify prognosis.
...
Keywords Ventricular–arterial coupling • Arterial elastance • Ventricular elastance • Global longitudinal strain • Pulse wave velocity • Valvular heart disease • Hypertension • Inflammatory disease •
Coronary artery disease • Heart failure • Prognosis • Treatment
Introduction
The important role of ventricular–arterial coupling (VAC) in the physiology of cardiac and aortic mechanics, as well as in the patho-physiology of cardiac disease has long been recognized. Despite its complexity, several invasive and non-invasive methods have been developed to measure VAC. In this consensus document, we describe the pathophysiology of VAC impairment and the mech-anisms that can affect arterial and cardiac function and their rela-tion. Traditional VAC assessment methods are presented, together with novel approaches. Furthermore, we analyse the clinical impli-cations of VAC in arterial hypertension, systemic inflammatory diseases, coronary artery disease (CAD), valvular heart disease, and heart failure (HF). Finally, we focus on invasive and non-invasive interventions that may improve VAC.
Pathophysiology
of ventricular–arterial coupling
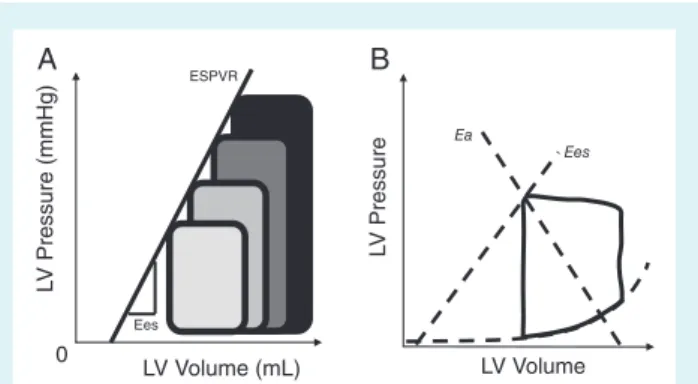
Heart–vessel coupling is constantly changing to match ventricular end-systolic and arterial elastances, a concept that finds its origins in the pressure–volume (P-V) cardiac function analysis as assessed by cardiac catheterization.1By connecting all end-systolic pointsof a family of P-V loops obtained during various loading conditions, the so-called ‘end-systolic pressure–volume relation’ (ESPVR) line is retrieved (Figure 1A).1 Suga and Sagawa1 found this relation to
be roughly linear within physiologic ranges, sensitive to inotropic changes, and insensitive to afterload, while the respective line slope has been termed as end-systolic elastance (Ees). Conceptualising the left ventricle as a closed volume, Ees represents the necessary intracavitary pressure to increase its volume by one unit.1 The
intersection between the ESPVR (upper left-hand corner of the P-V loop) and a line drawn from the end-diastolic volume on the horizontal axis identifies a second line. The respective slope repre-sents the end-systolic pressure to stroke volume (SV) ratio, termed as effective arterial elastance (Ea) (Figure 1B). It has been shown, ...
... LV Volume (mL) 0 L V Pressure (mmHg) Ees ESPVR LV Volume L V Pressure Ees Ea A B
Figure 1 (A) Left ventricular (LV) end-systolic elastance (Ees) estimated by pressure–volume loop family, end-systolic point line. By connecting all end-systolic points of pressure–volume loops obtained during various loading conditions, the so-called ‘end-systolic pressure–volume relation’ (ESPVR) line is retrieved. (B) LV Ees estimated as the end-systolic pressure/end-systolic stroke volume ratio and arterial elastance (Ea) estimated as the end-systolic pressure/stroke volume ratio are used to calculate Ea/Ees ratio as a marker of ventricular–arterial coupling using a single pressure volume loop.
based on mechanoenergetic grounds, that stroke work generation is maximal when the Ea/Ees ratio equals 1, while maximal cardiac efficiency is achieved when the Ea/Ees ratio equals 0.5.2
Ventricular–arterial stiffening amplifies the elevation of blood pressure (BP) induced by exercise or mental stress and this may further worsen left ventricular (LV) diastolic function and increase cardiac energy costs to provide an adequate output.3 This may
exacerbate the effect of the systemic load on LV diastolic func-tion and elevate cardiac metabolic demand, as well as LV diastolic filling pressures under stress causing HF symptoms, further com-promising myocardial reserve in the long term.3,4
Although the P-V analysis (Figure 1B) provides useful information regarding the operating mechanical efficiency and performance of the ventricular–arterial system when LV ejection fraction is frankly
Zc: proximal aortic impedance, determining early and peak systolic myocardial stress
PWV: index of arterial stiffness, determining
systolic myocardial stress; increased PWV results in an early arrival of wave
reflections, accentuating late systolic stress; positive correlation with Aix
Pulse wave reflection sites Pulse wave generation
Aix: index of contribution of wave
reflections to waveform, affecting late
systolic stress in the context of a stiffened
aorta
S V dec reas es syst emic perfusion,
resulting in neurohumoral and SNS
activation
SV inc rease s disp roportion ately Pulse Pressure in a stiff aorta resulting in further
vascular damage
Forward wave Reflected wave
Subendocardial ischemia, impaired systolic myocardial deformation-
LV diastolic dysfunction*
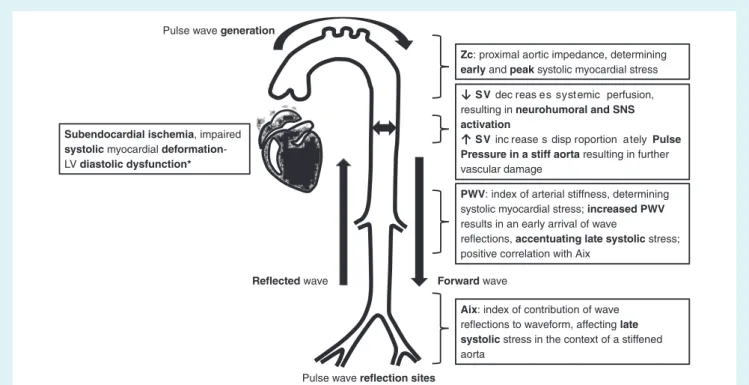
Figure 2 Vascular mechanisms that lead to impaired left ventricular (LV) function. Aix, augmentation index; PWV, pulse wave velocity; SNS, sympathetic nervous system; SV, stroke volume.
abnormal, it is less informative in HF with preserved ejection fraction (HFpEF), as discussed later.
Effects of arterial function on left
ventricular structure and performance
The heart ejection generates forward pressure and flow waves, transmitted down the arterial tree, giving rise to reflections which, in a stiffened aorta, arrive early in systole instead of diastole and, thus, increase central systolic BP and reduce diastolic BP, a key determinant of the coronary perfusion gradient.4The increase inafterload increases myocardial oxygen demand, and the reduction in coronary perfusion pressure decreases oxygen delivery creat-ing conditions of myocardial ischaemia, further deterioratcreat-ing LV systolic and diastolic performance (especially during exercise).4
Furthermore, reflected waves increase late systolic load rela-tive to early systolic load, which has deleterious effects on the myocardium.
In general, arterial load can be expressed as the combination of steady and various pulsatile components. The steady component of afterload (i.e. total peripheral resistance) depends largely on microvascular properties. Pulsatile LV afterload is, in contrast, predominantly influenced by the properties of conduit vessels. Key parameters of pulsatile LV load include the characteristic impedance of the proximal aorta (Zc), the magnitude and timing of wave reflections, and the total compliance of the arterial tree (‘total arterial compliance’) (for definitions see section ‘Markers of arterial function’).
Arterial load (arterial compliance, total vascular resistance index, and wave reflections measured in the ascending aorta) and ...
...
stiffness [pulse wave velocity (PWV)] are closely related with LV diastolic function, LV mass, and myocardial deformation [e.g. global longitudinal strain (GLS)].5–8 In fact, LV diastolic dysfunction, LV
hypertrophy, abnormal myocardial deformation, and increased aor-tic stiffness share many epidemiological and pathophysiological fea-tures: they predominate in elderly subjects and hypertensives, have a predictive value for morbidity and mortality, and share under-lying biochemical mechanisms of remodelling (collagen deposi-tion, increased cellular stiffness, production of advanced glycation end-products in diabetes mellitus). Furthermore, impairment of coronary flow reserve is associated with increased arterial stiffness and myocardial dysfunction in hypertension, inflammatory diseases, and CAD.6
Carotid to femoral PWV (cfPWV), aortic characteristic impedance (Zc), and the magnitude and timing of wave reflec-tions during systole summate the impact of arterial load on LV function at systole and diastole7 that triggers the onset of
clin-ical symptoms,8 and contributes to cardiovascular events.9 The
vascular mechanisms that may lead to an impaired LV function are summarized in Figures 2 and 3. Increased arterial stiffness (as measured by PWV) results in faster pulse wave propagation, earlier reflection and arrival of backward pulse waves during late systole, instead of diastole; thus, early arrival in systole augments central aortic pressure and thus LV afterload and myocardial oxygen demand, and lowers central diastolic arterial pressure and thus coronary perfusion and myocardial oxygen delivery. The imbalance between increased myocardial oxygen demands and reduced coronary perfusion leads to myocardial ischaemia in the absence of coronary stenosis (Figure 3).
Pressure
Time central PP, SBP, LV afterload
DBP, coronary perfusion
Figure 3 Effects of increased arterial stiffness and the concomi-tant earlier arrival of wave reflections from the peripheral arteries on central aortic pressure waveform. The pulse wave with blue line indicates augmentation of aortic pressure in diastole by return wave reflections under conditions of normal arterial elastic prop-erties while the aortic systolic component remains unaffected (blue line). The pulse wave with red line indicates augmentation of central aortic pressure in systole by the early arrival of wave reflection (orange line and orange arrow) because of increased arterial stiffness and reduced central diastolic pressure compared to diastolic pressure during the normal (diastolic) arrival of wave reflection (blue line) when arterial elasticity is not impaired. DBP, diastolic blood pressure; LV, left ventricular; PP, pulse pressure; SBP, systolic blood pressure.
Effects of cardiac function on arterial
properties
The left ventricle, aortic valve, aorta, and peripheral arteries should be regarded as interdependent organs placed in a series circuit. The principles of complementarity (all compartments contribute additively to afterload) and competitiveness (one com-partment cannot be lowered without raising the other one) reflect their interdependence and the common physiological mechanisms that coordinate their function.10 During systole, a pulse wave is
propagated along the aorta to the periphery stretching the arterial wall. Moreover, capacitance vessels distend to accommodate the increased LV SV during exercise. Furthermore, LV SV reduction does lead to neurohumoral and sympathetic activation, also contributing to vascular dysfunction.
Common biochemical pathways
determining arterial and cardiac function
Extracellular matrix and cytoskeleton regulation processes are bio-chemical pathways that concomitantly affect cardiac and arterial structure and function through replacement or reactive fibrosis. Transforming growth factor-𝛽 serves as a biochemical coordina-tor, activating fibroblasts and myofibroblasts. The fibroblast plays a key role in inflammation, proliferation/apoptosis, angiogenesis (induced by growth factors) and upon stimulation by angiotensin II it produces collagen.11 Under normal conditions, a balancebetween extracellular matrix synthesis and degradation exists. ...
...
...
Degradation is the task of matrix metalloproteinases. In the pres-ence of disease or with aging, extracellular matrix synthesis grad-ually predominates, setting the stage for accelerated fibrosis.12,13 High galectin-3 levels, a marker of myocardial and vascular fibrosis, predicted impaired VAC.13
Endothelial-derived nitric oxide, cytokines, oxidative stress proteins and growth factors determine myocardial microcircu-latory function, as well as aortic and peripheral vasoreactivity.14
Moreover, neurohumoral factors including adipokines, leptin, and sex hormones have also been implicated in the process of ventricular–arterial decoupling by affecting LV hypertrophy, vascular wall hypertrophy, and vasoconstriction.15,16For example, ventricular–arterial decoupling was associated with impaired LV performance and was attributed to inflammation in septic shock.17
The above mechanisms act in parallel to modify arterial and cardiac function in adaptive or maladaptive ways.
Key points
• Reflected waves, which arrive in late systole, increase end-systolic stress and impair diastolic function.
• Changes in LV SV affect vascular function.
• Fibrosis, inflammation and oxidative stress are common biochemical pathways linking impaired ventricular–arterial function.
Methods to assess
ventricular–arterial coupling
Although VAC is most frequently assessed in the P-V plane by cardiac catheterization, this approach has important limitations (Table 1).2
Currently, the most widely used echocardiographic method for the determination of Ea/Ees (normal value 1.0 ± 0.36) is the single-beat method developed by Chen et al.18 Although several methods are
available, it remains unclear which provides the most reliable results. According to this method, Ees can be calculated non-invasively by the formula:
Ees = (DBP– [End (est) × SBP × 0.9)] ∕End (est) × SV (normal value ∶ 2.3 ± 1.0 mmHg∕mL)
where DBP and SBP are diastolic and systolic arm-cuff BPs, End(est) is the estimated normalized ventricular elastance at the onset of ejection, and SV is Doppler-derived stroke volume. End(est) is described by the following formula:
End (est) = 0.0275 − 0.165 × EF + 0.3656 × (DBP∕SBP × 0.9) + 0.515 × End (avg)
where EF is the basal ejection fraction and End(avg) is derived by a complicated formula:
End (avg) = 0.35695 − 7.2266 × tNd + 74.249 × tNd2− 307.39 × tNd3+ 684.54 × tNd4–856.92 × tNd5
+ 571.95 × tNd6− 159.1 × tNd7
where tNd is the ratio of pre-ejection period to total systolic period.
We note that this polynomial formula uses the ratio of pre-ejection period to total systolic period raised to multiple powers (up to the sev-enth) such that small variations or errors in the measurements of time intervals will lead to relatively large changes in the estimated Ees value. Effective arterial elastance (Ea) can be computed using the following formula3:
Ea = (SBP × 0.9) ∕SV (normal value ∶ 2.2 ± 0.8 mmHg∕mL). However, a simplified formula frequently used to assess VAC is the following:
Ea = ESP∕SV, Ees = ESP∕ESV
where ESP is end-systolic pressure, SV is stroke volume, and ESV is end-systolic volume. Thus, Ea/Ees = (ESP/SV)/(ESP/ESV) and then by eliminating ESP:
Ea∕Ees = ESV∕SV, which equals to 1∕ (EF − 1) .
It becomes readily apparent that the advantage of the Ea/Ees ratio as a method to provide additional insights about the physiologic status of the ventricular–arterial system is blunted, as it becomes a derivative of LV ejection fraction. Thus, the full formula by Chen et al.18should be
used to calculate Ees and then to be divided to Ea in order to obtain an Ea/Ees ratio that accurately reflects invasive Ea/Ees measures.
Three-dimensional echocardiography or magnetic resonance imag-ing measure LV volumes more accurately than two-dimensional echocardiography and should be preferred for the calculation of LV (or right ventricular) volumes included in the aforementioned VAC estimation formulas.19 Finally, in several cardiac diseases (e.g.
hypertension, inflammatory diseases, or diabetes), the components Ea and Ees may be similarly impaired, providing an Ea/Ees ratio of around 1; therefore, the extent of physiologic abnormalities should be assessed by the absolute value of each component.2 The advantages
and disadvantages, as described in Table 1, pertain to both invasive and non-invasive determinations of the Ea/Ees ratio. However, we should acknowledge that cardiac catheterization provides more accu-rate measurement of Ea and Ees than non-invasive methods while non-invasive methods are applicable for repeated consecutive studies of VAC, e.g. before and after treatment in daily clinical practice. Thus, we propose the simultaneous measurement of arterial and novel myocardial function markers, as described above, that may provide a more accurate estimation of VAC and its changes in disease or after treatment.
Markers of arterial function
Arterial load depends on the properties of small and large arteries. Indices of the properties of large vessels include aortic characteris-tic impedance (Zc), aorcharacteris-tic distensibility, beta stiffness index, and large artery stiffness (estimated by aortic PWV) (Table 1). Finally, other indices ‘blend’ the effect of small and large arteries, such as central systolic BP and pulse pressure, indices of wave reflections (e.g. augmen-tation index), brachial–ankle PWV, and total arterial compliance.20
Regional arterial wall properties
Characteristic impedance of the proximal aorta (Zc) can be intu-itively measured as the slope of the pulsatile pressure–flow relation (where pressure and flow are measured in the same point within the artery) in the absence of reflected waves (Figure 4A–E). It is a ‘local’ arterial property and reflects the interplay between inertial ...
...
...
effects and the local storage of blood in the proximal aorta and the load initially experienced by the ventricle upon opening of the aor-tic valve. It can be measured non-invasively. Two-dimensional guided mode echocardiography of the aortic root to assess aortic root diam-eter changes between systole (AoS) and diastole (AoD) combined with simultaneous sphygmomanometric measurements of the arterial pressure (PP) at the brachial artery has been used to assess aortic distensibility (2 × (AoS − AoD)/(AoD × PP),21 though this index was
initially measured invasively. A stiff and narrow aorta leads to high Zc and low aortic distensibility, whereas a distensible, wide aorta to a low Zc and increased aortic distensibility. The local stiffness param-eter beta can also be calculated according to the formula Beta = ln (Ps/Pd)/(Ds − Dd/Dd), where Ps and Pd are systolic and diastolic BP in the brachial artery measured by an automated sphygmomanometer, and Ds and Dd are the maximal and minimal diameters of the right common carotid artery measured by ultrasonic high resolution wall tracking22or of the aorta by echocardiography.21
Large artery stiffness
Carotid to femoral PWV, which is the velocity of the pulse as it travels from the heart to the carotid and femoral artery, remains the most commonly used non-invasive method and is considered as the ‘gold standard’. cfPWV is usually measured using surface tonometry probes at the right common carotid and right femoral artery. The transit time is the time of travel of the wave over these sites. The distance (D) covered by the waves is usually assimilated to the skin distance between these two recording sites; PWV is calculated as PWV = D/Dt (m/s).20
Brachial–ankle PWV capitalizes on the concept that measurements over a longer arterial length may provide additional information.20
Central haemodynamics/wave reflections
Pressure and flow waves are generated with each heartbeat and are propagated towards the periphery where they are reflected back-wards, merge with the antegrade wave and amplify it. As a result, peripheral BPs are higher compared to central (aortic) BPs. Central BPs are more relevant than peripheral ones, as the heart, brain and kidneys are directly exposed to them. Central haemodynamic indices are either central BP parameters and derivatives (central systolic BP, pulse pressure, augmented pressure and amplification), or indices that quantify timing and magnitude of wave reflections (obtained by pulse wave analysis in the frequency domain and wave separation analysis). A frequently used central augmentation index is measured non-invasively by arterial tonometry and is calculated as 100 × peak central systolic BP/central pressure at the inflection point and represents the pressure boost that is induced by the return of the reflected waves at the aorta.20Central pulse wave recordings
are obtained by cardiac catheterization or non-invasively by arterial tonometry or oscillometry devices (Figure 4A). Furthermore, the newly developed techniques of pressure–flow (Figure 4A–E) and wave separation analysis (Figure 4F–G) may offer more insight into the assessment of vascular haemodynamics in various disease states by measurement of both forward and backward compression and expansion pulse wave. Wave reflection assessment by wave separation analysis is based on the principle that reflected waves add to forward pressure and subtract from forward flow distorting the linear relation-ship between the increase in pressure and the increase in flow that is seen in early systole when the pulsatile pressure–flow relation is governed by aortic root Zc (Figure 4E and G). Several lines of evidence support the importance of late systolic load from wave reflections
Table 1 Advantages and disadvantages of ventricular–arterial coupling assessment modalities
VAC assessment modality
Advantages Disadvantages
. . . .
Ea/Ees • Widely used with extensive published data • Relatively simple and intuitive
• Characterizes mechanical indices that relate to energetics (only when EF< ∼40%):
• External mechanical energy • Potential energy
• Energetic efficiency
• Allows us to discern the determinants of stroke volume and EF
• Cardiac catheterization for pressure–volume loops • Echocardiography provides an approximation of
Ea/Ees and its components
Disadvantages of Ea:
• It is not a pure index of arterial load because it is prominently influenced by heart rate
• It is mostly dependent on resistance and is insensitive to changes in pulsatile arterial load
• It is not a measure of arterial stiffness or total arterial compliance
• Its derivation did not account for wave reflection or transmission
• It does not discern the temporal pattern of load (loading sequence) which is an important
determinant of diastolic dysfunction, maladaptive LV remodelling and heart failure risk
Disadvantages of Ees:
• Non-linearity of the ESPVR
• It demonstrates afterload dependency • It demonstrates some preload dependency • It does not assess myocardial properties (only
‘chamber’ properties)
• Little validation of single-beat non-invasive methods beyond the original derivation study
Disadvantages of Ea/Ees:
• It does not characterize (and neglects) LV loading sequence
• In HFpEF, it may be normal because both Ea and Ees are increased
• Ea/Ees derived by the simplified formula (ESV/SV ratio) is related mathematically to EF (1/EF – 1) and thus may not add substantial information to EF measurement
Arterial stiffness markers
Total arterial compliance • Assessment of the compliance of the whole arterial tree
• Measured non-invasively
• Depends non-linearly on arterial pressure • It is size-dependent
• There are systematic differences between different methods, making it difficult to standardize • Required expertise is high
• Limited prognostic and therapeutic data Pulse wave velocity • Solid pathophysiological background
• Can be measured non-invasively in a standardized manner at a low cost, requiring low expertise • Significant prognostic and therapeutic data • Reference values established
• It depends on arterial pressure
• It represents a part of arterial system (segmental arterial stiffness)
Central aortic haemodynamics/wave reflections (central SBP, Aix)
• Solid pathophysiological background • Can be measured non-invasively • Prognostic data are available • Reference values established
• Estimations are based on assumptions and algorithms
Table 1 Continued VAC assessment modality Advantages Disadvantages . . . . Characteristic impedance of the proximal aorta (Zc)/aortic distensibility
• Solid pathophysiological background • It can be measured non-invasively
• It is dependent on blood pressure and aortic size • Increased cost for the equipment
• Significant expertise needed for its estimation • Limited prognostic and therapeutic data Valvulo–arterial
impedance (Zva)
• Solid pathophysiological background • It can be measured non-invasively • Prognostic data are available • Reference values are available
• It is dependent on blood pressure and loading conditions
• Technical limitations of Doppler echocardiographic measurements of LV stroke volume and pressure gradient
Cardiac function markers
Internal linear dimensions
M-mode • Reproducible
• High temporal resolution • Wealth of published data
• Beam orientation frequently off axis • Single dimension, i.e. representative only in
normally shaped ventricles 2D • Facilitates orientation perpendicular to the ventricular long
axis
• Lower frame rates than M-mode • Single dimension, i.e. representative only in
normally shaped ventricles Volume assessment
2D • Corrects for shape distortions
• Less geometrical assumptions compared with linear dimensions
• Apex frequently foreshortened • Endocardial dropout
• Blind to shape distortions not visualized in the apical two- and four-chamber planes 3D • No geometrical assumption
• Unaffected by foreshortening
• More accurate and reproducible compared to other imaging modalities
• Lower temporal resolution • Less published data on normal values • Image quality dependent
Myocardial function markers
Tissue Doppler imaging
• High temporal resolution
• Established prognostic value of E’,S’ and E/E’ • Incorporated in all echo systems
• Reference values established
• Angle-dependent, affected by noise
• Assessment of longitudinal and radial deformation • Time consuming for strain analysis
• Moderate reproducibility/inter and intra-observer variability for strain analysis
Speckle tracking modalities
• Angle-independent
• Assessment of longitudinal, radial and circumferential deformation
• Assessment of LV twisting–untwisting properties • Established prognostic value for GLS
• RV assessment
• Pressure–strain loops to assess myocardial work index • Good reproducibility/inter and intra-observer variability • 3D imaging is available
• Normal values available
• Vendor dependent
• Dependent on good 2D image quality
• Limited studies on clinical value of 3D strain and myocardial work index by 2D strain
Time-resolved wall stress curve
• Calculation using a central pressure waveform derived non-invasively and time-resolved LV geometric information derived from echocardiography or cine MRI
characterization of the myocardial loading sequence
• Limited studies on clinical value
PWV to GLS ratio • Established prognostic value for PWV and GLS • Sensitive markers of arterial and myocardial function
• Limited studies on clinical value in hypertensives
2D, two dimensional; 3D, three dimensional; Aix, augmentation index; Ea, arterial elastance; Ees, left ventricular elastance; EF, ejection fraction; ESPVR, end-systolic pressure–volume relation; ESV, end-systolic volume; GLS, global longitudinal strain; LV, left ventricular; MRI, magnetic resonance imaging; PWV, pulse wave velocity; RV, right ventricle; SBP, systolic blood pressure; SV, stroke volume; VAC, ventricular–arterial coupling.
A
B
C
E
D
F
Figure 4 Analyses of central pressure–flow relations and myocardial wall stress. (A) Arterial tonometry recording. (B) Pulsed wave Doppler flow velocity recording of the left ventricular outflow tract; this velocity envelope can be multiplied by the left ventricular outflow tract cross-sectional area to obtain volume outflow from the left ventricle, which equals aortic inflow. (C and D) Signal-averaged pressure and flow waveforms. (E) Pressure–flow loop showing the linear early systolic pressure–flow relation (green segment); the slope of this line approximates the aortic characteristic impedance (Zc), which equals the ratio of pulsatile pressure/pulsatile flow in the aortic root in the absence of wave reflections; a deviation (upward shift) from this linear relation occurs upon the arrival of the reflected wave, which increases pressure and reduces flow (red segment in the pressure–flow loop). (F) Wave separation analysis which decomposes the pressure waveform into its forward (Pf) because of left ventricular contraction and backward (Pb) components because of wave reflection at peripheral arterial sites (e.g. points of branching or change in arterial wall diameter). (G) Measured pressure in systole vs. product of flow time aortic root Zc (blue area) that denotes the pressure in aortic root during left ventricular systolic contraction if wave reflections were absent; the red area denotes the ‘excessive’ pulsatile pressure because of the arrival of wave reflections from the peripheral arteries, which is above that required to ‘accommodate’ observed flow through the aortic root if reflections were absent. The early arrival of wave reflections in systole occurs when pulse wave velocity is increased because of a stiff aorta; the pink area represents the diastolic component of the central aortic pulse wave starting after the inflection point that indicates the aortic valve closure (AVC) (arrow). (H) Time-resolved myocardial wall stress in the same subject, obtained via a combination of arterial tonometry and speckle tracking echocardiography; myocardial wall stress at each time point during ejection is computed to generate a time-resolved stress curve; notice the early systolic myocardial wall stress peak, with lower values of wall stress during late systole. (I) Ejection-phase pressure–stress plot showing that the lower wall stress values in late systole are related to a mid-systolic shift of the pressure–stress relation (green arrow) which favours lower stress values in late systole despite rising pressure. This mechanism may protect the myocardium against wave reflections, but is impaired in the presence of a low ejection fraction or left ventricular concentric remodelling, and may be overcome when there is excessive wave reflection magnitude. AVO, aortic valve opening.
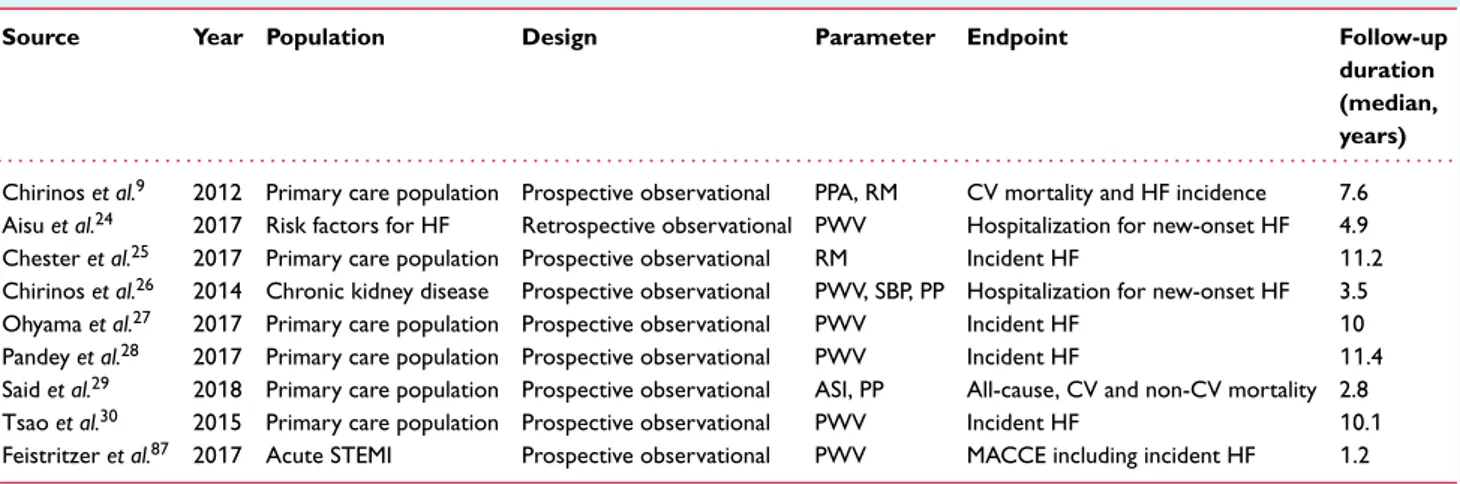
Table 2 Studies presenting the independent value of markers of arterial stiffness as predictors of cardiovascular events and incident heart failure
Source Year Population Design Parameter Endpoint Follow-up
duration (median, years) . . . .
Chirinos et al.9 2012 Primary care population Prospective observational PPA, RM CV mortality and HF incidence 7.6
Aisu et al.24 2017 Risk factors for HF Retrospective observational PWV Hospitalization for new-onset HF 4.9
Chester et al.25 2017 Primary care population Prospective observational RM Incident HF 11.2 Chirinos et al.26 2014 Chronic kidney disease Prospective observational PWV, SBP, PP Hospitalization for new-onset HF 3.5
Ohyama et al.27 2017 Primary care population Prospective observational PWV Incident HF 10
Pandey et al.28 2017 Primary care population Prospective observational PWV Incident HF 11.4
Said et al.29 2018 Primary care population Prospective observational ASI, PP All-cause, CV and non-CV mortality 2.8
Tsao et al.30 2015 Primary care population Prospective observational PWV Incident HF 10.1
Feistritzer et al.87 2017 Acute STEMI Prospective observational PWV MACCE including incident HF 1.2
ASI, arterial stiffness index; CAD, coronary artery disease; CV, cardiovascular; HF, heart failure; MACCE, major adverse cardiac and cerebrovascular events including death, non-fatal myocardial reinfarction, new-onset congestive HF, and stroke; PP, pulse pressure; PPA, pulse pressure amplification; PWV, pulse wave velocity; RM, reflection magnitude; SBP, systolic blood pressure; STEMI, ST-elevation myocardial infarction.
as a determinant of maladaptive LV remodelling, diastolic and systolic dysfunction, and HF risk (Table 2).7–9,12,13
Normal values for PWV (< 10/ms) and central systolic BP (< 130 mmHg) have been described23 and their predictive value
for incident cardiovascular mortality and HF has been demonstrated (Table 2).24–31
Numerous methods have been suggested to estimate total arte-rial compliance based on the Windkessel (elastic reservoir) model; most require both accurate pressure and flow wave recording at the aorta and are hampered by practical and technical (mainly related to complexity), as well as theoretical limitations (including not account-ing for wave reflections).20The SV over pulse pressure method has
been reintroduced recently and it requires accurate and reproducible echocardiographic measurement of cardiac output; however this ratio is shown to overestimate compliance and further standardization of the measurement is required20(Table 1).
Markers of myocardial performance.Novel echocardiography tech-niques have permitted the evaluation of myocardial deformation in sys-tole and diassys-tole by use of tissue Doppler imaging, two-dimensional, and recently three-dimensional speckle tracking32 (Table 1). Studies
have shown impaired myocardial deformation (e.g. GLS< 20%) in the presence of normal ejection fraction in patients with hypertension, diabetes, CAD, valvular heart disease and HF.31,33 Myocardial
defor-mation markers have been related with myocardial fibrosis,34arterial
stiffness,31,35 natriuretic peptides,8 exercise capacity,36 symptoms of
HF,36and have a prognostic value in valvular heart disease37and in HF
with reduced and preserved ejection fraction.2Thus, these myocardial
deformation markers may be surrogate markers of impaired myocardial function.
Novel markers to assess ventricular–arterial coupling. Arterial load should always be interpreted by considering interactions between arteries and the left ventricle as a pump3,4and also between myocar-dial elements and instantaneous LV geometry and the time-varying load imposed by the systemic circulation. Wall stress represents the time-varying mechanical load experienced by the contractile elements ...
...
in the myocardium (myocardial afterload) and is related to the amount of force and work the muscle does during a contraction.
In axisymmetric ventricles, average LV myocardial fibre stress can easily be approximated by the formula developed by Arts et al.38:
Fiber𝜎 = P 1 3ln ( 1 +Vw Vlv )
When assuming rotational symmetry and homogeneity of mechan-ical load in the wall, the dimensionless ratio of muscle fibre stress [sigma (𝜎) fiber] to LV pressure (P) appears to depend mainly on the dimensionless ratio of cavity volume (Vlv) to wall volume (Vw) (ln
denotes natural logarithm) and is quite independent of other geometric parameters.
This method can be applied non-invasively to calculate time-resolved ejection-phase fibre stress using a central pressure waveform and time-resolved LV geometric information (derived from echocar-diography or cine magnetic resonance imaging)2 (Figure 4A–D). A
time-resolved wall stress curve allows for characterization of the myocardial loading sequence, which can be expressed as a ratio of the stress-time integral in late vs. early systole. A high late-to-early systolic stress time integral ratio has been shown to be associated with reduced indices of myocardial systolic contraction and diastolic relaxation7,8 and left atrial dysfunction,31 providing a link between
wave reflections and the reported risk of incident HF in the general population4,9,25(Figure 4H–I).
New echocardiography software construct arterial pressure–LV longitudinal myocardial strain curves by speckle tracking echocardio-graphy and measure the area of the pressure–strain loop, termed as myocardial work index (Figure 5). The software calculates the constructive and the wasted myocardial work.39Further studies are
required to assess the performance of this method for physiologic and clinical evaluations as this method neglects the work performed in the circumferential direction. Shear wave generation using an ultra-sonic burst focused on the myocardium is a novel promising assess-ment method of myocardial elasticity.40 Finally, the ratio of cfPWV
to LV GLS appears to be a novel promising marker to assess VAC in hypertensives.41
Figure 5 Myocardial work index comprises a novel method of ventricular–arterial coupling estimation derived by pressure–left ventricular longitudinal myocardial strain loop during one cardiac cycle by speckle tracking echocardiography. (A) Before and (B) after cardiac resynchronization therapy (CRT). Note the larger area of the pressure–strain loop after CRT compared to baseline, indicating an improved myocardial work during systole after CRT. The bull’s eye shows the myocardial work index in each one of the 17 left ventricular wall segments. (Echocardiography images provided as courtesy by Dr I. Ikonomidis, Echocardiography Department, Attikon Hospital, NKUA, Athens, Greece).
In summary, the measurement of novel myocardial and arterial function markers may be used to describe and quantify VAC in various disease states.
Key points
• The measurement of novel myocardial and arterial function mark-ers may describe and quantify VAC, particularly if the traditional Ea/Ees approximates 1, despite the suspicion or presence of overt cardiovascular disease (such as in HFpEF).
• Comprehensive assessments of VAC in future studies should include proper measurements of pulsatile load and VAC (wave reflections, Zc, wave intensity and wave power analyses), rather than relying entirely on P-V analyses.
• Other novel markers, such as myocardial work index, may be informative and compensate for some of the classic method limitations, but further clinical evidence of the utility of this approach is required.
Clinical implications
of ventricular–arterial coupling
Ventricular–arterial coupling
in hypertension, diabetes, and systemic
diseases
The association between myocardial and arterial function markers has been used to describe and quantify VAC in hypertension,41,42 diabetes,43and inflammatory diseases.44,45More specifically, com-bined ventricular and arterial stiffening has been demonstrated in HFpEF patients and hypertensives.3 The investigators found an
inverse correlation between total arterial compliance and Ees, independently of body surface area and SV. Additionally, both hyper-tensive and HFpEF patients had reduced Ea/Ees (< 0.6) compared to healthy controls.3,42
Furthermore, in untreated patients with arterial hypertension, central augmentation index (measured by arterial tonometry) and aortic distensibility have been related with abnormal markers of LV diastolic function as assessed by Doppler echocardiography,45
while PWV has been associated with E/E’ and E’/A’ as assessed by tissue Doppler imaging.46
Moreover, an interrelation between conduit arterial stiffness and subendocardial dysfunction as assessed by tissue Doppler imag-ing in patients with diabetes, hypertension, or ischaemic dilated cardiomyopathy has been found.22Additionally, in a study cohort
of hypertensives and diabetics, it has been shown that early dias-tolic velocity (E’) by tissue Doppler imaging varies inversely with Zc, Ea, and PWV.6 Late systolic load, as assessed by
augmenta-tion index and arterial compliance, had the strongest associaaugmenta-tion with E’. Similar associations were found between vascular markers and systolic mitral annulus velocity (S’).7 In morbidly obese
sub-jects, an inverse relationship between isovolumetric relaxation time and aortic distensibility (both assessed by echocardiography) was observed, while weight reduction after bariatric surgery improved BP, aortic distensibility and LV diastolic dysfunction.47 ...
...
...
In a study including 320 hypertensive patients, increased PWV was found to be related with abnormal LV longitudinal strain, reduced LV untwisting and peak untwisting velocity as assessed by speckle tracking echocardiography.48 In this study, impaired
LV myocardial deformation and untwisting were associated with reduced exercise capacity.48 Interestingly, increased PWV was
also associated with reduced coronary flow reserve,46 which
in turn was related to abnormal myocardial deformation in hypertensives.48 A similar association between arterial stiffness
and myocardial deformation was found in chronic kidney disease patients.49 Similarly, in the context of type 1 diabetes mellitus, a
negative correlation between PWV and left atrial strain has been underlined.50 Furthermore, in type 2 diabetics, increased PWV
and central aortic pressure were associated with impaired LV longitudinal deformation and untwisting before and after 6 months of antidiabetic treatment.51
Thus, in hypertension and diabetes there is a close link between arterial stiffness and myocardial deformation, which appears to be a harbinger of HFpEF, if left untreated.
Interventions to improve ventricular–arterial coupling in arterial hypertension
Antihypertensive treatment improved VAC, arterial stiffness, and LV systolic and diastolic function in 527 patients with early stage hypertension.52 In the above study, changes in the Ea/Ees
ratio were inversely correlated with those in ejection fraction, stroke work index, LV efficiency and changes in mitral E/e’. It has also been shown that improved Ea/Ees after 6 months of antihy-pertensive monotherapy is related with improved LV function and regression of LV hypertrophy, with angiotensin-converting enzyme (ACE) inhibitors, angiotensin II receptor blockers (ARBs), and dihydropyridine calcium antagonists having the most favourable effect on this index.53
Indeed, the various antihypertensive drug classes have differential effects on pulsatile and central haemodynamics; ACE inhibitors, ARBs, calcium-channel blockers, and some vasodilating𝛽-blockers are more effective in this regard, compared to diuretics and some non-vasodilating 𝛽-blockers.54–56ACE inhibitors represent
the first drug class for which a clear advantage over 𝛽-blockers was demonstrated in terms of effects on central BP, arterial stiffness and wave reflections. Also ARBs and dihydropyridines were demonstrated to be able to reduce PWV and improve central aortic haemodynamics.55,56Conversely, the majority of studies have shown that diuretics have a neutral effect on arterial stiffness and central haemodynamics.
The differential effects of calcium-channel blockers on arte-rial stiffness may be related to better prognosis as shown by the CAFÉ-ASCOT study (Table 3).54–56Evidence showing that an
improvement in wave reflection will lead to a reduction in cardio-vascular events was provided by the CAFÉ study,54where, despite
a similar reduction in peripheral systolic BP, a calcium-channel blocker regimen (amlodipine with perindopril added as required) was more effective in lowering central systolic BP, and reduced future cardiovascular events compared to a 𝛽-blocker regimen (atenolol with bendroflumethiazide-K as required). It should be
noted that the majority of patients received a combination of amlodipine with perindopril or atenolol with diuretic (only 26% on monotherapy) and thus, the difference in cardiovascular events and central haemodynamics should be related only to treatment combinations and not to individual drugs. Additionally, antihyper-tensive drug classes that have more pronounced effects on arterial stiffness and wave reflection, are the same that cause significant regression of LV hypertrophy.55
The effects of LCZ696 [angiotensin receptor-neprilysin inhibitor (ARNI): sacubitril/valsartan] on aortic stiffness were evaluated in elderly patients with systolic hypertension and pulse pressure > 60 mmHg. At week 12, sacubitril/valsartan reduced central aortic systolic pressure to a greater extent than olmesartan by −3.7 mmHg. After 52 weeks, more patients required add-on anti-hypertensive therapy with olmesartan (47%) vs. sacubitril/valsartan (32%).57
Pulse wave velocity and augmentation pressure were significantly and progressively reduced by renal denervation in patients with resistant hypertension, especially in hypertensive patients with more elevated PWV at baseline.58After renal denervation, actual
PWV measures were lower than the predicted age- and mean BP-corrected values, suggesting that this intervention might exert BP-independent effects on arterial stiffness. Additionally, renal denervation diminished cardiac systolic work load as evident by shorter ejection duration and reduced systolic BP load after the procedure, suggesting a substantial effect on VAC.
Similarly, in type 2 diabetics, treatment with glucagon-like peptide-1 (GLP-1) caused a greater reduction of PWV, central aortic pressure and wave reflections, and greater improvement of LV longitudinal deformation and LV twisting-untwisting than met-formin after 6 months of treatment, likely through reduction of oxidative stress burden as assessed by the reduction of protein carbonyls and malondialdehyde.51Indeed, in the above study, the
reduction of malondialdehyde after 6 months of GLP-1 treatment was associated with the respective reduction of PWV which, in turn, was related with improved LV GLS.
Key points
• Myocardial dysfunction and vascular stiffness are present in newly diagnosed hypertensives and diabetics.
• Both may contribute to reduced exercise capacity and HF symptoms.
• There are treatment options that may improve both myocardial dysfunction and vascular stiffness and thus improve VAC.
Ventricular–arterial coupling
in systemic inflammatory disease
Atherosclerosis, subclinical LV dysfunction, and increased risk of cardiovascular events characterise rheumatoid arthritis (RA), systemic lupus erythematosus, ankylosing spondylitis, psoriasis, gout, and medium- and large-vessel vasculitides.21,59,60With regard to VAC, systemic inflammatory processes and oxidative stress may ......
...
cause an increase in arterial stiffness, leading to increased Ea in parallel to myocardial stiffening causing an increased Ees.44
In a trial examining 80 patients with RA, the investigators demon-strated that reduced systemic arterial compliance was related to reduced LV longitudinal strain and strain rate and abnormal LV twisting and untwisting velocity as assessed by speckle tracking echocardiography.59 Similarly, an increased PWV was associated
with reduced LV longitudinal strain in psoriatic patients.60
Further-more, in a patients with Adamantiades–Behcet’s disease, reduced aortic distensibility was associated with prolonged deceleration time, an established marker of LV diastolic dysfunction.21
Interventions to improve
ventricular–arterial coupling
in inflammatory disease
Anti-inflammatory treatment has been shown to alleviate ventricular–arterial decoupling. In a double-blind, crossover study of RA patients, injection of anakinra [a recombinant inter-leukin (IL)-1 receptor antagonist] resulted in improved systemic arterial compliance and systemic vascular resistance, improved E/E’, in parallel with improved indices of LV myocardial deforma-tion and twisting as assessed by speckle tracking. Interestingly, the improvement in vascular and myocardial deformation mark-ers was greater in the group of patients with coexisting CAD who showed a higher inflammatory burden.60 Administration of
tocilizumab (an IL-6 antagonist) has been shown to reduce PWV,61
improve cardiac function, and reduce LV mass in RA.62Moreover,
anti-tumour necrosis factor-𝛼 therapy resulted in reduced PWV after a 3-month follow-up period in patients with inflammatory arthropathy.63 Additionally, the Physical Activity in RA (PARA)
trial has shown that moderate intensity physical activity resulted in increased E/A and a trend towards decreased PWV and aug-mentation index,64suggesting the reversal of ventricular–arterial
decoupling. Finally, in psoriatic patients, novel biological agents reduced arterial stiffness, central aortic pressure and wave reflections, and improved LV longitudinal deformation and LV twisting-untwisting within 4 months, through inflammatory and oxidative stress burden reduction.65
Key points
• Systemic inflammation concomitantly impairs arterial and myocardial function.
• Anti-inflammatory treatment improves arterial stiffness in parallel with myocardial stiffness contributing to reversal of ventricular–arterial decoupling.
Ventricular–arterial coupling
in valvular heart disease
Aortic stenosis
In patients with aortic stenosis (AS), the left ventricle is often facing a double load: a valvular load imposed by AS and an
Table 3 Effect of different antihypertensive drug classes on aortic stiffness, wave reflection and central blood pressure
Antihypertensive drugs Aortic
PWV/aortic stiffness Wave reflection Central systolic pressure Augmentation index Carotid stiffness . . . . Diuretics ↓/↔ ↔ ↔ ↔↓ ↓/↔ 𝛽-blockers ↓
Without vasodilating effects ↓ ↓/↔ ↓ ↓ ↔
With vasodilating effects ↓ ↓ ↑ ↑ ↓/↔
𝛼-blockers ↔ ↓ NA
Calcium-channel blockers ↓
Dihydropyridines ↓/↔ ↓ ↓ ↓ ↓/↔
Non-dihydropyridines ↓ ↓ ↓
ACE inhibitors ↓ ↓ ↓↓ ↓↓ ↓
Angiotensin II receptor blockers ↓ ↓ ↓ ↓ ↓/↔
Aldosterone antagonists ↓/↔ ↓ NA
Nitrates ↔ NA ↓↓ ↓↓ NA
ACE, angiotensin-converting enzyme; NA, not available; PWV, pulse wave velocity;↑, increased; ↓, decreased; ↓↓, marked decrease; ↔, no change. Adapted from Nilsson et al.55and Boutouyrie et al.56
arterial load caused by a decrease in systemic arterial compliance (or an increase in systemic vascular resistance) in the context of existing co-morbidities (e.g. age, smoking, hypertension, dia-betes) (Figure 6).
Briand et al.66 proposed two practical indexes, systemic
arte-rial compliance (SAC) and valvulo–artearte-rial impedance (Zva) to assess the effects of aortic wall properties on LV function in AS. SAC index is the ratio of SV indexed to body surface area/pulse pressure: SAC ≅ SVi/PP. In their study, 40% of patients with severe AS had markedly reduced arterial compliance (SAC index< 0.6 ml/m2/mmHg) associated with LV dysfunction.66
Valvulo–arterial impedance represents the total haemodynamic load opposing LV blood ejection into aorta, combining both valvu-lar and vascuvalvu-lar factors, and can be a used as a surrogate marker of VAC. Zva is obtained non-invasively by calculating the LV pressure (sum of systolic pressure and the mean pressure gradient obtained by continuous wave Doppler) divided by SV/m2: Zva ≅ LV
pres-sure/SVi (mL/m2/mmHg); thus, it represents the cost in mmHg for
each systemic mL of blood pumped by the left ventricle during systole. A value> 4.5 mmHg/mL/m2 indicates a severely increased
total afterload. Interestingly, Zva was superior to valve area or gra-dients to predict outcomes.62Finally both Zva≥ 4.9 mmHg/mL/m2
and LV GLS≤ 15.9% independently predicted outcome in asymp-tomatic moderate to severe AS (aortic valve area ≤ 0.6 cm2/m2)
patients.67
Arterial hypertension and stiffness may also alter VAC and, thus, accelerate symptoms in AS. In a series of 193 AS patients,68
symptoms occurred earlier in the subset of hypertensive patients, despite a larger valve area. Moreover, Weisz et al.69demonstrated
that in patients with moderate to severe AS and preserved LV ejection fraction, increased carotid and aortic stiffness was independently associated with elevated LV filling pressures, B-type natriuretic peptide (BNP) levels, and symptoms.
Ventricular–arterial coupling and Zva have also important prognostic implications in patients with paradoxical low-flow, ...
...
low-gradient AS. These patients are typically elderly, hyperten-sive, with stiff aorta, elevated arterial afterload despite similar end-systolic wall stress70and high Zva. Additionally, in patients with
low-flow, low-gradient AS, Zva was associated with lower aortic mean gradient.70Moreover, higher Zva is associated with impaired
longitudinal LV systolic function71and lower survival.72,73Zva, like Ea, has limitations because the complex pulsatile afterload cannot be lumped in a single parameter. Studies utilizing proper assess-ments of pulsatile LV afterload in AS are needed.
Aortic regurgitation
Wilson et al.74 found in asymptomatic chronic aortic
regurgita-tion patients that reduced aortic distensibility was related with increased LV volumes, systolic wall stress and LV mass, and led more rapidly to aortic valve replacement (AVR). In another study,75
20 patients with non-stenotic biscuspid aortic valve had reduced aortic elasticity and LV hypertrophy compared to controls.
Interventions to improve
ventricular–arterial coupling
Arterial hypertension and stiffness may alter VAC and, thus, accelerate symptoms in AS and deteriorate prognosis in patients with paradoxical low-flow, low-gradient AS. Thus, in patients with coexisting hypertension, increased markers of arterial stiff-ness and/or impaired markers of VAC and AS, effective treat-ment of hypertension with medication which has been also shown to improve arterial wall properties may delay the occurrence or reduce the intensity of symptoms. AVR may acutely impact VAC76 and promote the recovery of mid- and long-term LV
contractility77 and LV GLS.78 However, surgical manipulations of
the aorta may impair perfusion and induce inflammation of the aortic wall, resulting in reduced aortic elastance and consequently
Figure 6 In aortic stenosis, increased systemic arterial and aortic valve load act complementarily and competitively, resulting in impaired left ventricular (LV) elastance; the compensatory mechanisms activated due to tissue hypoperfusion complicate this interaction. Ea, arterial elastance; Ees, end-systolic elastance; SNS, sympathetic nervous system; SVR, systemic vascular resistance; TAC, total arterial compliance; VAC, ventricular–arterial coupling.
to ventricular–arterial decoupling.77 The early post-AVR
deteri-oration of aortic elastance is usually followed by a progressive improvement for up to 1 year.79In the case of transcatheter
aor-tic valve replacement (TAVR), the aoraor-tic root is only minimally manipulated. The acute decrease of LV pressure overload follow-ing TAVR80results in an early reduction of valvular load as well as
improved LV energetics, as demonstrated by VAC normalization. However, VAC is not always improved post-TAVR. The post-procedural decrease in afterload results in an abrupt decrease of LV pressure and contractility (i.e. Ees), with a consequent VAC disruption.80 Moreover, the relief of valvular obstruction acutely
increases SV and thus in the context of a stiff, non-compliant aorta, may cause a disproportionate increase of systolic aortic BP, posing an excessive afterload to the left ventricle. Therefore, arterial load (i.e. Ea) is increased, negatively affecting LV efficiency81and blunting
the haemodynamic benefits of TAVR. Thus, the pre-procedural state of aortic elasticity, myocardial function and VAC may affect the response to TAVR.
Mitral regurgitation
In chronic severe organic mitral regurgitation, there is a progres-sive deterioration of LV contractile state (i.e. Ees reduction), which leads to VAC impairment that is prevented neither by stable Ea, nor by vasodilator therapy.82Thus, in chronic mitral regurgitation, the
progressive deterioration of VAC and pump efficiency suggests the potential progression to clinically overt cardiac dysfunction requir-ing mitral valve surgery.82 In 175 patients with functional mitral
...
regurgitation and dilated or ischaemic cardiomyopathy (LV ejec-tion fracejec-tion< 45%),83there was a significant association between
PWV and functional mitral regurgitation in the ischaemic group. Furthermore, the preservation of VAC after mitral clip implan-tation has been associated with an increase in forward SV, despite a reduced ejection fraction.84
Mitral stenosis
A study85of patients with severe mitral stenosis undergoing
percu-taneous balloon valvuloplasty and healthy subjects, demonstrated that mitral stenosis induced an increase in arterial stiffness that was improved after percutaneous balloon valvuloplasty.
Key points
• VAC assessment possesses diagnostic and prognostic value in valvular heart disease, over and above stenosis, regurgitation, or ejection fraction quantification.
• Systemic arterial compliance and Zva can specifically describe the haemodynamic consequences of AS.
• Zva and LV GLS offer prognostic information in AS even when asymptomatic.
• Impaired VAC may be the cause of symptoms in AS, despite a large aortic orifice.
• The pre-procedural state of VAC in the context of increased aortic stiffness may compromise the beneficial effects of AVR.
• Deteriorating VAC may suggest cardiac dysfunction in organic mitral regurgitation.
• Mitral clip implantation in functional mitral regurgitation may preserve VAC.
Ventricular–arterial coupling
in coronary artery disease
Coronary artery disease shares common pathophysiological pro-cesses with aortic stiffening.59,86 The severity of CAD has been
associated with impaired markers of arterial stiffness.86The
pres-ence of significant CAD may negatively affect LV systolic func-tion particularly in the longitudinal axis. Addifunc-tionally, an increase of the arterial load due to increased aortic stiffness may also affect LV performance.29Increased PWV was related with reduced
coronary flow reserve in CAD patients even after success-ful revascularization5 and with elevated N-terminal pro BNP
(NT-proBNP) post-myocardial infarction (Table 2).87 Myocardial
strain imaging (LV GLS< 20%)7,27has shown to detect subclinical
dysfunction in CAD patients and represents a more sensitive method of identifying LV performance.21Increased aortic stiffness
impairs LV function, mainly in the longitudinal axis, through inappro-priate VAC with mechanisms discussed in detail above (Figure 2). Thus, non-invasive measurement of VAC can provide comprehen-sive assessment of LV performance and may also be incremental to LV ejection fraction in the characterization and clinical manage-ment of CAD patients. In 891 patients with suspected or known CAD who had negative stress echocardiography (mean LV ejec-tion fracejec-tion 47%), it was shown that patients with impaired VAC reserve (measured as the change in Ea/Ees between peak stress and rest) had increased rates of all-cause mortality, compared with patients with more preserved VAC reserve.88Additionally, among
41 patients with ischaemic cardiomyopathy (LV ejection fraction 47 ± 13%), those with an Ea/Ees ratio < 1.47 had better survival than patients with higher (more impaired) Ea/Ees ratios (≥ 1.47).89
Furthermore, increased arterial wave reflections predict severe cardiovascular events in patients undergoing percutaneous coro-nary interventions, and various markers of arterial stiffness have been associated with adverse outcome in CAD.86
Key points
• There is evidence suggesting the use of LV GLS, VAC assess-ment, or aortic stiffness markers to refine risk stratification of CAD patients.
Ventricular–arterial coupling
in heart failure
Heart failure with reduced ejection
fraction
In the context of HF with reduced ejection fraction (HFrEF), as cardiac function primarily declines and LV elastance (e.g. ...
...
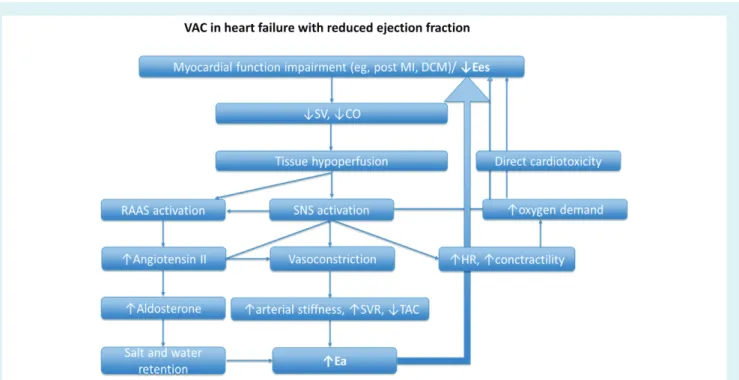
...
Ees) decreases, systemic tissue hypoperfusion occurs. The renin–angiotensin–aldosterone system and the sympathetic nervous system are consequently over-activated, in an attempt to increase intravascular volume and arterial load, and counterbal-ance the impaired systemic perfusion; thus, Ea is increased. The increased Ea along with the direct cardiotoxicity of sympathetic over-activation and the increased myocardial oxygen demands of hyper-dynamic circulation create a vicious circle predisposing to further worsening of cardiovascular function and syndrome progression (Figure 7).
Indeed, in a cohort of 466 patients with HFrEF, VAC (Ea/Ees) was strongly associated with New York Heart Association (NYHA) functional class, increase in natriuretic peptides, and adverse clinical outcomes.90
A reduced GLS91 and/or a small GLS increase after stress
echocardiography (< 19%)92have been demonstrated to be
inde-pendent prognosticators of mortality in HFrEF. Furthermore, markers of arterial stiffness (pulse pressure, PWV, central systolic BP) have been found to be independent predictors of outcome in HFrEF.93
Interventions to improve ventricular–arterial coupling in heart failure with reduced ejection fraction
Ventricular–arterial coupling may also be useful to assess response to various therapeutic approaches in chronic HF. Table 4 summa-rizes various therapeutic strategies having beneficial effects on VAC in HFrEF.53,57,59,65,94–107
In a prospective clinical trial, 38 patients with HFrEF underwent aggressive titration of vasoactive HF medications (ACE inhibitors, carvedilol, nitrates, MRAs) with assessment of central aortic waveforms.94Clinical response to treatment was assessed using the
6-min walk test, which increased in 25 patients and decreased or remained unchanged in 13. Patients with clinical improvement after therapy displayed higher baseline aortic pressure wave pulsatility (central pulse pressure, reflected pressure wave, and reservoir pressure) than patients without improvement. After treatment, aortic pressure pulsatility decreased only in patients with functional improvement. These differences in arterial load at baseline and on therapy were not apparent from conventional brachial artery cuff pressure assessments. Thus, central aortic waveform analysis may allow an individualized treatment regimen for patients with HFrEF. In a study including 877 elderly patients with HF (age ≥ 65 years, NYHA class≥ II, LV ejection fraction ≤ 45 %), treated with 𝛽-blockers, underwent Doppler echocardiography before and after 12 weeks of treatment.95 VAC, as assessed by Ea/Ees, improved
after treatment. Ea decreased from 2.73 ± 1.16 to 2.40 ± 1.01, resulting in a near-optimization of VAC ratio [from 1.70 ± 1.05 (1.46) to 1.50 ± 0.94 (1.29)]. A similar VAC response was evident in patients with ischaemic and non-ischaemic HF and was related with lower degree of HF functional class (NYHA) after𝛽-blocker administration. The strongest predictor of VAC alteration was the LV ejection fraction increase. Thus, the beneficial effect of 𝛽-blockers in elderly HF patients may have been achieved, at least partly, by VAC optimization, associated with cardiac contractility improvement.