Economic Modelling 71 (2018) 279–288
Contents lists available atScienceDirect
Economic Modelling
journal homepage:www.journals.elsevier.com/economic-modelling
Should euro area countries cut taxes on labour or capital in order to boost
their growth?
☆
Barbara Castelletti Font, Pierrick Clerc
*, Matthieu Lemoine
Banque de France, France
A R T I C L E I N F O JEL classification: E62 E63 F42 Keywords: Fiscal reforms Taxes Government spending DSGE model A B S T R A C T
The large imbalances within the euro area have led to a renewed interest in tax policies that could reduce labour costs and thus improve competitiveness and growth. In this paper, we consider whether it would be more growth-enhancing for euro area countries to, instead, use capital income tax cuts. To address this issue, we focus on the open-economy dimension and make simplifying assumptions concerning the completeness of insurance markets. Using a DSGE model calibrated for France within the euro area, we show that the increase in output resulting from tax cuts on capital income would indeed be higher than the increase in output resulting from tax cuts on labour, both in the short and long run. Importantly, the strong response of output to capital income tax cuts appears to be partly explained by the particularly high level of capital income taxes in France. Moreover, such tax cuts would be less efficient if they were expected to be only temporary. Finally, we illustrate our main points through a recent fiscal package implemented in France, which combines labour and capital income tax cuts. After briefly assessing this package, we find that investment and real output would have been more strongly boosted in the medium run if this package had been focused to a larger extent on reductions in capital income taxes.
1. Introduction
Since the launch of the euro, internal imbalances have been a strong feature of the euro area. In the absence of exchange rate adjustments, some international institutions have recommended cutting labour taxes (notably through a shift towards the consumption tax) in order to improve competitiveness, employment and growth in coun-tries suffering from current account deficits (e.g.IMF, 2014;European Commission, 2013). In practice, some governments implemented such tax reforms, e.g. Germany in 2006, while others have simultaneously reduced taxes on labour and on capital income, e.g. France in 2013. So far, the debate about the design of tax reforms has mainly focused on the effect of labour tax cuts and on the degree to which they target low wages.1
☆The views expressed in this paper do not necessarily reflect those of Banque de France. We would like to thank François Langot, Daniel Belchior, participants of the Banque de France seminar and those of the T2M 2017 conference for useful comments and suggestions.
* Corresponding author.
E-mail addresses:Barbara.CastellettiFont@banque-france.fr(B.C. Font),Pierrick.Clerc@live.fr,Pierrick.Clerc@banque-france.fr(P. Clerc),Matthieu.Lemoine@banque-france.fr(M. Lemoine).
1See for exampleCahuc and Carcillo (2014)for a study related to this targeting issue of cuts on labour income tax.Berson et al. (2016)have recently applied a general equilibrium
approach to this targeting issue. Previously, several other studies had more generally studied the impact of fiscal shifts from the labour income tax to the consumption tax, e.g.Langot et al. (2012),Fève et al. (2010),Farhi et al. (2014)orLipinska and von Thadden (2009). An exception is a recent paper ofBussière et al. (2017), who also considered cuts of capital income tax, but this paper is focused on fiscal shocks in the United States, a country with a flexible exchange rate contrary to euro area countries. Finally,Gomes et al. (2016)deal with fiscal devaluation in the euro area within EAGLE, a DSGE model close to ours.
In this paper, we consider whether it would be more growth-enhancing for euro area countries to use capital income cuts rather than labour tax cuts. More precisely, we consider two alternative schemes for tax alleviation: cutting on capital income tax, for both corporate income and capital owned by households; and reducing employers’ social con-tributions, with a more direct impact on labour costs. In contrast with the literature pioneered byChamley (1986)andJudd (1985)on capital income optimal taxation, we adopt a positive approach: we try to assess what DSGE models with usual frictions can tell us about the impact of such taxes on key macroeconomic variables, instead of looking at their optimal level with respect to welfare. We focus on the open-economy dimension and leave for further research the analysis of such effects for
https://doi.org/10.1016/j.econmod.2017.12.019 Received 25 September 2017; Accepted 29 December 2017 Available online 14 March 2018
B.C. Font et al. Economic Modelling 71 (2018) 279–288
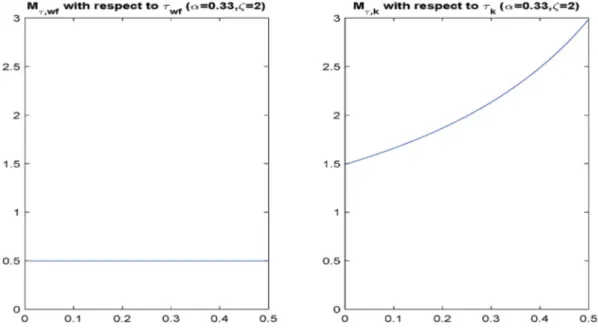
Fig. 1. Capital and labour tax multipliers as a function of tax-rate levels.
incomplete insurance-market economies.2
The contribution of this paper is twofold. In a first stage, we pro-vide simple intuitions about the different impact of these two instru-ments on economic growth by using a simple Real Business Cycle (RBC) model. Indeed, we demonstrate the stronger long-run effect on output for permanent reductions in capital income taxes. More-over, this effect is non-linear: the size of this effect increases with the level of capital income tax from which the cut is implemented. Sec-ond, we refine this quantitative analysis by building a larger DSGE model with more realistic features3and calibrated for France within
the euro area. France is chosen as an example of a euro area coun-try with current account deficits that recently experienced labour and capital income tax alleviation. Against this backdrop, we show that permanent shocks on capital income taxes have a stronger impact on output both in the short and long run. This conclusion is rein-forced for France, given the high level of capital income taxation compared to the rest of the euro area. Still, reductions in capital income taxes would be less efficient if they are only temporary, or alternatively if their implementation is perceived as imperfectly credi-ble.
We also illustrate these points by taking into account a pack-age of fiscal reforms implemented in France since 2013: the Credit d’Impôt pour la Compétitivité et l’Emploi (CICE), which was sub-sequently incorporated into a broader Responsibility and Solidar-ity Pact (“Pacte de Responsabilité et Solidarité” – PRS) in January 2015. Roughly speaking, these reforms involve reductions in labour and capital income taxes, financed by tax hikes on consumption and decreases in government spending. We first provide an assessment of this package as it was implemented. Then we show that it would have raised investment and output by a larger amount if the tax cuts had been more focused on capital income. With such an alterna-tive package, employment would have fallen somewhat in the short run (due to a degree of substitution in capital for labour) but would
2It is worth mentioning, however, that we retain two features which limit the
com-pleteness of insurance markets: non-Ricardian households and imperfect substitution of internationally exchanged bonds. In a closed-economy framework, the role of incomplete markets for tax multipliers has been studied inHeathcote (2005).
3These features include the open economy dimension of euro area countries, the role of
monetary policy, the calibration of a detailed fiscal block, the presence of non-Ricardian households and the usual set of real/nominal frictions.
have risen more in the medium run given the higher increase in out-put.
The DSGE model we build to address these issues, called the FRance in Euro Area Model (FREAM), has the following features. First, its core is similar to that of Smets and Wouters (2003), which incor-porates the main frictions necessary for obtaining realistic impulse responses. Second, the French economy is modeled as an open-economy which trades with the rest of the euro area (REA) and an exogenous rest of the world, so as to take account of the effect of competitive-ness gains. Third, the reduced weight of France within the monetary policy matters for the real interest rate reaction and its impact on investment dynamics. Fourth, we distinguish between public invest-ment and public consumption to account for a potential negative impact of governments’ investment cuts on the supply side of the econ-omy.
This model is close to NAWM, a 2-country model of the euro area and the United States, developed at the ECB by Coenen et al. (2008). However, it allows to distinguish France within the euro area. In this sense, it is very similar to EAGLE (Euro Area and GLobal Economy),4 which also builds on NAWM. FREAM is
never-theless simpler than EAGLE in two ways. First, EAGLE consists of four endogenous blocks (Germany, the rest of the euro area, the US and the rest of the world) instead of two endogenous ones (France, the rest of the euro area) and an exogenous rest of the world for FREAM. Secondly, EAGLE features tradable and non-tradable inter-mediate goods instead of only tradable interinter-mediate goods in the case of FREAM. This lightened structure for FREAM makes it eas-ier to understand the effects resulting from the interactions between regions.
This paper is structured as follows. After providing simple intuitions about the long-run impact of capital and labour taxes in a simple RBC model (Section2), we will briefly present a more detailed DSGE frame-work for studying the effect of such taxes in euro area countries (Section 3). Then, we present the simulations results obtained with this model for standard shocks (Section4). Finally, we apply our framework to the analysis of fiscal reforms implemented in France since 2013 (Section5) and we then conclude (Section6).
B.C. Font et al. Economic Modelling 71 (2018) 279–288
Fig. 2. Permanent reduction of 1% of GDP in capital taxes and SSC (France, deviation from steady state).
2. Some first insights from the steady state of a RBC model Before turning to a richer DSGE framework it is useful to illus-trate two of the main points of this paper within a simple RBC model. These points are: 1) variations in the taxation of capital incomes have a higher impact on output than those in the taxa-tion of labour for firms; 2) the existence of non-linearities in the taxation of capital. More precisely, we consider the steady-state of a model whose basic components are a utility function u(c,n) = c1−𝜎
1−𝜎 −n 1+𝜁
1+𝜁, a Cobb-Douglas production function, a nil deprecia-tion and three taxes. For simplifying the following condideprecia-tions, we assume𝜎 =1. The resulting first-order and market-clearing conditions are:
• Euler condition: 1/𝛽 =(1−𝜏K)𝛼k𝛼−1n1−𝛼+1
• Labour-market equilibrium: n𝜁c=(1−𝛼)k𝛼 n−𝛼 1+𝜏Wf
• Clearing condition & production function: c=y= (k∕n)𝛼n
• Budget constraint of govt: 0=𝜏k𝛼k𝛼n1−𝛼+𝜏Wf(1−𝛼)k𝛼 n1−𝛼 1+𝜏wf +T with c aggregate consumption, n total employment,𝜁 the inverse of the Frisch elasticity of labour-supply,𝛽the discount factor,𝜏Kthe tax
on capital income,𝛼the elasticity of production with respect to capi-tal, k the stock of capicapi-tal,𝜏Wf the tax on labour paid by employers, y aggregate output and T lump-sum taxes.
Aggregate output can be related both to𝜏k(through capital
B.C. Font et al. Economic Modelling 71 (2018) 279–288
Fig. 3. Permanent and transitory reductions in𝜏Wf of 1% of GDP (France, deviation from steady state).
y=𝜑𝛼(1−𝜏K)1𝛼−𝛼𝜇(1+𝜏Wf)− 1 𝜁+1 with 𝜑 = ( 𝛼 1∕𝛽 −1 ) 1 1−𝛼 and 𝜇 = (1−𝛼) 1 𝜁+1.
The long-run output multipliers to shocks (of -1pp of output) on𝜏Wf and𝜏Kare, respectively:
•M𝜏Wf = −1+𝜏 Wf 1−𝛼 d log y d𝜏Wf = 1 (1−𝛼)(𝜁+1) •M𝜏K= −1 𝛼d log yd𝜏K = 1 1−𝛼1−1𝜏K
The first difference between these two multipliers is that the multi-plier related to𝜏Kis always larger than that related to𝜏Wf. On the one hand, the Frisch elasticity of labour supply 1/𝜁is crucial for the multi-plier of𝜏Wf: the larger this elasticity, the larger the multiplier; with an infinite elasticity, we obtain the same multiplier as that of𝜏K. On the
other hand, even if we had not set the inter-temporal elasticity of substi-tution𝜎at 1, this parameter would not matter for the equilibrium of the capital market (Euler condition)5: since we are at the steady-state, the
ratio of marginal utilities of consumption is always equal to 1. Hence, this elasticity does not influence the response of capital intensity to shocks on𝜏K.
The second difference between these two multipliers is that the multiplier related to 𝜏K does depend on the actual rate of
capi-tal taxation, whereas the multiplier related to𝜏Wf does not depend on the actual rate of labour taxation for employers. Moreover, the multiplier related to 𝜏K is a positive function of the actual rate
5If we had not set at 1 this inter-temporal elasticity of substitution, it would still appear
in the equation of the labour-market equilibrium, but it would not qualitatively change our two results at least for reasonable values (between 1 and 2).
of capital taxation. Hence, the higher the level of capital taxa-tion, the larger the increase in output resulting from a reduction in 𝜏K. Fig. 1 gives a numerical illustration for standard values of 𝛼
and𝜁.
The left panel ofFig. 1delivers the long-run multipliers of a decrease (representing 1pp of output) of𝜏Wf. These multipliers are equal to 0.5, irrespective of the level of𝜏Wffrom which the decrease is implemented. The right panel ofFig. 1provides the long-run multipliers of a reduc-tion (still representing 1pp of output) of 𝜏K. In this case, whatever
the level of taxation, the multipliers are higher than those of reduc-tions in𝜏Wf. Moreover, these multipliers are increasing (in absolute value) in the level of𝜏Kfrom which the reduction is implemented. For
instance, the multiplier is equal to 1.7 when the initial level of𝜏Kis
10%, whereas it amounts to 3 for an initial level of 𝜏K at 50%. An
interesting comparison, which we will consider in more depth below, lies between the value of the multiplier of𝜏K for France and for the
Rest of the Euro Area (REA). In France,𝜏Kis around 36%. This implies
a long-run multiplier of 𝜏K equal to 2.35. In the REA, 𝜏K amounts
to 27% on average. This entails a long-run multiplier of 𝜏K equal
to 2.
3. FREAM: a multi-country DGSE approach to fiscal policy This section presents the main features lying at the core of FREAM, a model for the French economy in the context of the euro area. We particularly highlight those aspects with a meaningful role for fiscal policy, on which our analysis focuses. Given that FREAM largely builds on the version of NAWM developed byCoenen et al. (2008), the full model and its derivation are detailed in theAppendixof the working paper of this article.6
B.C. Font et al. Economic Modelling 71 (2018) 279–288
Fig. 4. Permanent and transitory reductions in𝜏Kof 1% of
GDP (France, deviation from steady state).
3.1. Brief description of FREAM
FREAM is a multi-country DSGE comprising two symmetric regions, France and the REA, trading both goods and government bonds between them and with an exogenous rest of the world (RoW, indexed with an asterisk*). In each region, there are four types of economic agents:
households, firms, a fiscal authority and a monetary authority.
Households are shared between Ricardian households, who have access to financial markets and own capital, and Non-Ricardian ones who can only hold money and consume their current income in each period. There are two subsets of firms: producers of tradable differenti-ated intermediate goods who operate on monopolistically competitive markets with sticky prices, and producers of non-tradable goods who trade these goods on competitive markets with flexible prices. The
gov-Fig. 5. Permanent reduction of 1% of GDP for different ini-tial values of𝜏K(France, deviation from steady state).
B.C. Font et al. Economic Modelling 71 (2018) 279–288
Table 1
CICE-PRS measures (cumulated EUR billion).
2014 2015 2016 2017
Expansionary measures SSC employers (𝜏tWf) 0.0 −5.5 −8.6 −9.6
SSC households (𝜏tWh) −1.3 −2.9 −4.9 −4.9
Corporate income tax (𝜏K
t) 0.0 −1.0 −4.0 −9.5
CICE tax credita(𝜏Wf
t ,𝜏tK) −10.2 −17.3 −18.5 −19.3
Recessionary measures VAT and ecological taxes (𝜏C
t) 6.2 9.9 12.7 13.8
Gov. consumption (Gt) −3.0 −9.5 −13.7 −18.2
Transfers (TRt) −1.3 −4.0 −3.2 −3.3
Public investment (IG, t) −1.1 −3.4 −6.4 −8.1
a In the “baseline” scenario, the CICE tax credit is assigned in equal shares (50%) to𝜏Wf
t and𝜏tK. In the “alternative” case
we assume that the whole amount of the CICE (100%) is assigned to𝜏K t.
Source: Banque de France calculations.
ernment raises taxes and provides public spending with a fiscal policy rule ensuring long-run sustainability. The central bank sets the nominal interest rate for the euro area as a whole (France and REA are in a mon-etary union and share the same monmon-etary policy), following a standard Taylor-type rule.7
3.2. Inclusion of fiscal shocks in the model
In order to better capture the effects on the economy of the differ-ent public spending instrumdiffer-ents, we split the public demand into public consumption (Gt) and investment (IG,t). The main difference between
these two components lies in the assumption that public investment is productive and, therefore, enhances the production function of private firms. In contrast, public consumption affects aggregate demand with-out impacting on the private sector.
The budget constraint of the fiscal authority will, therefore, reflects the purchases of the two aforementioned public goods. In addition, the government makes social transfers (TRt), issues bonds to
refi-nance its debt (R−1
t Bt+1−Bt) and earns seigniorage on money
hold-ings (Mt−Mt−1). In order to finance public spending, the government
raises taxes on consumption (𝜏tC), incomes stemming from capital (𝜏tK) and labour (𝜏N
t ) and social security contributions from employers (𝜏 Wf
t )
and workers (𝜏Wh
t ). In what follows, we will focus on shocks on𝜏tK
and𝜏tWf. The period-by-period budget constraint then has the following form: PG,tGt+PIG,tIG,t+TRt+Bt+Mt−1 =𝜏C tPC,tCt+ ( 𝜏N t +𝜏 Wh t ) ( ∫ 1−𝜔 0 Wi,tNi,tdi+∫ 1 1−𝜔 Wj,tNj,tdj ) +𝜏tWfWtNt+𝜏Kt ( RK,tut− (Γu(ut) +𝛿)PI,t ) Kt +𝜏D tDt+Tt+Rt−1Bt+1+Mt
A fiscal rule is assumed to stabilise the government debt-to-output ratio towards the desired target BY as depicted in the following equation. 𝜏N t =𝜙BY ( Bt PYY −BY )
We set the tax rate on labour income (𝜏N) as the instrument that allows
the debt ratio to stabilise in the long run at its target value. Further-more, we assume that labour income taxes react to the change in the debt ratio with a 10-year lag, so as to isolate the short-run responses to shocks on budgetary variables from the fiscal rule in short and medium run. In order to ensure comparability across the figures, the size of stan-dard shocks is set to 1 per cent of GDP. Since we are dealing with tax rates in our simulations, the shock is calculated in such a way that the
7This implies that the exchange rate is constant within the euro area.
initial change in the particular tax revenue is equal to a 1 per cent of the initial steady state GDP, thus considering the size of the tax base.
Our model is calibrated so as to reproduce the main macroeconomic aggregates observed in recent years for the three blocks of countries in FREAM. Because of the nature of our work, we devote special atten-tion to the indicators that reproduce fiscal aggregates by compiling observed data. This strategy is presented in more detail in Section B of theAppendix.
4. Simulation results for standard shocks
In this section, we use FREAM to asses the effect on the economy for three standard scenarios involving capital and labour tax alleviation. We notably run simulations for shocks on𝜏K
t and𝜏
Wf
t in three cases: 1)
permanent shocks with the baseline calibration; 2) transitory shocks; 3) and a permanent shock on𝜏K
t with a lower initial level in France.
4.1. Permanent reduction of capital and labour taxes
In this subsection we describe the main results of a permanent reduc-tion of 1pp of GDP in𝜏K
t and𝜏
Wf
t . We contrast the potential benefits
of each tax cut with a special focus on the dynamics of real output, employment and private investment. We analyse the impact of both policies over the medium term, i.e. for a time horizon of 4 years over which the measures are fully implemented. We also assess the impact of the measures over the long term, i.e. for a time horizon of 10 years over which the variables subject to adjustment costs have the time to converge.
Fig. 2suggests that both scenarios significantly foster output growth, employment and private investment in the long run. Nonetheless, we also demonstrate that the way fiscal stimuli are implemented is crucial to determine the final outcome and the macroeconomic objective that is sought. Indeed, and in accordance with the results of Section2, a permanent cut in taxes on capital income generates much larger posi-tive long-run responses of output and private investment than a perma-nent cut in firms’ social security contributions.8A reduction in capital
income taxes, however, is likely to be a less desirable choice in terms of labour in the short and medium run, especially for those households with no ability to participate in asset markets.
When analysing the impact of the capital income tax shock (blue lines in Fig. 2), a substantial rise in private investment is observed. Recall that due to the standard assumption of adjustment costs on the rate of growth of private investment, its level depends on the discounted
8Qualitatively, we would get similar results when implementing simultaneous shocks
in France and in the rest of the euro area. The response of output and investment would also be larger for cuts of the capital income tax than for those of the tax on labour. This is also the case when we use different values for the parameters𝛼Gand𝜂. Results are
B.C. Font et al. Economic Modelling 71 (2018) 279–288
Fig. 6. Effect of the CICE-PRS “baseline” scenario, by shock contribution (France, deviation from steady state).
sum of all expected future values of Tobin’s Q. In the first periods, Tobin’s Q declines since there is a jump in the real interest rate. The rise in this rate results from the fall in inflation (tax reductions imply a decrease in firms’ marginal costs) while the nominal interest rate is constant, given that it is determined at the euro area level as a whole. Subsequently, however, higher (after tax) returns on capital entail a large and persistent increase in Tobin’s Q which more than offsets its initial decline over private investment.
The substantial rise in private investment more than offsets the fall in private consumption, which implies an overall increase in real out-put. Private consumption decreases since the real interest rate jumps. At the same time, a decrease in𝜏Kmakes capital more attractive and then
generates a subsequent reallocation of production inputs from labour to capital. This produces a lower labour demand and thus a reduced level of employment in the short to medium run. In the long term, neverthe-less, the fall in𝜏K, by significantly fostering real output, raises labour
demand and employment. The behaviour of employment is reflected in the dynamics of the real wage, which initially declines (due to the fall in labour demand) before gradually increasing (due to the rise in labour demand).
Turning to the trade balance, the fall in𝜏Kimplies a decrease in
marginal costs and thus in export prices. French terms-of-trade there-fore deteriorate, which creates an initial deficit of the trade balance. As time passes, the fall in export prices improves competitiveness, lead-ing foreign countries to substitute French goods for their own domes-tic goods. Moreover, the terms-of-trade of these countries improve, entailing a positive wealth-effect which generates an increase in foreign aggregate demand and then in French exports. The competitiveness and wealth effects explain why the trade balance gradually displays a sur-plus. In the long run, however, the large increase in French aggregate demand (mainly due to private investment) turns into an increase in imports, which cancels out both the competitiveness and wealth effects
B.C. Font et al. Economic Modelling 71 (2018) 279–288
Fig. 7. Effect of the CICE-PRS (“baseline” and “alternative” scenarios) (France, deviation from steady state).
on the trade balance.
Consider now the shock on labour tax (red lines in Fig. 2). The decrease in𝜏Wf generates an increase in labour demand which results in a persistent increase in both employment and real wages. This, in turn, enhances permanent income and therefore private consumption. This increase in private consumption (as well as in exports) somewhat raises expected returns on capital, Tobin’s Q and private investment. The rise in this latter variable is nevertheless much smaller than for a reduction in the capital income tax. Overall, and consistent with what we found in Section2, the increase in real output is also much lower than in the case of a cut in𝜏K.
At the same time, the impact of a lower𝜏Wf on firms’ marginal costs is partly offset by the increase in real wages. Hence, inflation declines to a lower extent than for a reduction in𝜏K. The same reasoning applies to
export prices, so that the deterioration in French terms-of-trade is less pronounced. On the other hand, the competitiveness and wealth effects are also lower than in the case of a shock on𝜏K. All this explains why
the movements in the trade balance are less pronounced.
To sum up, a permanent reduction in𝜏Kis particularly well suited to
foster private investment, real output and even employment in the long run. Alternatively, a permanent cut in𝜏Wf seems the required policy to implement in order to raise employment (notably in the medium run), real wages and, to a lesser extent, private consumption.
B.C. Font et al. Economic Modelling 71 (2018) 279–288
4.2. Transitory reduction in capital and labour taxes
In the last subsection, we focused our attention on permanent shocks on 𝜏K and 𝜏Wf. We now consider transitory shocks on these taxes. Indeed, the red lines inFigs. 3 and 4show the responses of reductions in 𝜏Kand𝜏Wf, respectively (still amounting to 1pp of GDP), which last for 10 years. These taxes then revert back instantly to their initial values. For the sake of comparison, we reproduce (blue lines) the responses of permanent shocks computed inFig. 2. It is worth noting that in the liter-ature, transitory shocks are also meant to represent imperfect credibility of government in implementing tax cuts. Under this alternative inter-pretation, the government announces a permanent reduction in taxes (and effectively enforces it) but private agents believe that this tax cut will last only ten years.
Fig. 3makes clear that the response of the main variables is quite independent from the duration of the cut in𝜏Wf. In other words, the impact of reductions in the taxation of labour for firms does not depend on the credibility of the government in implementing this tax cut.
On the other hand,Fig. 4stresses that the duration of the shock in 𝜏K, or the credibility of the government to enforce this tax cut
perma-nently, is critical: the impact of the permanent tax reduction (full cred-ibility) is much higher than the impact of the transitory tax reduction (imperfect credibility), most notably for investment and real output. This is probably related to the change in the steady state that occurs in the former case.
Indeed, the permanent reduction in 𝜏K is financed by an increase
in𝜏N, through the fiscal rule. However,𝜏Kis more distortive than𝜏N,
which implies a change in the steady state. Expectations of this change by private agents could lead them to amplify their response in the short run. This could explain the large difference with the transitory tax cut, for which the steady state is obviously unchanged. At the same time, the permanent reduction in𝜏Wf is also financed by a rise in 𝜏N. But 𝜏Wfand𝜏Nhave the same degree of distortion, which leaves the steady
state unchanged. Hence, the steady state remains the same for a perma-nent as well as for a transitory reduction in𝜏Wf. This could explain the relative similarity in the responses to reductions of different durations in this tax.
4.3. Non-linearity in the taxation of capital: an assessment with FREAM
We have shown in Section2, within the steady-state representation of a simple RBC model, that the long-run multipliers of variations in the taxation of capital incomes depend on the taxation level from which these variations are implemented. This stands in sharp contrast with the taxation of labour for firms, for which the long-run multipliers are independent from the actual level of taxation. In order to provide a more precise picture of the non-linearities in capital taxation, notably in the short-run, we now illustrate the impact of variations in this taxation with FREAM.
Fig. 5delivers the responses of real output, investment, employment and real wages to a permanent reduction in capital taxation (amounting to 1pp of GDP) for France. The blue line represents these responses for an initial capital tax rate of 36%, which is the actual rate in France. The responses are the same as the ones we generated inFig. 2. At the peak, private investment rises by 10%, employment by 0.8% and real output by 2.3%. The red line represents the responses if France had the same capital income taxation as in the REA, namely 27%. In this counter-factual case, private investment would rise by 7%, employment by 0.55% and real output by 1.7%.
Consistent with the findings of Section2, the impact of a reduc-tion in𝜏K is larger when this rate is high. The results ofFig. 5
there-fore extend those of Section2 in our richer model and we see that the non-linearity also matters in the short-run. Moreover, the stronger impact is particularly striking for private investment, since this variable is directly impacted by the variations in𝜏K.
5. An application: the assessment of the CICE-Responsibility and Solidarity Pact
In what follows, we consider the instruments involved in a recent fiscal package implemented in France: the Crédit d’Impôt pour la Com-pétitivité et l’Emploi (CICE), launched in 2013, and thereafter included in the broader Pacte de Responsabilité et de Solidarité (PRS). Our inter-est in analysing these fiscal reforms stems from the fact that they involve a reduction in labour taxes and capital income taxes at the same time. Their official aim is to boost real output growth, compet-itiveness and job creations. We will first provide a brief assessment of this package. Then, we will show that if the tax reductions contained in the CICE had been directed entirely towards capital income taxes, the whole package would have achieved its objectives more success-fully.
Strictly speaking, the CICE constitutes a tax credit against capi-tal income taxes, which is computed as a share of the gross pay-roll. It should therefore be simulated as a reduction in 𝜏K
t.
How-ever, the classification of the CICE is not a clear-cut issue. Because of its design (as a share of total gross payroll), we could also inter-pret it as a cut of labour taxes. This is why many assessments of this package consider that it mainly corresponds to a reduction in 𝜏Wf
t . Here, in our “baseline” scenario, we assume that the amount
involved in the CICE corresponds to reductions in equal shares of both labour and capital income taxes. Conversely, in our “alternative” sce-nario, we simulated the counter-factual case, where the whole amount of the CICE would have been devoted to cuts in capital income taxes.
In addition, the PRS involves a clear reduction in the social security contributions of employers and in capital income taxes. Moreover, a “solidarity” component decreases personal income taxes paid by low-income households. The cost of the whole CICE-PRS is expected to be financed by cuts in public spending, by a new environmental tax, and by increases in the VAT rates. Official announcements point to public expenditure cuts of EUR 50 billion for the 2014–17 period.Table 1 illustrates the composition of the PRS.
In order to focus the analysis only on the impact of cuts of labour and capital income taxes, our simulations (for both our “baseline” and “alternative” scenarios) do not include the aforementioned financing measures.9Results are displayed inFig. 6.
Fig. 6 shows that in the medium run, the CICE-PRS enhances real output, private investment and employment. With respect to the initial steady state, the three target variables show an improve-ment at the end of the period of about 2%, 9% and 0.7%, respec-tively. This expansionary effect on real output is mainly driven by the contribution of the shock on capital taxes (green bars in figure Fig. 6). In the short run, however, results are more bal-anced. Indeed, the application of the CICE-PRS triggers an imme-diate decline in employment of nearly 0.4%, which is absorbed in the following periods once activity recovers. Moreover, there is a mild decline in real output, due to the fall in private consump-tion.
The short-run fall in employment can be explained as follows. Cuts in𝜏tKand𝜏tWf(represented by the green and yellow bars inFig. 6) imply a substitution-effect regarding the other productive factor. In spite of the fact that the two initial shocks correspond to similar amounts in level, there is a whole substitution of capital for labour because of the difference in the tax base. In fact, since the tax base of𝜏K
t is smaller
than that for 𝜏tWf, a similar shock in level translates into a higher decrease in the tax rate. In the long run, however, the reduction in 𝜏K
t fosters real output, which drives labour demand and employment
up.
B.C. Font et al. Economic Modelling 71 (2018) 279–288
Foreign trade does not contribute to output growth in the long term although it has a positive impact in the first two years of implemen-tation. The main driver behind this trend is the cut in capital income taxes. After an improvement in French competitiveness (embodied by the fall of inflation) in the first years, the strong increase in domestic demand (mainly through private investment) generates a trade deficit in the medium run.
The red lines of Fig. 7 illustrate the results of our “alternative” scenario, which would have been obtained if the total amount devoted to the CICE had been concentrated on reductions in 𝜏K
t.
For the sake of comparison, the results of our “baseline” scenario, for which the amount involved in the CICE is shared equally between reductions in 𝜏Wf
t and reductions in 𝜏tK, are also restated
(blue lines).
Consistent with what we found in Section4, the increase in pri-vate investment related to the “alternative” scenario would have been larger than that in the “baseline” scenario. Similarly, in the medium run, the rise in real output and in employment would also have been higher for the “alternative” case. Conversely, in the short run, the decline in employment would have been more pronounced with this scenario. Hence, a package more targeted towards cuts in cap-ital income taxation would have improved private investment, real output and employment in the medium run to a larger extent, but at the expense of a deeper contraction of employment in the short run.
6. Conclusion
In this paper, we have shown (both for the short and the long run) that the basic ranking of tax multipliers of a RBC model is unchanged in a richer model of a euro area country that shares a common currency with the rest of the euro area: cuts in capital income tax have more powerful effects on real output than cuts in labour taxes for firms. Still, cuts in capital income taxes have detrimental effects on employment in the short and medium run. We have also stressed that the advantage of such tax reductions would be attenuated if the initial level of the tax rate was not as high as the French level, or if these tax reductions were expected to be only temporary. We finally assessed the impact of a recent fiscal package that was recently implemented in France, which combines both types of tax cuts, and argued that this package would have more substantially raised real output and employment in the medium run if the tax reductions had been more concentrated upon capital income.
For further research, the main issue would be to analyse how these results would be changed in a model that allows for incom-plete insurance-markets. As such an assumption should matter greatly for consumption dynamics, it would be interesting to analyse its implications for the positive issues that we have looked at in this paper.
Appendix A. Supplementary data
Supplementary data related to this article can be found athttps:// doi.org/10.1016/j.econmod.2017.12.019.
References
Berson, C., Devulder, A., Langot, F., Malgouyres, C., 2016. Maquette France-Zone Euro, Évaluation de politiques de baisse du coût du travail en France. Mimeo.
Bussière, M., Ferrara, L., Juillard, M., Siena, D., 2017. Can Fiscal Budget-neutral Reforms Stimulate Growth? Model-based Results. Working papers 625. Banque de France. Cahuc, P., Carcillo, S., 2014. Alléger le coû t du travail pour augmenter l’emploi. Etudes
de l’Institut Montaigne.
Castelletti, B., Clerc, P., Lemoine, M., 2017. Should Euro Area Countries Cut Taxes on Labour or Capital in Order to Boost Their Growth? Working Paper 634. Banque de France.
Chamley, C., 1986. Optimal taxation of capital income in general equilibrium with infinite lives. Econometrica 54 (3).
Coenen, G., McAdam, P., Straub, R., 2008. Tax reform and labor-market performance in the Euro Area: a simulation-based analysis using the new area-wide model. J. Econ. Dynam. Contr. 32 (8).
European Commission, 2013. Tax reforms in EU member states 2013. Eur. Econ. 5 2013. Farhi, E., Gopinath, G., Itskhoki, O., 2014. Fiscal devaluations. Rev. Econ. Stud. 81 (2). Fève, P., Sahuc, J.-G., Matheron, J., 2010. La TVA sociale : bonne ou mauvaise idée?
Écon. Prévision 193 (2).
Gomes, S., Jacquinot, P., Pisani, M., 2012. The EAGLE: a model for policy analysis of macroeconomic interdependence in the Euro Area. Econ. Modell. 29 (5). Gomes, S., Jacquinot, P., Pisani, M., 2016. Fiscal devaluation in the euro area: a
model-based analysis. Econ. Modell. 52 (Part A).
Heathcote, J., 2005. Fiscal policy with heterogeneous agents and incomplete markets. Rev. Econ. Stud. 72 (1).
IMF, October 2014. Back to work: how fiscal policy can help. Fiscal Monit. Judd, K.L., 1985. Redistributive taxation in a simple perfect foresight model. J. Publ.
Econ. 28 (1).
Langot, F., Patureau, L., Sopraseuth, T., 2012. Optimal Fiscal Devaluation. CEPREMAP Working Papers, No.1202.
Lipinska, A., von Thadden, L., 2009. Monetary and Fiscal Policy Aspects of Indirect Tax Changes in a Monetary Union. ECB Working Paper Series, No.1097.
Smets, F., Wouters, R., 2003. An estimated dynamic stochastic general equilibrium model of the Euro Area. J. Eur. Econ. Assoc. 1 (5).
Further reading
Artus, P., Bozio, A., Garcia-Penalosa, C., 2013. Fiscalit é des Revenus du Capital. Notes du conseil d’analyse économique, No. 9.
Baxter, M., King, R., 1993. Fiscal policy in general equilibrium. Am. Econ. Rev. 83 (3). Christoffel, K., Coenen, G., Warne, A., 2008. The New Area-wide Model of the Euro
Area: a Micro-founded Open-economy Model for Forecasting and Policy Analysis. Working Paper Series 0944. European Central Bank.
Clancy, D., Jacquinot, P., Lozej, M., 2014. The Effects of Government Spending in a Small Open Economy within Monetary Union. Working Paper Series No.1727. European Central Bank.
Kilponen, J., Pisani, M., Schmidt, S., Corbo, V., Hledik, T., Hollmayr, J., Hurtado, S., Júlio, P., Kulikov, D., Lemoine, M., Lozej, M., Lun, 2015. Comparing Fiscal Multipliers across Models and Countries in Europe. Working Paper Series 1760European Central Bank.
Leeper, E., Walker, T., Yang, S., 2010. Government investment and fiscal stimulus. J. Monetary Econ. 57 (8).
Straub, R., Tchakarov, I., 2007. Assessing the Impact of a Change in the Composition of Public Spending: a DSGE Approach. Working Paper Series 0795, European Central Bank.
World Economic Outlook, October 2014. Is it Time for an Infrastructure Push ? the Macroeconomic Effects of Public Investment. Chapter 3. International Monetary Fund.