HAL Id: dumas-00910194
https://dumas.ccsd.cnrs.fr/dumas-00910194
Submitted on 27 Nov 2013
HAL is a multi-disciplinary open access
archive for the deposit and dissemination of
sci-entific research documents, whether they are
pub-L’archive ouverte pluridisciplinaire HAL, est
destinée au dépôt et à la diffusion de documents
scientifiques de niveau recherche, publiés ou non,
Volatility in the Mexican offshoring industry
Myriam Alejandra Gómez Cárdenas
To cite this version:
Myriam Alejandra Gómez Cárdenas. Volatility in the Mexican offshoring industry. Economics and
Finance. 2013. �dumas-00910194�
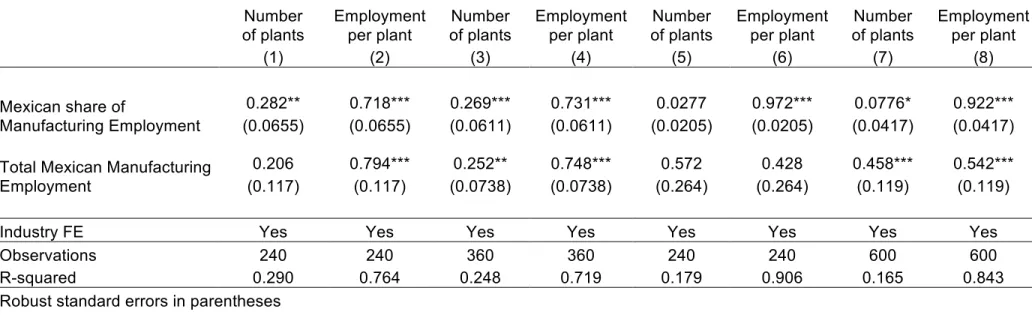
Table A1: Employment Adjustment in the Mexican Manufacturing Industry: Extensive Margins
Number
of plants
Employment
per plant
Number
of plants
Employment
per plant
Number
of plants
Employment
per plant
Number
of plants
Employment
per plant
(1)
(2)
(3)
(4)
(5)
(6)
(7)
(8)
Mexican share of
Manufacturing Employment
0.282**
0.718***
0.269***
0.731***
0.0277
0.972***
0.0776*
0.922***
(0.0655)
(0.0655)
(0.0611)
(0.0611)
(0.0205)
(0.0205)
(0.0417)
(0.0417)
Total Mexican Manufacturing
Employment
0.206
0.794***
0.252**
0.748***
0.572
0.428
0.458***
0.542***
(0.117)
(0.117)
(0.0738)
(0.0738)
(0.264)
(0.264)
(0.119)
(0.119)
Industry FE
Yes
Yes
Yes
Yes
Yes
Yes
Yes
Yes
Observations
240
240
360
360
240
240
600
600
R-squared
0.290
0.764
0.248
0.719
0.179
0.906
0.165
0.843
Robust standard errors in parentheses
*** p<0.01, ** p<0.05, * p<0.1
Notes: Columns (1) to (8) show regressions of either the number of plants or employment per plant on the Mexican share of manufacturing employment and on total Mexican manufacturing employment. Columns (1) and (2) contain a sample of the domestic manufacturing industries corresponding to the 4 most representative maquiladora sectors. Columns (3) and (4) report results for a sample containing the domestic manufacturing industries corresponding to the 6 most representative maquiladora sectors. Columns (5) and (6) contain a sample of the domestic manufacturing industries corresponding to the 4 least representative maquiladora sectors. Columns (7) and (8) contain the sample of the domestic manufacturing industries corresponding to the 10 maquiladora sectors. Each series is in log values, seasonally adjusted, and HP filtered. Data is presented at a monthly frequency from 2005:1 to 2009:12. Regressions include controls for industry fixed effects. Standard errors (clustered by industry) are in parentheses.
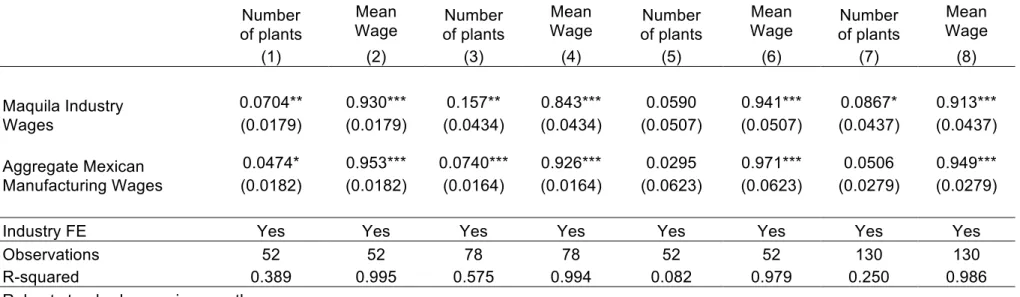
Table A2: Wage Adjustment in the Maquiladora Industry during a Crisis: Extensive Margins (1994-1995)
Number
of plants
Mean
Wage
of plants
Number
Mean
Wage
of plants
Number
Mean
Wage
of plants
Number
Mean
Wage
(1)
(2)
(3)
(4)
(5)
(6)
(7)
(8)
Maquila Industry
Wages
0.0704**
0.930***
0.157**
0.843***
0.0590
0.941***
0.0867*
0.913***
(0.0179)
(0.0179)
(0.0434)
(0.0434)
(0.0507)
(0.0507)
(0.0437)
(0.0437)
Aggregate Mexican
Manufacturing Wages
0.0474*
0.953***
0.0740***
0.926***
0.0295
0.971***
0.0506
0.949***
(0.0182)
(0.0182)
(0.0164)
(0.0164)
(0.0623)
(0.0623)
(0.0279)
(0.0279)
Industry FE
Yes
Yes
Yes
Yes
Yes
Yes
Yes
Yes
Observations
52
52
78
78
52
52
130
130
R-squared
0.389
0.995
0.575
0.994
0.082
0.979
0.250
0.986
Robust standard errors in parentheses
*** p<0.01, ** p<0.05, * p<0.1
Notes: Columns (1) to (8) show regressions during a period of crisis of either the number of plants or mean wages on the maquiladora share of aggregate mean wages and on Mexican manufacturing mean wages. Columns (1) and (2) contain a sample of the 4 most representative maquiladora sectors. Columns (3) and (4) report results for a sample containing the 6 most representative maquiladora sectors. Columns (5) and (6) contain a sample of the 4 least representative maquiladora sectors. Columns (7) and (8) contain the whole extended sample of the 10 maquiladora sectors. Each series is in log values, seasonally adjusted, and HP filtered. Data is presented at a monthly frequency from 1994:8 to 1995:8. Regressions include controls for industry fixed effects. Standard errors (clustered by industry) are in parentheses.
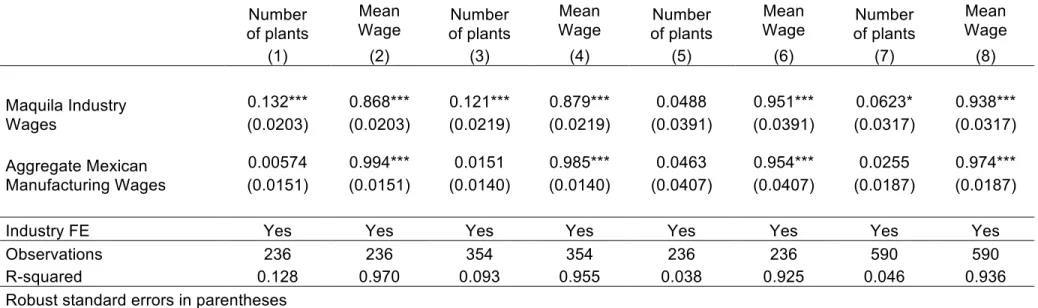
Table A3: Wage Adjustment in the Maquiladora Industry during a Rebound Period: Extensive Margins (1995-2000)
Number
of plants
Mean
Wage
of plants
Number
Mean
Wage
of plants
Number
Mean
Wage
of plants
Number
Mean
Wage
(1)
(2)
(3)
(4)
(5)
(6)
(7)
(8)
Maquila Industry
Wages
0.132***
0.868***
0.121***
0.879***
0.0488
0.951***
0.0623*
0.938***
(0.0203)
(0.0203)
(0.0219)
(0.0219)
(0.0391)
(0.0391)
(0.0317)
(0.0317)
Aggregate Mexican
Manufacturing Wages
0.00574
0.994***
0.0151
0.985***
0.0463
0.954***
0.0255
0.974***
(0.0151)
(0.0151)
(0.0140)
(0.0140)
(0.0407)
(0.0407)
(0.0187)
(0.0187)
Industry FE
Yes
Yes
Yes
Yes
Yes
Yes
Yes
Yes
Observations
236
236
354
354
236
236
590
590
R-squared
0.128
0.970
0.093
0.955
0.038
0.925
0.046
0.936
Robust standard errors in parentheses
*** p<0.01, ** p<0.05, * p<0.1
Notes: Columns (1) to (8) show regressions during a rebound period of either the number of plants or mean wages on the maquiladora share of aggregate wages and on Mexican manufacturing wages. Columns (1) and (2) contain a sample of the 4 most representative maquiladora sectors. Columns (3) and (4) report results for a sample containing the 6 most representative maquiladora sectors. Columns (5) and (6) contain a sample of the 4 least representative maquiladora sectors. Columns (7) and (8) contain the whole extended sample of the 10 maquiladora sectors. Each series is in log values, seasonally adjusted, and HP filtered. Data is presented at a monthly frequency from 1995:9 to 2000:7. Regressions include controls for industry fixed effects. Standard errors (clustered by industry) are in parentheses.
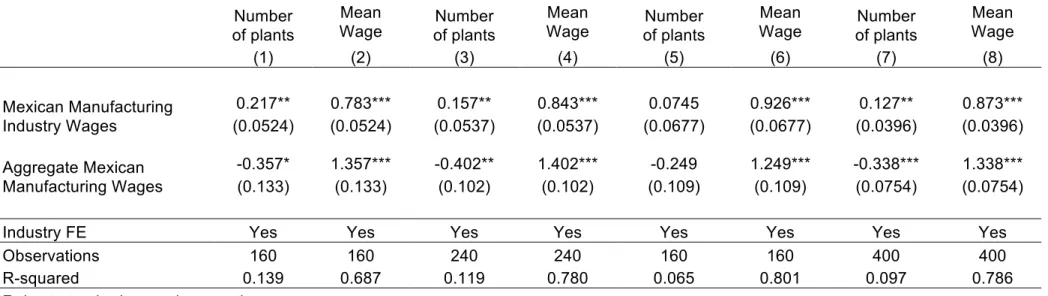
Table A4: Wage Adjustment in the Mexican Manufacturing Industry during a Rebound Period: Extensive Margins (2005-2008)
Number
of plants
Mean
Wage
of plants
Number
Mean
Wage
of plants
Number
Mean
Wage
of plants
Number
Mean
Wage
(1)
(2)
(3)
(4)
(5)
(6)
(7)
(8)
Mexican Manufacturing
Industry Wages
0.217**
0.783***
0.157**
0.843***
0.0745
0.926***
0.127**
0.873***
(0.0524)
(0.0524)
(0.0537)
(0.0537)
(0.0677)
(0.0677)
(0.0396)
(0.0396)
Aggregate Mexican
Manufacturing Wages
-0.357*
1.357***
-0.402**
1.402***
-0.249
1.249***
-0.338***
1.338***
(0.133)
(0.133)
(0.102)
(0.102)
(0.109)
(0.109)
(0.0754)
(0.0754)
Industry FE
Yes
Yes
Yes
Yes
Yes
Yes
Yes
Yes
Observations
160
160
240
240
160
160
400
400
R-squared
0.139
0.687
0.119
0.780
0.065
0.801
0.097
0.786
Robust standard errors in parentheses
*** p<0.01, ** p<0.05, * p<0.1
Notes: Columns (1) to (8) show regressions during a rebound period of either the number of plants or mean wages on the Mexican manufacturing share wages and on Mexican manufacturing aggregate wages. Columns (1) and (2) contain a sample of the domestic manufacturing industries corresponding to the 4 most representative maquiladora sectors. Columns (3) and (4) report results for a sample containing the domestic manufacturing industries corresponding to the 6 most representative maquiladora sectors. Columns (5) and (6) contain a sample of the domestic manufacturing industries corresponding to the 4 least representative maquiladora sectors. Columns (7) and (8) contain the sample of the domestic manufacturing industries corresponding to the 10 maquiladora sectors. Each series is in log values, seasonally adjusted, and HP filtered. Data is presented at a monthly frequency from 2005:1 to 2008:4. Regressions include controls for industry fixed effects. Standard errors (clustered by industry) are in parentheses.