Science Arts & Métiers (SAM)
is an open access repository that collects the work of Arts et Métiers Institute of Technology researchers and makes it freely available over the web where possible.
This is an author-deposited version published in: https://sam.ensam.eu Handle ID: .http://hdl.handle.net/10985/11396
To cite this version :
Patrick BOT, Marc RABAUD, Goulven THOMAS, Alessandro LOMBARDI, Charles LEBRET -Sharp Transition in the Lift Force of a Fluid Flowing Past Nonsymmetrical Obstacles: Evidence for a Lift Crisis in the Drag Crisis Regime - Physical Review Letters - Vol. 117, p.234501-1 à 5 - 2016
Any correspondence concerning this service should be sent to the repository Administrator : archiveouverte@ensam.eu
Sharp Transition in the Lift Force of a Fluid Flowing Past Nonsymmetrical Obstacles:
Evidence for a Lift Crisis in the Drag Crisis Regime
Patrick Bot,1,* Marc Rabaud,2 Goulven Thomas,1 Alessandro Lombardi,1 and Charles Lebret1
1Naval Academy Research Institute, IRENAV CC600, 29240 Brest Cedex 9, France
2Laboratoire FAST, Univ. Paris-Sud, CNRS, Université Paris-Saclay, F-91405 Orsay, France
(Received 3 February 2016; revised manuscript received 6 October 2016; published 29 November 2016) Bluff bodies moving in a fluid experience a drag force which usually increases with velocity. However in a particular velocity range a drag crisis is observed, i.e., a sharp and strong decrease of the drag force. This counterintuitive result is well characterized for a sphere or a cylinder. Here we show that, for an object breaking the up-down symmetry, a lift crisis is observed simultaneously to the drag crisis. The term lift crisis refers to the fact that at constant incidence the time-averaged transverse force, which remains small or even negative at low velocity, transitions abruptly to large positive values above a critical flow velocity. This transition is characterized from direct force measurements as well as from change in the velocity field around the obstacle.
DOI:10.1103/PhysRevLett.117.234501
Drag crisis is a puzzling phenomenon of fluid mechanics that contradicts common intuition: in a range of traveling speed the drag force exerted on a bluff body sharply falls with velocity. This phenomenon, first observed by Eiffel more than a century ago [1,2], is well described in text-books[3]. See also Ref. [4] for a review of flows past a circular cylinder and Ref.[5]for spectacular visualizations around a sphere. Such visualizations demonstrate that the drag crisis corresponds to a narrowing of the wake of the obstacle: the transition of the boundary layer from laminar to turbulent moves the separation lines downstream on the rear surface of the object. The critical velocity Uc for this
transition corresponds to a critical Reynolds number Rec¼
Ucd=ν (where d is a typical size of the obstacle and ν the
kinematic viscosity of the fluid) that depends on the exact shape of the body. Recis of the order of 4 × 10⁵for a sphere
or a cylinder. The critical Reynolds number depends also on the free stream turbulence[6]or on the roughness of the obstacle. A classical example is the presence of dimples at the surface of a golf ball that decrease the critical Reynolds number by a factor of ten, what explains their surprisingly long trajectories[7,8]. Drag crisis is usually described for a symmetrical object, for which no permanent lift force is measured, although strong fluctuating transverse forces have been observed [9]. Permanent lift can however be generated on such a symmetrical object if it is spinning, a possibility largely used in ball sports[7,8], or if it moves close to a wall or inside a nonclassical fluid as granular media[10]. On the other hand, strong lift and low drag are usually achieved with slender bodies, e.g. an aircraft wing, tilted to a small incidence angle. For such wings, if the incidence angle becomes too large, the lift abruptly decreases and the drag increases, a phenomenon called stall. This phenomenon can be tragic for airplanes and corresponds to the separation of the boundary layer all over the upper surface of the wing.
In the present paper we show that, for a relatively streamlined but thick body, such as a highly curved plate, a sharp transition in the lift can be observed at a constant low incident angle when the flow rate is increased. High-camber aerofoil sections are commonly used at high incidence when the lift as well as the drag must be large, e.g. for a landing aircraft or for downwind yacht sails[11,12]. The lift jump that we observe here when varying the flow velocity and henceforth called a lift crisis, is associated with a transition in the upper surface boundary layer which allows the flow to remain attached on the convex wall further downstream, similarly to what is observed in a bluff body drag crisis. At the same critical Reynolds number the drag is found to drop. A sharp increase of the lift with the Reynolds number for thick profiles at zero incidence has already been reported in the past[13], but its origin and similarity to the drag crisis seems to have been largely unnoticed. Note that the term lift crisis was previously used for a symmetrical obstacle in another meaning: to refer to the modification in the amplitude of the instantaneous lift fluctuations [9,14–16]. Here the expression lift crisis is used to refer to the abrupt jump of the time-averaged lift.
Experiments were carried out in the IRENav hydrody-namic tunnel to measure the forces and the velocity fields on a two-dimensional high-camber plate. The plate is a 3-mm-thick, 50-mm-radius stainless steel circular arc section with a chord length c ¼ 74 mm and a camber t ¼ 16.6 mm, resulting in a relative camber t=c ¼ 22.3% located at mid-chord (Fig.1). The test section is 192 × 192 mm2and 1 m
long, located downstream of honeycombs and a 1=9 contraction convergent. The measured turbulence intensity is 1.8%. The incidence angle is set to zero for all the results presented here. The obstacle fills almost all the channel width, except for a small gap on each end to avoid contacts with the walls that would alter force measurements. The upstream water flow velocity U∞ in the tunnel can be
adjusted between 1.4 and 8.13 m=s, resulting in a Reynolds number range Re ¼ U∞c=ν∈ ½105; 6 105#. As usual in
aeronautics, the Reynolds number is built on the chord length c and not on the thickness t. The plate is connected to a force balance based on strain gauges allowing us to measure the drag and lift forces with a resolution better than 0.5 and 1.7 N respectively, thus of the order of 20% at low Reynolds numbers and 1% at high Reynolds numbers. Forces are recorded at 1 kHz and time averaged during 30 sec. More details on the hydrodynamic tunnel and hydrodynamic balance can be found in Ref. [17]. Transverse L and longitudinal D components of the hydrodynamic force are made dimensionless by the relations
CL¼ L 1=2ρU2∞A; ð1aÞ CD¼ D 1=2ρU2 ∞A; ð1bÞ
where, according to the aeronautics convention, A is the surface of the plate projected on the horizontal plane (chord length multiplied by the span) and ρ is the water density.
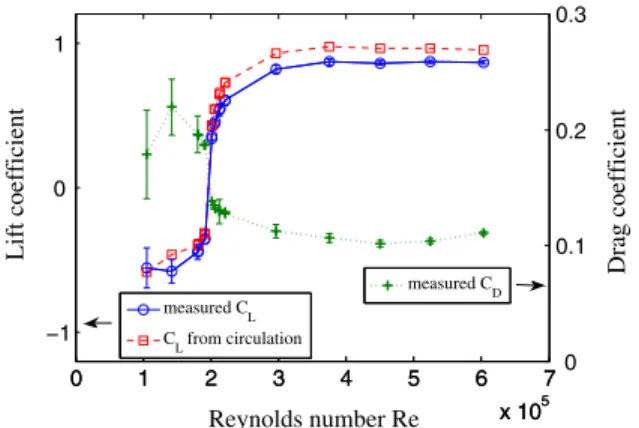
Figure2presents the increase of the lift coefficient CLwith
Reynolds number, measured by the force balance. This curve displays an abrupt transition for Rec ¼ ð2.00 & 0.04Þ × 105,
from negative (downward) to positive (upward) lift, with no visible hysteresis when increasing or decreasing the flow rate. Figure2also shows that the drag coefficient CDdrops at
the same critical Reynolds number. Thus the curved plate simultaneously experiences a drag and a lift crisis, and the lift-to-drag ratio CL=CDjumps from−3 up to þ8.5. Note that
the value CD≃ 0.2 measured below the critical Reynolds
number corresponds to a drag coefficient Cxdefined with the
projected area normal to the flow (thickness multiplied by span) close to 1, as is common for a bluff body with massive flow separation and a wake almost as wide as the object.
The lift crisis transition does not look like a proper bifurcation, or it would be a rather imperfect bifurcation, as no cusp with a slope discontinuity is observed. Moreover, we must remember that these data are time averaged and significant temporal fluctuations exist on the lift and drag
forces. Contrary to what was sometimes reported for the drag crisis or stall[18], here we do not observe measurable hysteresis when increasing or decreasing the fluid velocity. To characterize the sharp transition, the abruptness of the lift jump around the inflexion point may be described by the power-law scaling jCL− CL0j ∼ ðjRe − Recj=RecÞγ, as
shown on Fig.3. The same exponent γ≃ 0.2 fits the data below and above the transition, and its value suggests that the slope dCL=dRe becomes very large in Rec.
In order to better characterize the lift crisis we performed velocity field measurements around the obstacle using 2D particle image velocimetry (PIV). The flow is illuminated from above with a laser sheet normal to the spanwise direction and located at mid span (z ¼ 0). Two mirrors are placed below the tunnel test section to illuminate the other side of the plate, which allows the whole velocity field around the obstacle to be measured. The water flow is
191.5 192 192 U 74.5 16.6 3 y x o
FIG. 1. Curved plate section: chord length c ¼ 74.5 mm and camber t ¼ 16.6 mm (top) and tunnel test setup (bottom). All dimensions are in mm. 0 1 2 3 4 5 6 7 x 10⁵ −1 0 1 Lift coefficient Reynolds number Re 0 1 2 3 4 5 6 7 x 10⁵ 0.1 0 0.2 Drag coefficient measured CL CLfrom circulation measured CD 0.3
FIG. 2. Lift coefficient CL (scale on the left axis) versus
Reynolds number, measured directly with the force balance (circle) or from the PIV fields (square). The drag coefficient
CD (scale on the right axis) measured with the force balance
(plus) is plotted on the same graph.
10−3 10−2 10−1 100 10−1 100 |Re−Rec|/Rec |C L − C L0 |
measured points Re<Rec measured points Re>Rec 0.8 (|Re−Rec|/Rec)0.2
FIG. 3. Power law of the lift jump below (diamond) and above
(plus) Rec. The dashed line is a power law fit with Rec¼ 200100,
seeded with μm sized polyamide particles and visualized by a 4k-pixel CCD camera at a sampling frequency of 10 Hz in double frame. For each value of the flow velocity, 300 image pairs are recorded and processed in order to determine the time-averaged velocity field Uðx; yÞ. More details on the PIV measurement system and processing can be found in Refs. [17,19].
Figures4(a)and4(b)present PIV time-averaged veloc-ities in the vicinity of the obstacle. Figure4(a)is typical of the subcritical flow (Re < Rec) whereas Fig.4(b)is typical
of the supercritical flow (Re > Rec). At moderate Reynolds
number the flow on the upper surface is massively separated with a separation point located close to the top of the camber, around x=c≃ 0.57 [Fig.4(a)]. The resulting wide low-velocity area behind the obstacle corresponds to a periodic emission of alternate vortices, as confirmed by visualizations of the instantaneous velocity fields. The highest mean velocities are measured below the plate, resulting, according to Bernoulli’s equation, in low pressure and therefore in a downward lift force (CL< 0). This point
is confirmed by the fact that the wake is slightly oriented upward. For larger Reynolds numbers [Fig.4(b)] the flow on the upper surface remains attached along the convex surface much farther downstream. The separation point moves almost to the trailing edge (x=c≃ 0.95) resulting in a much smaller low-velocity area downstream of the obstacle and to a very narrow wake slightly oriented downward [Fig. 4(d)]. The largest velocities are now located above the obstacle, where low pressures induce a strong upward lift (CL> 0).
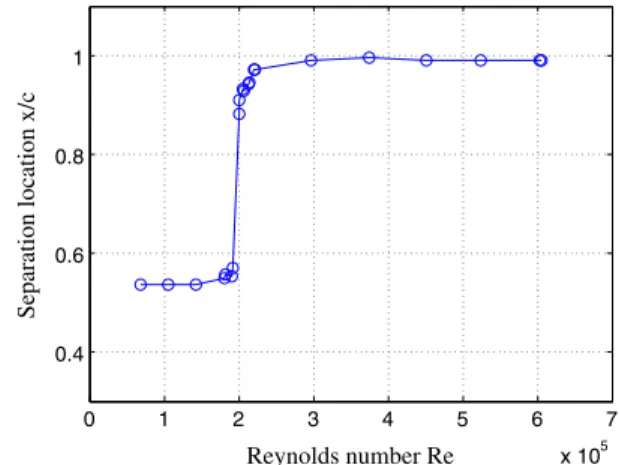
These pictures qualitatively confirm the existence of the lift crisis. The flow changes from the one past a bluff body with massive separation (high drag) in the subcritical regime to the flow around a more streamlined lift-generating obstacle (high lift and smaller drag) in the supercritical regime. Indeed, as shown on Fig. 5, the separation point location on the upper surface detected in the velocity fields shows a sharp jump at the critical Reynolds number.
For a 2D potential flow the lift on an obstacle can be computed from the shape of the streamlines. In particular
U/U 0 0.5 1 1.5 0 0.5 1 1.5 −0.5 0 0.5
x/c
y/c
0 0.5 1 −0.5 0 0.5 Ux/U x/c=1.2 x/c=1.5y/c
U/U 0 0.5 1 1.5 0 0.5 1 1.5 −0.5 0 0.5x/c
y/c
0 0.5 1 −0.5 0 0.5 Ux/Uy/c
x/c=1.2 x/c=1.5FIG. 4. Mean PIV velocity field (a),(b) and streamwise velocity profile UxðyÞ in the wake (c),(d) below and above the critical Reynolds
number: (a),(c) Re ¼ 1.91 105 and negative lift, and (b),(d) Re ¼ 2.05 105 and positive lift. Color code in (a),(b) represents the
one can replace the area inside any closed streamlines by an equivalent Rankine solid[20]. Here the closed area can be defined in Figs.4(a)and4(b)as the dark blue area where U=U∞≤ 0.4. This zone drastically changes shape from a large ellipse with a small negative incidence below the critical Reynolds number, to a flat-bottom thick wing at zero incidence above Rec. Furthermore, we can also infer
the lift experienced by the obstacle directly from the PIV velocity field, computing the velocity circulationΓ along a path C around the obstacle:
Γ ¼ I
CU · dl: ð2Þ
Indeed the Kutta-Joukowski theorem states that for a 2D potential flow, the lift coefficient is proportional to the circulation [21]:
CL ¼ −
2Γ
U∞c: ð3Þ
The lift coefficient deduced from the integration of PIV fields along a large rectangle around the obstacle (x=c∈ ½−0.4; 1.56#; y=c ∈ ½−0.78; 1#) are plotted in Fig.2. The results agree within 10% with the lift measured with the force balance and in particular exhibit the same abrupt lift jump at Rec. The good agreement of the 2D lift derived
from the velocity in the mid-span plane with the global lift measured by the balance confirms that the mean flow is reasonably 2D. We also checked that, while enlarging the integration contour C in the PIV plane, the circulation and thus the 2D lift remains almost constant (variations are smaller than 1%). Concerning the drag crisis, it can be related to the reduction of the wake thickness, as can be seen in the velocity profiles in the wake of the obstacle plotted in Figs.4(c)and4(d). The velocity deficit is deeper and larger at low Reynolds numbers. In principle the drag can be derived from the momentum deficit in the wake and from pressure losses [22,23]; however, here direct force measurements were more accurate.
With this experiment we show that the well-known drag crisis of bluff bodies can be associated with an abrupt jump of the lift for nonsymmetrical objects. The lift crisis highlighted here for a curved plate is a general phenomenon for nonsymmetrical objects. In particular, we tested asymmetric bodies with different sections: a solid body with the same upper surface than the curved plate presented above but with a flat bottom (called circular-back section), and a solid half-cylinder. The lift crisis is also observed on both bodies simultaneously to the drag crisis, with a critical Reynolds number Rec ¼ 2.5 × 10⁵and a transition exponent γ≃ 0.5
on the circular-back section, while Rec¼ 3.0 × 10⁵ and
γ≃ 0.2 on the half-cylinder section (see Supplemental Material[24]). Evidently, the lift crisis cannot be separated from the drag crisis: both are governed by the abrupt change in the boundary layer separation. The lift crisis described here can also be related to asymmetric transitions in the boundary layers of spheres: e.g. for rotating balls, an inverse Magnus effect corresponding to an inversion of the lift has been observed close to the drag crisis[25–27]. Furthermore, for nonrotating balls with a localized asymmetric roughness, the change in the deflection force seems to be at the origin of knuckleballs[28–30]. Similarly, the existence of the lift jump at the drag crisis threshold seems to be an important phenomenon to consider to analyze the galloping instability of anisotropic cables[31].
In conclusion, as far as we know, such a sharp jump and inversion of lift with the Reynolds number at constant angle of incidence and the analogy to the drag crisis of bluff bodies has not been described, probably because classical bluff bodies are spheres or cylinders with no asymmetry, while lifting wings are slender bodies with no clear drag crisis at low incidence. This abrupt generation or inversion of the transverse force above a critical flow velocity could be used for practical applications such as a velocity threshold detector, or the passive stability control of an unmanned flying vehicle[32].
This work was supported by GIP Ecole Navale. We acknowledge the technical staff of IRENav and Jean-Baptiste Marchand for their help in the experimental work. Olivier Cadot, Jean-Pierre Hulin, Frédéric Moisy, Peter Richards, Stuart Norris, Richard Flay, and Ignazio Viola are also acknowledged for fruitful discussions, as well as one of the referees for pointing us the pioneering work of G. Eiffel.
*Corresponding author.
patrick.bot@ecole‑navale.fr
[1] G. Eiffel, Sur la résistance des sphères dans l’air en mouvement, C.R. Acad. Sci. 155, 1597 (1912).
[2] N. K. Delany and N. E. Sorensen, Low-speed drag of cylinders of various shapes, Nat. Adv. Comm. Aero., Wash. Tech. Note 3038, (1953). 0 1 2 3 4 5 6 7 x 10⁵ 0.4 0.6 0.8 1 Reynolds number Re Separation location x/c
FIG. 5. Separation point location on the upper surface versus the Reynolds number.
[3] L. D. Landau and E. M. Lifchitz, Fluid Mechanics (Pergamon, New York, 1963).
[4] M. M. Zdravkovich, Flow around Circular Cylinders, Fun-damentals (Oxford University Press, Oxford, 1997), Vol. 1. [5] M. Van Dyke, An Album of Fluid Motion (The Parabolic
Press, Standford, California, 1982).
[6] K. Son, J. Choi, W-P. Jeon, and H. Choi, Effect of
free-stream turbulence on the flow over a sphere,Phys. Fluids
22, 045101 (2010).
[7] R. D. Mehta, Aerodynamics of sports balls, Annu. Rev.
Fluid Mech. 17, 151 (1985).
[8] K. Aoki, K. Muto, and H. Okanaga, Aerodynamic
character-istics and flow pattern of a golf ball with rotation,Procedia
Eng. 2, 2431 (2010).
[9] C. Norberg, Flow around a circular cylinder: Aspects of
fluctuating lift,J. Fluids Struct. 15, 459 (2001).
[10] Y. Ding, N. Gravish, and D. I. Goldman, Drag-Induced Lift
in Granular Media,Phys. Rev. Lett. 106, 028001 (2011).
[11] I. M. Viola, Downwind sail aerodynamics: A CFD
inves-tigation with high grid resolution,Ocean Eng. 36, 974 (2009).
[12] P. Bot, I. M. Viola, R. G. J. Flay, and J-S. Brett, Wind-tunnel pressure measurements on model-scale rigid downwind
sails,Ocean Eng. 90, 84 (2014).
[13] D. H. Williams, A. F. Brown, and C. J. W. Miles, Tests on Four Circular-back Aerofoils in the Compressed Air Tunnel (His Majesty's Stationery Office, London, 1948).
[14] C. Norberg, Fluctuating lift on a circular cylinder: Review
and new measurements,J. Fluids Struct. 17, 57 (2003).
[15] S. P. Singh and S. Mittal, Flow past a cylinder: Shear layer
instability and drag crisis,Int. J. Numer. Methods Fluids 47,
75 (2005).
[16] O. Cadot, A. Desai, S. Mittal, S. Saxena, and B. Chandra, Statistics and dynamics of the boundary layer reattachments
during the drag crisis transitions of a circular cylinder,Phys.
Fluids 27, 014101 (2015).
[17] J.-B. Marchand, Ph.D. thesis, ENSAM Paris, (2014). [18] G. Schewe, Reynolds-number effects in flow around
more-or-less bluff bodies,J. Wind Eng. Ind. Aerodyn. 89, 1267
(2001).
[19] F. Moisy, Pivmat toolbox for Matlab, http://www.fast
.u‑psud.fr/pivmat.
[20] E. Guyon, J.-P. Hulin, L. Petit, and C. D. Mitescu, Physical Hydrodynamics (Oxford University Press, Oxford, 2015).
[21] I. L. Ryhming, Dynamique des Fluides (Presses Polytech-niques et Universitaires Romandes, 1985) ISBN 2-88074-409-1.
[22] H. Schlichtling, Boundary Layer Theory, 8th ed. (Springer, New York, 2000).
[23] B. W. van Oudheusden, F. Scarano, E. W. M. Roosenboom, E. W. F. Casimiri, and L. J. Souverein, Evaluation of integral forces and pressure fields from planar velocimetry data for
incompressible and compressible flows,Exp. Fluids 43, 153
(2007).
[24] See Supplemental Material at http://link.aps.org/
supplemental/10.1103/PhysRevLett.117.234501for lift cri-sis results for other nonsymmetrical obstacles: A half-cylinder and a circular-back airfoil.
[25] J. M. Davies, The aerodynamics of golf balls,J. Appl. Phys.
20, 821 (1949).
[26] J. W. M. Bush, The Aerodynamics of the Beautiful Game, in Sports Physics, edited by C. Clanet (Les Editions de l’Ecole Polytechnique, 2013) ISBN 978-2-7302-1615-9, pp. 171– 192.
[27] J. Kim, H. Choi, H. Park, and J. Y. Yoo, Inverse Magnus
effect on a rotating sphere: When and why,J. Fluid Mech.,
754, R2 (2014).
[28] R. G. Watts and E. Sawyer, Aerodynamics of a knuckleball,
Am. J. Phys. 43, 960 (1975).
[29] C. Clanet, Sports ballistics,Annu. Rev. Fluid Mech. 47, 455
(2015).
[30] A. M. Nathan, Analysis of knuckleball trajectories,Procedia
Eng. 34, 116 (2012).
[31] W. Y. Ma, Q. K. Liu, X. Q. Du, and Y. Y. Wei, Effect of the Reynolds number on the aerodynamic forces and galloping instability of a cylinder with semi-elliptical cross sections,
J. Wind Eng. Ind. Aerodyn. 146, 71 (2015).
[32] P. Bot, Ouest Valorisation SAS. Transducteur adapté à la génération de forces en fonction de la vitesse d’écoulement d’un fluide, French patent application fr15/01418, 2015, extended to international patent application PCT/FR2016/ 051685, 2016.