Science Arts & Métiers (SAM)
is an open access repository that collects the work of Arts et Métiers Institute of
Technology researchers and makes it freely available over the web where possible.
This is an author-deposited version published in: https://sam.ensam.eu Handle ID: .http://hdl.handle.net/10985/19855
To cite this version :
Jean-Benoit KOPP, Jérémie GIRARDOT - Dynamic fracture in a semicrystalline biobased polymer: an analysis of the fracture surface - International Journal of Fracture - Vol. 226, n°1, p.121-132 - 2020
Any correspondence concerning this service should be sent to the repository Administrator : archiveouverte@ensam.eu
https://doi.org/10.1007/s10704-020-00482-y
Dynamic fracture in a semicrystalline biobased polymer:
an analysis of the fracture surface
Jean-Benoît Kopp · Jeremie Girardot
Abstract The fracture behaviour of a semi-crystalline bio-based polymer was studied. Dynamic fracture tests on strip band specimens were carried out. Fracture surfaces were observed at different scales by optical and electron microscopy to describe cracking scenar-ios. Crack initiation, propagation and arrest zones were described. Three distinct zones are highlighted in the initiation and propagation zone: a zone with conical markings, a mist zone and a hackle zone. The conical mark zone shows a variation in the size and density of the conical marks along the propagation path. This is synonymous with local speed variation. Microcracks at the origin of the conical marks in the initiation zone seem to develop from the nucleus of the spherulites. In the propagation zone with complex roughness, the direction of the microcracks and their cracking planes are highly variable. Their propagation directions are disturbed by the heterogeneities of the material. They branch or bifurcate at the level of the spherulites. In the arrest zone, the microcracks developed upstream con-tinue to propagate in different directions. The surface created is increasingly smoother as the energy release rate decreases. It is shown that the local velocity of the crack varies in contrast to the macroscopic speed. A J.-B. Kopp (
B
)· J. GirardotArts et Metiers Institute of Technology, Université de Bordeaux, CNRS, INRA, INP, I2M, HESAM Université, Esplanade des Arts et Métiers, 33400 Talence, France e-mail: jean-benoit.kopp@ensam.eu
J. Girardot
e-mail: Jeremie.girardot@ensam.eu
specific setup allowing to estimate the minimum frac-ture energy of the material in order to maintain the rapid propagation of the crack is proposed for materials with antagonistic behaviour: ductile at initiation and brittle in propagation.
Keywords Dynamic fracture· Rapid crack propaga-tion· Fracture surface analysis · Semi-crystalline · Polymer
1 Introduction
There are numerous studies in the literature on the frac-ture behaviour of materials and strucfrac-tures (Beguelin et al. 1997, 1998; Yoffe 1951; Broberg 1960; Fre-und 1972;Cros et al. 2000;Irwin et al. 1979;Sheng and Zhao 2000; Rosakis and Zehnder 1985; Pon-son and Bonamy 2010; Fineberg and Bouchbinder 2015; Lebihain et al. 2020; Le Barbenchon et al. 2020;Ravi-Chandar 1998;Sharon and Fineberg 1999). Approaches in the analysis of the mechanism vary widely depending on the point of view. Experimenters tend to replicate the mechanism more or less rigor-ously in the laboratory (Fond and Schirrer 2001;Kopp et al. 2018;Ravi-Chandar and Knauss 1984a;Kolvin et al. 2017). They describe it with ever more sophis-ticated tools and sometimes different interests. Some are interested in crack initiation (Bisoffi-Sauve et al. 2019;Rittel and Maigre 1996), some in crack propaga-tion (Kopp et al. 2018;Fond and Schirrer 2001;Dalmas et al. 2013;Bonamy and Ravi-Chandar 2005), others in
crack arrest (Imachi et al. 2020), and a comprehensive approach is often proposed by studying the mechanism at the macroscopic scale.
As introduced inGuerra et al.(2012), when a fast crack propagation is studied, some discrepancies can be observed between theoretical LEFM-based models and real measurements. Indeed, the study of local mecha-nisms at the microscopic scale such as micro cracks, micro-branches, and conical marks is then required and has been widely described for different kind of materials in the literature: (Sharon and Fineberg 1999;
Arakawa and Takahashi 1991;Johnson and Holloway 1966; Ravi-Chandar and Knauss 1984b; Kies et al. 1950; Yang and Ravi-Chandar 1996; Ponson 2016;
Ponson et al. 2006;Fineberg et al. 1991;Kolvin et al. 2017;Cambonie et al. 2015). The numerical tools that have significantly evolved over the last few decades largely complement the experimental observations : (Bisoffi-Sauve et al. 2019;Varela Valdez et al. 2018;
Coré et al. 2018; Nishioka 1995; Imachi et al. 2020;
Zhou et al. 2005). They are very useful where experi-mental tools are limited, such as for taking into account heterogeneitiesVillette et al.(2019), dynamic effects, micro- and macro-branches (Bleyer et al. 2016), micro-cracks, or for dimensioning structures.
When a cracking mechanism is studied in the labora-tory, it is generally to describe the different mechanisms observable at different scales, to quantify the fracture parameters that will feed predictive models or to vali-date a numerical model (or method). From the micro-to the macro-scale, the description of the mechanisms is necessary although complex. This makes it possi-ble to rigorously evaluate and predict the mechanisms that may lead to the collapse of a structure. Indeed, the appearance of micro- and macro-cracks is largely correlated to the microstructure and heterogeneities of the material, the mechanical stress or even the effects of the environment (Fineberg and Bouchbinder 2015). To analyse a dynamic fracture mechanism in mode I (opening mode), the formalism of linear elastic fracture mechanics (LEFM) advises a global approach with the energy release rate G or local with the stress intensity factor K . In dynamic regime and for most materials, the size of the fracture process zone remains negligible compared to the crack length. This can be very dif-ferent for a supposedly ductile material when a crack propagates slowly. In this last case, the formalisms of fracture mechanics then suggest a local approach with the contour integral J (Rice 1964).
The fracture behaviour of polymeric materials has been extensively studied in the literature. Environmen-tal effects (temperature and strain rate for example) can significantly modify the emerging behaviour of the material (Fond and Schirrer 2001;Kopp et al. 2018). By increasing the strain rate, a polymer can change from a visco-elastic plastic ductile to a elastic brit-tle behaviour. Studying the resistance to initiation (or slow propagation) or to rapid propagation can be sig-nificantly different for the same polymer material. The formalisms of fracture mechanics also. Homalite 100 and polymethylmethacrylate (PMMA) have regularly served as model materials for studying materials with brittle linear elastic behaviour. Their fracture facies have been widely described. Different characteristic zones exist. At crack initiation, conical markings can be observed (Kies et al. 1950;Yang and Ravi-Chandar 1996;Dalmas et al. 2013). They result from the interac-tion between a macro crack front and micro crack fronts that develop downstream of the main crack. The analy-sis of these marks in terms of density and size makes it possible to estimate the crack velocity (Guerra 2009). During the rapid propagation of the crack, the fracture surface is known as a hackle zone. This zone is chaotic in terms of roughness. Micro-branches, which Sharon and Fineberg (Sharon and Fineberg 1996) describe as the origin of non-trivial roughness, develop from a crit-ical speed. Between these two zones (initiation and propagation) there is an intermediate zone, called mist. For homalite 100, it is established that in the mist zone, several small cracks propagate simultaneously and the front of the overall crack is almost straight ( Ravi-Chandar and Knauss 1984a). In the hackle zone, crack growth occurs by the same physical process as in the mist zone, except that the size scale of the microfrac-turing increases. For PMMA, it has been observed that in the hackle zone, and for cracking speeds above about 500 m/s, the fracture surface becomes very rough with periodic microbranch-induced marks (Fineberg and Marder 1999). They generate arrest marks spaced about 1 mm apart, commonly called “ribs markings” because of their geometrical shapes. The high rough-ness observed in the hackle areas is generally not taken into account in the estimation of the fracture energy. It is nevertheless admitted that the higher the energy release rate, the rougher the fracture surface is (Kopp et al. 2014b,2015, 2018;Fond and Schirrer 2001).
Rubber toughened polymers (Fond and Schirrer 2001, 1997; Kopp et al. 2014b) and semi-crystalline
(Kopp et al. 2018) are widely used for industrial applications. Their ductility is useful for absorbing energy induced by external impact. Nevertheless, under certain conditions (loading, temperature, hygrometry, etc.) they can present the critical appearance of rapid crack propagation. Quasi-static or fatigue-type loading (Raphael et al. 2019) generally induces plasticity and cavitation phenomena (Rolland et al. 2018;Castagnet et al. 2000b). On the contrary of a dynamic solicita-tion which induces brittle fractures with the appearance of micro cracks, micro- and macro-branches (Kolvin et al. 2017;Fineberg et al. 1991). For semicrystalline polymeric materials, spherulites composed mainly of crystalline phase are heterogeneities with rather brit-tle behaviour (Schultz 1984;Cotterell et al. 2007;Yu et al. 1998). The amorphous phase is quite soft and duc-tile. Under quasi-static loading it is assumed that the amorphous phase deforms plastically and therefore the material has a high ductility. Semicrystalline are rather resistant to crack initiation and are therefore suitable for industrial applications subject to external impacts such as the transport of a fluid in polymer pipes (Mason and Chen 2006;Greenshields et al. 2000;Williams and Venizelos 1999;Kopp et al. 2014a,2018).
In this work, dynamic fracture tests were performed on strip band specimens (SBS) of a bio-based semicrys-talline polymer. The material under investigation is rel-atively undescribed in the literature in terms of the fracture mechanism and especially in dynamic. More generally, the link between the specific microstructure of semi-crystalline polymers and cracking mechanisms at micro-scale is poorly referenced. The fracture sur-face were analyzed by optical and electron microscopy in different zones (initiation—propagation— arrest) in order to propose cracking scenarios related to the microstructure of semicrystalline polymer. The link between the mechanisms observed at different scales with the local and global cracking velocity and the frac-ture energy is discussed.
2 Material and methods 2.1 Material
The material studied is polyamide 11 (PA11), the Rilsan BESNO TL grade supplied by Arkema. The monomer is a castor oil derivative. It is therefore considered as a semi-crystalline bio-based polymer. The degree of
crystallinity of the polymer is 22%. It was measured by differential scanning calorimetry. The strip band spec-imens were machined from pre-injected plates. The dynamic modulus Ed was obtained by measuring the average ultrasonic velocity in the material < vu > which is equal to 2100 ± 46 m s−1. As a dynamic modulus, it can be also taken as the ‘relaxed’ modulus of the material which avoid viscous effect in the esti-mation of the internal energy (see Eq. (2)). The value Ed= 1620± 82 MPa is obtained from Eq. (1), whereν = 0.43 andρ =1040 kg m−3. For the estimation of the fracture energy in dynamic propagation regime, only Edandν will be considered to describe the behaviour of the material (Bradley et al. 1997).
Ed= ρvu2
(1 + ν)(1 − 2ν)
1− ν (1)
2.2 Dynamic fracture test
The strip band specimen (SBS) geometry (Nilsson 1972;Fond and Schirrer 2001) is used to study rapid crack propagation (RCP) and crack arrest in PA11 plates. This geometry allows precise control of the boundary conditions during propagation. It generates very few inertia effects induced by rapid crack propa-gation. An experimental device based on these studies (Fond and Schirrer 2001;Kopp et al. 2014b,2015) has been designed.
Two notched head-to-tail plates are prestressed (see Fig.1). One plate is cracked (the plate 1). The second one ensures the symmetry of the load during propaga-tion. The specimens are initially uniaxially prestressed to a constant deformation using a universal tensile-compression machine. The loading is imposed by mov-ing the crosshead. Once the prestress is reached, the displacement is maintained. The system is then locked by means of nuts mounted on 4 threaded rods. The rods pass through the jaws. The nuts stop the jaws to block the movement in the axis of the rods. The flexibility of the system is then limited. The stop of the crack is generated on the plate 1. This plate is deliberately longer than the jaw such that an unloaded zone exists. The energy release rate is almost nil and therefore very significantly lower than the fracture energy of the mate-rial. The crack is stopping at this zone and to access this arrest zone, the plate was cut with a band saw.
Fig. 1 Strip band specimen loading system
To neglect viscous effect of the material, a relaxation time of the specimen (about 15 times the pre-load time of the specimen) is considered before crack initiation. Crack initiation is then generated by the impact of a mass on a razor blade in contact with the tip of the crack. The test is carried out at ambient temperature. Six polyamide plates were cracked. The dimension of the plates is: L = 300 mm (length), H = 80 mm (height), b = 4 mm (thickness) and ln= 120 mm (notch length). The quasi-static energy release rate in mode I, noted GI 0, is defined as a function of the stressσzz(z is the direction of transverse crack propagation) by consider-ing a plane stress state and the propagation of a sconsider-ingle longitudinal crack (see Eq.2).
GI 0=
Hσzz2(1 − ν2)
2E (2)
A dynamic correction must be considered to esti-mate the energy release rate in dynamic regime, noted GI D. The average crack velocity is required. A fast camera or a conductive coating (Cotterell 1968;Kopp et al. 2014b) can be used to access the spatio-temporal data of the crack tip during propagation. The latest generation of cameras have a completely satisfactory spatial and temporal resolution. The average veloc-ity of the crack tip for this polymer is approximately 400 ms−1≈ 0.6cR. This value was obtained by optical method and resistivity measurement (see Fig.3). The conductive layer is sprayed on one side of the sample prior to the experiment. The evolution of the resistance of the Rs layer is recorded during the propagation of the fracture. An approximately constant current i is imposed with a generator G and a 10 MΩ resistor in
(a)
(b)
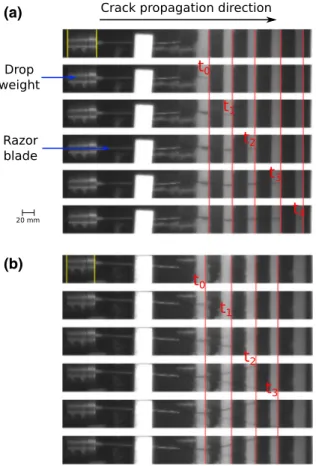
Fig. 2 Fast camera images obtained with a sampling rate of 104 frames per second to visualize the rapid propagation of cracks in a PA11 strip specimen. The time t0is chosen as the reference
point where the crack starts to propagate in dynamic regime. The time between two images is 10−4s. There is a longitudinal crack without macro branches a-(sample B3) and a main crack macro branch b-(sample B9)
Fig. 3 The position of the crack tip as a function of time is plotted and modeled by a linear regression f(x) = ˙ax. ˙aR = 400±38 m s−1and˙aC = 390±25 m s−1with˙aRand˙aCderived from resistivity and fast camera measurements, respectively
series with the sample which has a significantly lower resistance: Rs < 45 kΩ [see in (Kopp et al. 2014b)]. A National Instruments USB-6351 data acquisition is used to measure the potential difference u at a sam-pling rate of 1.25 MS s−1during fracture propagation. The resistance of the conductive layer is then calculated using Ohm’s law RS =ui. After calibration, the veloc-ity of the crack tip at the sample scale (macroscopic velocity) is known at± 38 m/s.
The Rayleigh wave velocity (cR) in PA11 is about 698 ms−1 (Kopp et al. 2018). It is known that the dynamic correction classically used for fast propaga-tion which gives the factor k= 1−c˙a
R, is unsatisfactory
in the case of a SBS (Broberg 1960) test. A numeri-cal model adapted to this specimen geometry has been implemented in (Kopp et al. 2014b) which gives a small dynamic correction of 10% which must be considered at 0.6cR. In other words, 10% of the energy is dissi-pated by the structure as inertia effects when the crack propagates at 60% of the Rayleigh wave velocity in the material in the case of SBS geometry.
Two cracking configurations are shown in Fig.2: a single crack propagation perpendicular to the load-ing axis (see Fig.2a) and a main crack propagation that branches into two secondary cracks (see Fig.2b). In dynamic regime and for this type of multiphase materials with strong heterogeneities, the energy is mainly dissipated by surface creation. An increase in the energy release rate thus induces in fine macroscopic crack branching. The energy release rate can only be estimated when a longitudinal crack propagates. In this work, only specimens with a longitudinal crack were analysed.
2.3 Fracture surface analysis
An optical microscope and a scanning electron micro-scope (SEM) are used to observe the fracture surfaces of the samples. Samples are taken from the cracked plates. They are embedded in acrylic resin and metallized in order to visualize them with the SEM. The apparatus used for metallization is a Cressington 108 auto. The gold layer is assumed to be of constant thickness on the surface of the sample. The optical microscope used is a Keyence VHX1000. The samples were then observed using a SEM (Zeiss EVOHD 15). An accelerated volt-age of 10 keV is used with a current of 200 pA.
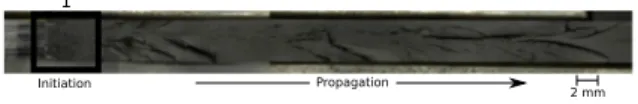
Fig. 4 Observation by light microscopy of the fracture surface of sample B3. Zone 1 represents the crack initiation zone. The arrow indicates the direction of propagation
3 Results
A fracture surface was reconstructed using several observations by light microscopy (see Fig.4). A long length of cracking in sample B3 was analysed. One can observe in Table1some information on the tests car-ried out on the specimens. Different zones can be dis-tinguished. From left to right, one can observe a zone where the razor blade has penetrated, a so-called initia-tion zone (zone 1) and a propagainitia-tion zone. These differ-ent zones as well as a crack arrest zone were analyzed to qualitatively describe the majority of the mechanisms observed on a microscopic scale.
3.1 Crack initiation
The initiation zone is complex. The macro-crack will indeed grow in this zone by coalescence of several micro-cracks. The energy brought to the system allow-ing the crack initiation is composed of the elastic energy stored in the plate and the kinetic energy generated by the impact of the mass on the razor blade. The objective of the dynamic fracture test is to establish as quickly as possible a stable state of propagation characterised by a constant energy release rate during propagation. From the point of view of crack length, this transition zone between initiation and propagation is negligible. This is the interest of a rapid propagation (i.e. dynamic frac-ture) test, to be able to free oneself from the crack initia-tion. Nevertheless, on a microscopic scale, the fracture surface reflects this abrupt transition. Several character-istic areas can be observed in Fig. 5. From left to right, we find the zone of penetration of the blade, the zone where conical marks can be observed, an intermediate zone called “mist zone” and a chaotic zone from the point of view of roughness called “hackle zone” ( John-son and Holloway 1966; Ravi-Chandar and Knauss 1982). The area of conical markings and the hackle zone are considered to be associated with crack initia-tion and propagainitia-tion, respectively. In the mist zone (see Fig.6), plastic deformation of the resin is noticeable.
Table 1 Estimation of the fracture energy GI D (kJm−2), the quasi-static energy release rate GI 0 (kJm−2) as a function of the crack velocity˙a ((ms−1)), the temperature T (◦C) and the displacementδ (mm) imposed during pre-loading
Sample δ T ˙a ˙a/cR GI 0 GI D
B3 2 19 390 0.55 10.4 9.4 B4 2 19 420 0.60 10.1 9.1 B5 2.3 20 400 0.57 12.2 11.0 B6 2.5 21 410 0.59 15.5 14.0 B7 2.5 20 380 0.54 16.2 14.6 B8 2.7 23 390 0.55 17.3 15.6 B9 2.9 21 440 0.63 NA NA
Fig. 5 Several zones can be identified (from left to right): the razor blade penetration zone—the conical mark zone—the inter-mediate “mist” zone—the chaotic “hackle” zone. The arrow indi-cates the direction of propagation
This suggests that the material was stressed “slowly” and at a high level of deformation.
The appearance of the conical markings in the initi-ation zone is well documented in the literature (Kies et al. 1950; Yang and Ravi-Chandar 1996; Dalmas et al. 2013; Ravi-Chandar and Knauss 1984b). It is established that their interaction is associated with a dynamic propagation regime. Microcracks in this type of semicrystalline material appear to develop from the nuclei of the spherulites. Spherulites are hetero-geneities (i.e. geometrical defects) which can be sites for microcrack initiation. They are often considered more brittle than the amorphous phase of the mate-rial. The size and density of the conical marks are also indicators of the local crack velocity (Guerra 2009). The higher the density and smaller the size of the con-ical mark, the faster the crack propagates. Here, it is observed an evolution in terms of density and size from
Fig. 6 Observation by electron microscopy of the mist zone of the fracture surface of sample B4. Several zones can be identified (from top to bottom): the smooth zone with the appearance of spherulites (end of the zone of conical marks)—the mist zone with plastic deformation of the resin—a stop mark of the macro-crack in dotted line—the hackle zone. The long arrow on the left indicates the direction of propagation
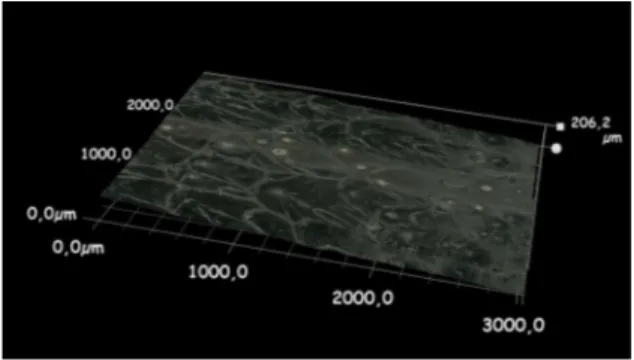
left to right in the initiation zone (see Fig.7). It sug-gests that the macro- crack velocity was increasing very briefly until reaching the mist zone state. The area of the conical marks is known to be smooth and sometimes mirror-like on a macroscopic scale. This is confirmed by the 3D reconstruction of the fracture surface con-sidered smooth in this area (see Fig.8).
The additional energy generated by the impact of a mass on a razor blade allows the transition of the crack into a rapid propagation regime where the frac-ture surface is more chaotic. At this instant, the energy release rate is higher than the critical energy release rate associated with crack propagation in dynamic regime (GI > GI Dc).
Fig. 7 Observation by electron microscopy of the conical marks of the initiation zone of the fracture surface of sample B3. The nuclei of the spherulites are identifiable. The arrow indicates the direction of propagation
Fig. 8 3D reconstruction of the fracture surface of the B3 spec-imen in the initiation zone at the conical marks using light microscopy observations. The direction of propagation is from left to right
3.2 Crack propagation
The analysis of crack propagation is relatively simple from the point of view of external loading and space-time data of the crack tip. The energy release rate is assumed to be constant over almost the entire length of the crack. The crack is in a quasi-permanent regime of rapid propagation. Analysis of the fracture surface is more complex. This makes the estimation of the frac-ture energy hazardous.
The zone of propagation of the fracture surface of sample B5 is shown in Fig.9. The main direction of the macrocrack front is indicated by the large white
Fig. 9 Observation by electron microscopy of the propagation zone of the fracture surface of sample B5. The large white arrow at the top indicates the main direction of propagation of the macrocrack front. The three small white arrows indicate the prop-agation directions of several microcracks. Characteristic river patterns in multi-phase polymers with high heterogeneity can be observed
arrow at the top of the figure. The three small white arrows indicate the propagation directions of several microcracks. Characteristic river patterns in polymer resin composites can be seen in (Barbosa et al. 2019). The description of crack propagation through a macro-front no longer seems at all relevant at this scale. Micro-cracks seem to propagate in different directions and planes. The interaction of several micro-cracks in planes at different altitudes seems to be at the origin of the river markings. Micro branches generating arrest marks are visible. This can be interpreted as a local stick slip phenomenon (see Fig.10). This observation probably indicates that the microscopic speed of the crack is not constant as opposed to the macroscopic speed (see Fig.3).
3.3 Estimation of the fracture energy
The fracture energy was estimated for 6 specimens (see Table1). For a macroscopic velocity of the order of 0.6cR, the fracture energy is not unique and varies from 9.4 to 15.6 kJm−2. This can be explained by not taking into account the amount of surface area created by the crack in the fracture energy estimate. Only the amount of projected surface area (crack length multiplied by the
Fig. 10 Observation by electron microscopy of the microcracks in the propagation zone of the fracture surface of sample B5. The arrow indicates the direction of propagation of the microcrack front. Several parabolic arrest marks of the micro-crack can be observed. The dashed line indicates the boundary between two crack planes at two different altitudes
thickness of the specimen) is considered. For sample B9, the fracture energy was not estimated because the main crack has branched.
3.4 Crack arrest
Figure11shows a crack arrest. The large white arrow at the top indicates the main direction of propagation of the macrocrack front. The five small black arrows indi-cate the propagation directions of several micro-cracks. The dashed line indicates the area of crack arrest. To the right of the specimen, there is an area where the material has been plastically deformed due to the self-heating induced by the cutting of the specimen. The micro-cracks described in the previous section continue to propagate in different directions. However, they are less and less numerous as they approach the arrest zone. The surface is smoother than during propagation. Neverthe-less, cracking planes are still present at different alti-tudes. Crack arrest is abrupt. The macrocrack front is no longer parabolic. Conventional rib marking known for PMMA cannot be identified. Very locally one finds conical marks (see Fig.12) and spherulites as in the initiation zone. The energy release rate is no longer sufficient to bypass the spherulites. The crack comes to die in the heart of the spherulites without generating micro branches. The evidence of these marks suggests
Fig. 11 Observation by electron microscopy of the arrest zone of a crack on the fracture surface of sample B7. The large white arrow at the top indicates the main direction of propagation of the macrocrack front. The five small black arrows indicate the direc-tions of propagation of several micro-cracks. The dashed line indicates the arrest zone of the crack. To the right of the speci-men is an area where the material has been plastically deformed as a result of cutting the specimen
Fig. 12 Observation by electron microscopy of the arrest zone of a crack on the fracture surface of sample B7. Conical markings can be observed. The continuous black line indicates the arrest mark of the macro-crack
that the local velocity is decreasing and is lower than the critical speed of micro-branching.
4 Discussion
The initiation areas of the fracture surfaces were ana-lyzed. They confirm three distinct zones: a zone with conical markings, an intermediate zone (mist) and a chaotic zone (hackle). During the static pre-stressing
of the sample, micro-cracks seem to develop from the nuclei of the spherulites. This (crystalline) phase of the material is assumed to be brittle. In contrast to the amorphous phase which brings ductility to the material when it is stressed relatively “slowly”. These micro-cracks coalesce and interfere with a macro-front to generate conical marks which have been observed. The appearance of these micro-cracks, often associ-ated with cavities, is described in the literature (Selles et al. 2017;Poulet et al. 2016). The amorphous intra-spherolitic phase cavitates (or micro-crack) ( Castag-net et al. 2000a). When the density of micro-cracks is critical, a macro-crack is created (Zhurkov and Kuk-senko 1875;Zhurkov et al. 1972). This crack of a few mm ends up stopping in the mist zone, where plas-tic deformation of the matrix is found. The ductil-ity of the amorphous phase eventually takes over the brittle (crystalline) phase of the material. This can be explained by the (quasi-static) strain rate and the degree of crystallinity (about 20%). At this moment the energy release rate is lower than the critical energy release rate allowing crack initiation (GI < GI c). The external impact on the razor blade will provide the energy (and instability) necessary to initiate the crack in a dynamic propagation regime. This is evidenced by the observa-tion of a chaotic zone in the surface roughness. The local strain rate induced by the rapid crack propagation probably causes a significant drop in the ductility of the amorphous phase. The amorphous and crystalline phases are then brittle. The energy release rate is this time higher than the critical energy release rate allow-ing the rapid propagation of the crack (GI > GI Dc).
The difference in behaviour between crack initi-ation and rapid crack propaginiti-ation for this type of material is considerable. Initiating a crack requires an energy release rate that is often very high com-pared to that which the material would require to sus-tain rapid crack propagation. This is due to a signifi-cant difference between the resistance to slow propa-gation (initiation) and rapid propapropa-gation of the mate-rial: GI c > GI Dc. These significant differences have been reported for other industrial materials (Fond and Schirrer 2001). In the area of rapid propagation, the propagation velocity of the macrocrack front is rela-tively constant (˙a ≈0.6cR). This critical velocity is a priori the limit at which the crack branches due to iner-tia effects (Yoffe 1951). The specimens studied show a longitudinal crack. Analysis of the fracture surface reveals a complex roughness. Numerous micro-cracks,
micro-branches and arrest marks are observed. They appear in different crack planes. A single macro-crack front seems to be no longer identifiable. The mate-rial seeks to dissipate a significant amount of energy (GI >> GI Dc) by cracking mostly in the amorphous phase. Spherulites, i.e. the crystalline phase, are hetero-geneities that disturb the local stress field of the crack tips. This induces branches and micro-cracking phenomena in different planes in large num-bers. This allows the material (i.e. the individual cracks) to dissipate in fine a large amount of energy. One could postulate that the material dissipates as much or more energy with a single crack with many micro-cracks and micro-branches than with macro-branches. This is probably why a longitudinal macro-crack could be generated in several samples despite GI >> GI Dc.
The fact that GI >> GI Dcduring fast propagation induces a maximum macroscopic speed (0.6cR) and a high roughness. The estimation of the fracture energy is thus complex. GI Dis not unique at 0.6cR(see Table1). This estimation is made by applying the LEFM formal-ism. The quantity of projected surface area (the thick-ness times the crack length) is considered. With the observation of the fracture surface, it turns out that this consideration is erroneous. It would also appear that the local crack velocity is less than 0.6cR but proba-bly higher than the critical micro-branching velocity. A fine estimate of the amount of surface area created by the crack improves the estimate of GI D(Kopp et al. 2014b). However, it is difficult to access the amount of sub-surface area created by the micro-branches.
A relevant avenue of study would be to limit the energy release rate during rapid propagation. For a large number of industrial polymer materials, there is a sig-nificant difference between resistance to crack initi-ation and resistance to rapid crack propaginiti-ation. It is sufficient to note the numerous studies on the influ-ence of the strain rate on the behaviour of the mate-rial. For many semi-crystalline materials, an increase in the strain rate leads to a drop in ductility. For these materials, the study of cracking mechanisms is com-plex. They must be dissociated: initiation-propagation-arrest. When the energy release rate is limited (in the crack arrest zones), the surfaces observed on a macro-scopic scale are smooth and the cracking speeds seem to vary (conical marks). A suitable fracture test set-up is suggested. Two minimum loading levels would be required along the crack length. One level where the energy release rate is higher than the crack
initi-ation resistance (GI > GI c). Another loading level where the energy release rate is close to the mini-mum fracture energy allowing dynamic material frac-ture (GI ≈ GI Dc). This would make it possible to limit the micro-branching mechanisms which generate complex roughnesses difficult to measure and to appre-hend by the formalism of the LEFM. With a variable zone loading in terms of energy release rate, materials with antagonistic fracture behaviour (ductile-fragile) that depend significantly on the strain rate could be rigorously studied. The surfaces created by the crack would be smooth. The velocity of the macro-crack would vary. The micro-cracking and macro-cracking mechanisms would be limited. It would therefore be possible to give a fine analysis of the fracture behaviour (initiation-propagation-arrest) for many materials as is the case for one of the most studied brittle materials, PMMA.
5 Conclusions
The work described in this article focuses on the qual-itative analysis of fracture surface. The cracks were generated by a dynamic fracture test. Strip band spec-imens known to generate very few inertia effects were used. The material studied is a semi-crystalline indus-trial biobased polymer: PA11. Its complex fracture behaviour ultimately resembles that of a large num-ber of polymers used in industry. There is a signif-icant difference in fracture behaviour between initi-ation and rapid propaginiti-ation. This was evidenced by the analysis of the fracture surfaces. The mechanisms observed in the initiation and propagation zones are relatively well known. The influence of the highly het-erogeneous microstructure of a semi-crystalline and the cracking regime induces a signature different from those described for the well-known homalite 100 and PMMA. The random organization of spherulites in the material confers relatively singular small-scale frac-ture mechanisms. The estimation of relevant mate-rial parameters is therefore complicated. Neverthe-less, these parameters are indispensable in the develop-ment of predictive behaviour models used to dimension structures with respect to cracking mechanisms. A new set-up is suggested as a perspective to this work to fur-ther study the resistance to rapid crack propagation of this kind of material.
Acknowledgements The authors would like to warmly thank the participation in this work of V. Honno and A. Bradu who did a Bachelor internship on the subject and J. Bega for his technical support on microscopic analyses.
Compliance with ethical standards
Conflicts of interest The authors declare that there are no con-flicts of interest regarding the publication of this paper.
References
Arakawa K, Takahashi K (1991) Relationships between fracture parameters and fracture surface roughness of brittle poly-mers. Int J Fract 48(2):103–114
Barbosa L, Bortoluzzi D, Ancelotti JAC (2019) Analysis of frac-ture toughness in mode ii and fractographic study of com-posites based on elium® 150 thermoplastic matrix. Compos Part B Eng 175:107082
Beguelin P, Fond C, Kausch HH (1997) The influence of inertial effects on the fracture of rapidly loaded compact tension specimens. Part a: loading and fracture initiation. J de Phys IV 7(C3):867–872
Beguelin P, Fond C, Kausch HH (1998) The influence of inertial effects on the fracture of rapidly loaded compact tension specimens. Part a: loading and fracture initiation. Int J Fract 89(1):85–102
Bisoffi-Sauve M, Morel S, Dubois F (2019) Modelling mixed mode fracture of mortar joints in masonry buildings. Eng Struct 182:316–330
Bleyer J, Roux-Langlois C, Molinari JF (2016) Dynamic crack propagation with a variational phase-field model: limiting speed, crack branching and velocity-toughening mecha-nisms. Int J Fract 204(1):79–100.https://doi.org/10.1007/ s10704-016-0163-1
Bonamy D, Ravi-Chandar K (2005) Dynamic crack response to a localized shear pulse perturbation in brittle amorphous materials: on crack surface roughening. Int J Fract 134(1):1– 22
Bradley W, Cantwell W, Kausch H (1997) Viscoelastic creep crack growth: a review of fracture mechanical analyses. Mech Time Depend Mater 1(3):241–268
Broberg KB (1960) The propagation of a brittle crack. Arkiv for Fysik 18:159
Cambonie T, Bares J, Hattali M, Bonamy D, Lazarus V, Auradou H (2015) Effect of the porosity on the fracture surface rough-ness of sintered materials: From anisotropic to isotropic self-affine scaling. Phys Rev E Stat Nonlinear Soft Matter Phys 91(1):012406
Castagnet S, Gacougnolle JL, Dang P (2000a) Correla-tion between macroscopical viscoelastic behaviour and micromechanisms in strained α polyvinylidene fluoride (pvdf). Mater Sci Eng A 276(1):152–159
Castagnet S, Girault S, Gacougnolle J, Dang P (2000b) Cavitation in strained polyvinylidene fluoride: mechanical and x-ray experimental studies. Polymer 41(20):7523–7530 Coré A, Kopp JB, Girardot J, Viot P (2018) Dynamic energy
release rate evaluation of rapid crack propagation in discrete element analysis. Int J Fract 214(1):17–28
Cotterell B (1968) Fracture propagation in organic glasses. Int J Fract Mech 4(3):209–217
Cotterell B, Chia J, Hbaieb K (2007) Fracture mechanisms and fracture toughness in semicrystalline polymer nanocompos-ites. Eng Fract Mech 74(7):1054–1078
Cros PE, Rota L, Cottenot CE, Schirrer R, Fond C (2000) Exper-imental and numerical analysis of the impact behaviour of polycarbonate and polyurethane multilayer. J de Phys IV 10(Pr9):671–675
Dalmas D, Guerra C, Scheibert J, Bonamy D (2013) Damage mechanisms in the dynamic fracture of nominally brittle polymers. Int J Fract 184(1–2):93–111
Fineberg J, Bouchbinder E (2015) Recent developments in dynamic fracture: some perspectives. Int J Fract 196(1– 2):33–57
Fineberg J, Marder M (1999) Instability in dynamic fracture. Phys Rep 313(1):1–108
Fineberg J, Gross S, Marder M, Swinney H (1991) Instability in dynamic fracture. Phys Rev Lett 67(4):457–460
Fond C, Schirrer R (1997) Influence of crack speed on frac-ture energy in amorphous and rubber toughened amorphous polymers. Plast Rubber Compos Macromol Eng 30:116– 124
Fond C, Schirrer R (2001) Dynamic fracture surface energy and branching instabilities during rapid crack propaga-tion in rubber toughened pmma. Notes au CRAS Ser IIb 329(3):195–200
Freund LB (1972) Crack propagation in an elastic solid subjected to general loading-i. Constant rate of extension. J Mech Phys Solids 20:129–140
Greenshields C, Venizelos G, Ivankovic A (2000) A fluid-structure model for fast brittle fracture in plastic pipes. J Fluids Struct 14(2):221–234
Guerra C, Scheibert J, Bonamy D, Dalmas D (2012) Understand-ing fast macroscale fracture from microcrack post mortem patterns. Proc Natl Acad Sci 109(2):390–394
Guerra Amaro CM (2009) Dynamic fracture in brittle amorphous materials : Dissipation mechanisms and dynamically-induced microcracking in PMMA. Theses, Ecole Polytechnique X,https://pastel.archives-ouvertes.fr/ pastel-00006135
Imachi M, Tanaka S, Ozdemir M, Bui T, Oterkus S, Oterkus E (2020) Dynamic crack arrest analysis by ordinary state-based peridynamics. Int J Fract 221(2):155–169
Irwin G, Dally J, Kobayashi T, Fourney W, Etheridge M, Ross-manith H (1979) On the determination of˙a − k relationship for birefringent polymers. Exp Mech 19:121–128 Johnson J, Holloway D (1966) On the shape and size of
the fracture zones on glass fracture surfaces. Philos Mag 14(130):731–743
Kies J, Sullivan A, Irwin G (1950) Interpretation of fracture mark-ings. J Appl Phys 21(7):716–720
Kolvin I, Fineberg J, Adda-Bedia M (2017) Nonlinear focusing in dynamic crack fronts and the microbranching transition. Phys Rev Lett 119(21):215505
Kopp JB, Lin J, Schmittbuhl J, Fond C (2014a) Longitudinal dynamic fracture of polymer pipes. Eur J Environ Civil Eng 18(10):1097–1105
Kopp JB, Schmittbuhl J, Noel O, Lin J, Fond C (2014b) Fluc-tuations of the dynamic fracture energy values related to
the amount of created fracture surface. Eng Fract Mech 126:178–189
Kopp JB, Schmittbuhl J, Noel O, Fond C (2015) A self-affine geo-metrical model of dynamic rt-pmma fractures: implications for fracture energy measurements. Int J Fract 193(2):141– 152
Kopp JB, Fond C, Hochstetter G (2018) Rapid crack propagation in pa11: an application to pipe structure. Eng Fract Mech 202:445–457
Le Barbenchon L, Kopp JB, Girardot J, Viot P (2020) Reinforce-ment of cellular materials with short fibres: application to a bio-based cork multi-scale foam. Mech Mater 142:103271 Lebihain M, Leblond JB, Ponson L (2020) Effective toughness of periodic heterogeneous materials: the effect of out-of-plane excursions of cracks. J Mech Phys Solids 137:103876 Mason J, Chen J (2006) Establishing the correlation between s4
and full scale rapid crack propagation testing for polyamide-11 (pa-polyamide-11) pipe. Plastic pipes XIII
Nilsson F (1972) Dynamic stress-intensity factors for finite strip problems. Int J Fract 8:403–411
Nishioka T (1995) Recent developments in computational dynamic fracture mechanics. Dyn Fract Mech 1995:1–60 Ponson L (2016) Statistical aspects in crack growth phenomena:
how the fluctuations reveal the failure mechanisms. Int J Fract 201(1):11–27
Ponson L, Bonamy D (2010) Crack propagation in brittle hetero-geneous solids: material disorder and crack dynamics. Int J Fract 162(1–2):21–31
Ponson L, Bonamy D, Bouchaud E (2006) Two-dimensional scaling properties of experimental fracture surfaces. Phys Rev Lett 96(3):035506
Poulet PA, Hochstetter G, King A, Proudhon H, Joannès S, Laiarinandrasana L (2016) Observations by in-situ x-ray z of the microstructural evolution of semi-crystalline polyamide 11 during deformation. Polym Test 56:245–260 Raphael I, Saintier N, Robert G, Béga J, Laiarinandrasana L (2019) On the role of the spherulitic microstructure in fatigue damage of pure polymer and glass-fiber reinforced semi-crystalline polyamide 6.6. Int J Fatigue 126:44–54 Ravi-Chandar K (1998) Dynamic fracture of nominally brittle
materials. Int J Fract 90(1–2):83–102
Ravi-Chandar K, Knauss W (1982) Dynamic crack-tip stresses under stress wave loading—a comparison of theory and experiment. Int J Fract 20(3):209–222
Ravi-Chandar K, Knauss W (1984a) An experimental investiga-tion into dynamic fracture: Ii. Microstructural aspects. Int J Fract 26(1):65–80
Ravi-Chandar K, Knauss W (1984b) An experimental investiga-tion into dynamic fracture: Iii. On steady-state crack prop-agation and crack branching. Int J Fract 26(2):141–154 Rice J (1964) A path independent integral and the approximate
analysis of strain concentration by notches and cracks. J Appl Mech Trans ASME 35(2):379–388
Rittel D, Maigre H (1996) An investigation of dynamic crack initiation in pmma. Mech Mater 23(3):229–239
Rolland H, Saintier N, Raphael I, Lenoir N, King A, Robert G (2018) Fatigue damage mechanisms of short fiber rein-forced pa66 as observed by in-situ synchrotron x-ray micro-tomography. Compos Part B Eng 143:217–229
Rosakis A, Zehnder A (1985) On the dynamic fracture of struc-tural metals. Int J Fract 27:169–186
Schultz J (1984) Microstructural aspects of failure in semicrys-talline polymers. Polym Eng Sci 24(10):770–785 Selles N, Cloetens P, Proudhon H, Morgeneyer TF, Klinkova O,
Saintier N, Laiarinandrasana L (2017) Voiding mechanisms in deformed polyamide 6 observed at the nanometric scale. Macromolecules 50(11):4372–4383
Sharon E, Fineberg J (1996) Microbranching instability and the dynamic fracture of brittle materials. Phys Rev B Condens Matter Mater Phys 54(10):7128–7139
Sharon E, Fineberg J (1999) Confirming the continuum the-ory of dynamic brittle fracture for fast cracks. Nature 397(6717):333–335
Sheng J, Zhao YP (2000) Two critical crack propagating veloci-ties for pmma fracture surface. Int J Fract 98:L9–L14 Varela Valdez A, Morel S, Marache A, Hinojosa M, Riss J (2018)
Influence of fracture roughness and micro-fracturing on the mechanical response of rock joints: a discrete element approach. Int J Fract 213(2):87–105
Villette F, Baroth J, Dufour F, Bloch JF, Roscoat SRD (2019) Influence of material heterogeneities on crack propagation statistics using a fiber bundle model. Int J Fract 221(1):87– 100.https://doi.org/10.1007/s10704-019-00409-2
Williams J, Venizelos G (1999) A perturbation analysis of rapid crack propagation in pressurised pipe. Int J Fract 94(2):161– 176
Yang B, Ravi-Chandar K (1996) On the role of the process zone in dynamic fracture. J Mech Phys Solids 44(12):1955–1976 Yoffe EH (1951) The moving griffith crack. Philos Mag
42(7):739–750
Yu ZZ, Ou YC, Qi ZN, Hu GH (1998) Toughening of nylon 6 with a maleated core-shell impact modifier. J Polym Sci Part B Polym Phys 36(11):1987–1994
Zhou F, Molinari JF, Shioya T (2005) A rate-dependent cohe-sive model for simulating dynamic crack propagation in brittle materials. Eng Fract Mech 72(9):1383–1410.https:// doi.org/10.1016/j.engfracmech.2004.10.011
Zhurkov SN, Kuksenko VS (1875) The micromechanics of poly-mer fracture. Int J Fract 11:629–639
Zhurkov SN, Zakrevskyi VA, Korsukov VE, Kuksenko VS (1972) Mechanism of submicrocrack generation in stressed polymers. J Polym Sci Part A-2 Polym Phys 10(8):1509– 1520