Science Arts & Métiers (SAM)
is an open access repository that collects the work of Arts et Métiers Institute of
Technology researchers and makes it freely available over the web where possible.
This is an author-deposited version published in:
https://sam.ensam.eu
Handle ID: .
http://hdl.handle.net/10985/16576
To cite this version :
Viet Duc LE, Etienne PESSARD, Franck MOREL, François EDY - Interpretation of the fatigue
anisotropy of additively manufactured TA6V alloys via a fracture mechanics approach
-Engineering Fracture Mechanics - Vol. 214, p.410-426 - 2019
Any correspondence concerning this service should be sent to the repository
Administrator :
archiveouverte@ensam.eu
Interpretation of the fatigue anisotropy of additively manufactured
TA6V alloys via a fracture mechanics approach
Viet-Duc Le
a,⁎, Etienne Pessard
a, Franck Morel
a, François Edy
baArts et Métiers ParisTech, Campus Angers - Laboratory LAMPA - 2 Bd du Ronceray, 49035 Angers Cedex 1, France bIRT Jules Verne, Bouguenais, France
Keywords: High cycle fatigue Additive manufacturing TA6V
Porosity
Fatigue life modelling Generalized Kitagawa diagram
A B S T R A C T
This work is focused on the influence of porosity when dealing with the fatigue behaviour of TA6V alloys fabricated by the selective laser melting (SLM) process. The presence of porosity is one of the major issues facing additive manufacturing (AM) of metallic components subjected to fatigue loading. In order to study the effect of porosity on the fatigue behaviour, a vast experi-mental campaign has been undertaken. Seven specimen batches, fabricated by the SLM process with different building directions (horizontal, vertical and diagonal) were tested and a large amount of data was obtained. The link between the applied stress, the fatigue life and the pore size is highlighted by using generalized Kitagawa-Takahashi maps. It is shown that the effect of porosity on the fatigue strength is much more pronounced compared to the effect of the mi-crostructure. In the modelling section, two approaches based on fracture mechanics are con-sidered. The first one is based on the Paris law which is used to model long fatigue crack growth. The second approach was proposed by Caton et al. (2001) for modelling small fatigue crack growth. Finally, a simulation of the generalized Kitagawa-Takahashi is presented and good agreement with the experimental data is shown.
1. Introduction
During recent years, additive manufacturing (AM) technologies have continued to grow steadily due to industrial and academic developments. One of the main advantages of this technology is the capacity to fabricate complex geometries directly from a computer-aided design. Among several metal AM processes, Selective Laser Melting (SLM) is one of the most commonly used. In this process, rather than single points, a line-shaped scanning pattern is used to melt powder within a powder-bed layer thanks to the energy of the laser source. Upon completion of a single layer, a new powder-layer is deposited and subsequent melting is pursued to continue the manufacturing process to build the 3D geometry.
The TA6V (Ti6Al4V) titanium alloy is one of the most common alloys manufactured by the SLM process and has applications in many industries, in particular the aeronautic and the medical domains. The mechanical properties of TA6V alloy obtained by this process have been intensively studied in the literature[1–4]. For the monotonic tensile behaviour, it has been observed that the tensile strength of AM TA6V is equivalent or even higher than the alloys obtained by conventional processes[5–7]. However, in terms of fatigue behaviour, the AM TA6V alloy shows significantly lower fatigue strength[8]. This fact is due on one hand to the high roughness level of the as-built surface[9,10]. On the other hand, the presence of microstructural defects, especially porosity, can also largely reduce the fatigue strength[11,12].
https://doi.org/10.1016/j.engfracmech.2019.03.048 ⁎Corresponding author.
The principal aim of this paper is to contribute to the understanding of the impact of porosity on the fatigue behaviour of TA6V alloy obtained by the SLM process and to compare the influence of porosity to that of the microstructure. In the literature, the effect of pore size on the fatigue strength of TA6V alloy fabricated by AM processes has been investigated by numerous researchers[10–14]. However, the results from these studies are quite scattered, principally due to the large variability in the fabrication process. AM processes require the use of many parameters that can affect the material properties, such as building direction, scan speed, laser power, scan pattern, temperatures, the initial powder properties (e.g. granulometry, new/recycled powder ratio) and also the post-heat treatments (e.g. annealed, hot isostatic pressing, etc…). Consequently, the variability in the microstructure and porosity (in-cluding the porosity density, pore size and pore morphology) is very significant. Even with the same process conditions and same operator, the variability between fabricated batches can also be notable[15]. One possible explanation for this variability is that pore formations are complex phenomena and not fully controlled. Even with the same process parameters, the largest pore size that governs the fatigue strength can vary significantly between batches and between specimens. For this reason, the number of specimens must be large enough in order to cover this variability and to reliably characterize the effect of porosity.
A vast experimental fatigue campaign for uniaxial loads with a load ratio of R = 0.1 has been undertaken. Seven different specimen batches have been investigated. They were obtained using different AM building directions (horizontal, vertical and di-agonal). All of the specimens were machined to avoid the effect of the as-built surface. The fabricated fatigue specimen size is relatively large (with a diameter of 8 mm and a gauge length of 24 mm) in order to be representative for industrial components. In total, 77 fatigue specimens were tested and all the fatigue failure surfaces were examined by SEM. In addition, the microstructure and the porosity of the investigated alloy was observed by optical microscopy on polished samples taken from failed fatigue specimens. In thefirst part of this paper, the characterization by optical microscopy of the microstructure and the porosity is presented as well as the tensile strength properties, to demonstrate the differences between the three building directions. More specifically, the microstructural anisotropy and the pore morphology anisotropy are highlighted. In the second section, the Wöhler curves are shown followed by characterization of the fatigue damage mechanisms. The size of pores at the crack initiation sites is measured and compared with the porosity characterized by the metallographic methodology. A link between the two pore size distributions is established by using the Murakami approach.
In the last section of this paper, the effect of pore on the fatigue behaviour is presented. Several analyses are shown to highlight the effect of the porosity, including the characterization of the critical pore size distribution and generalized Kitagawa-Takahashi maps linking the three variables: stress, number of cycles to failure and pore size. The influence of the pore size on the fatigue life is then modelled by using two fracture mechanics approaches: the Paris law and the Caton approach ([16–18]). A comparison of these two simulations is also shown. Finally, the generalized Kitagawa-Takahashi map is simulated by using the Caton approach and good correlation is obtained with the experimental data.
2. Specimen fabrication, metallurgical characterization and tensile strength 2.1. Specimen fabrication
The TA6V alloy used in this study is grade 23 ELI dedicated to medical and aeronautical applications. The chemical composition in weight percentage is shown inTable 1.
The TA6V powder, obtained by inert gas atomization, was supplied by AP&C with a 20–63 μm particle range. This particle distribution was confirmed by laser granulometry (Mastersizer Malvern, results: D10 = 30 μm, D50 = 43μm, D90 = 61 μm). This implies that 10% of the volume of the power particles are lower than 30μmand 10% higher than 60 μm.
The particle shape has also been observed by Scanning Electron Microscopy (SEM).Fig. 1) shows that the particles have a mostly spherical shape with no satellites and no agglomeration.
The specimens were fabricated by the Jules Verne Research and Technology Institute in France (IRT Jules Verne), using a SLM280 HL machine with a fabrication chamber volume of 278×278×325 mm3. The fabrication process was optimized thanks to a vast experimental campaign in which several process parameters such as laser power, scan speed, hatch distance and focus were taken into consideration. A porosity density level of approximately 0.01% (determined via optical microscopy observations on polished samples) is obtained.
The process parameter used to fabricate the specimens tested in this work were: a layer thickness of 30μm, laser power of 175 W, beam diameter of 80μm, a scanning velocity of V = 775 mm/s. The hatch distance (distance between two laser tracks) was 120 μm. The building platform is heated at 200 °C. The scanning strategy is a stripe pattern type of 10 mm width to be more representative of production job. The traverse (or scan) direction of the laser changes by 67° between each layer.
The fatigue specimen geometry after machining (shown inFig. 2) is given as per the ISO 2072:2010 standard and is the same for all batches. The specimen shape produced by SLM is thefinal geometry with a machining allowance of 1 mm. The SLM contour with a thickness of approximately 200μm is therefore totally removed by the machining operation.
Table 1
Referred chemical compositions of the investigated TA6V alloy.
Al V C Fe H N O
In total, seven fatigue specimen batches with three building directions were investigated. Note that the process parameters were the same for all of the specimen batches. The building directions are 0° (horizontal), 45° (diagonal) and 90° (vertical). The reason for fabricating several batches with the same building direction is to investigate the variability due to the process.Table 2summarizes the fabricated fatigue specimen batches.Fig. 3shows batches corresponding to the three building directions. It can be seen in these figures that a support structure was used for the whole specimen length for the 0° specimens while for the 45° and 90° specimens, a support structure was used only for one of the specimens heads.
After fabrication, all of the specimens were post-heat treated by a typical heat treatment (annealed at 850 °C for 2 h following by slow cooling within the furnace) to relax the residual stresses. All specimens were machined after the heat treatment. The Ra roughness of the machined surface is lower than 0.8μm. The roughness measurements were undertaken using a Bruker ContourGT-K 3D Optical profilometer and the ISO 4287 standard.
2.2. Microstructural characterization
It is well known in the literature that the microstructure of TA6V alloy, obtained by AM processes, is columnar[19]with grains growing in the building direction. In the present work, all of the specimens were fabricated and post-heat treated with the same parameters and heat treatment conditions. Therefore, the microstructures of all investigated batches is expected to be the same for all
Fig. 1. SEM analysis of powder particles.
Fig. 2. Final geometry of the fatigue specimens[50].
Table 2
Summary of the fabricated fatigue specimen batches.
Building Dir. Batch Ref. Batch specimen nb. Total
0 0°-B1 10 20 0°-B2 10 45 45°-B1 14 26 45°-B2 6 45°-B3 6 90 90°-B1 20 31 90°-B2 11
specimen orientations.
The microstructure was observed by using an optical microscope on polished and chemically etched samples (by using Kroll solution for 20 s). The observed samples were cut from the fatigue specimens after fatigue testing. The observations werefirstly made on planes parallel to the building direction as shown inFig. 4(a)–(c). It can be seen that the microstructure has the same columnar structure for all of the three building directions. However, it should be noted that the observations on planes perpendicular to the specimen axis are not the same and that these are planes of maximum principal stress, which are often considered as being critical planes in terms of the fatigue behaviour of defect-containing alloys (Fig. 4(a), (d) and (e)).
2.3. Porosity characterization
Porosity characterizations were conducted on 3 batches 0°-B1, 45°-B1 and 90°-B1. The analysed pores were observed on the planes perpendicular to the specimen axis, i.e. principal stress planes.
The characterization methodology proposed by Murakami[20]was used. As per this method, the size of the biggest pore observed in each standard inspection area of sizeS0is measured. The resulting distribution corresponds to the extreme value distribution related to the areaS0. In the present work, the inspection areaS0is equal to the area of the taken images,S0= 2.34 mm2. The area
Fig. 3. Batches corresponding the the three building directions[50].
Fig. 4. (a) to (c): observation planes parallel to the building direction; (d) and(e): observation planes perpendicular to the specimen axis for 45° and 90° specimens.
and the Maximum Feret diameter of the pores is used to define the pore size. For each batch, 300 images of sizeS0were analysed. Theses images were taken from samples cut from 3 fatigue specimens in the specimen’s gauge length after fatigue tests. The three specimens were intentionally chosen so that their fatigue strengths are representative of the fatigue strength of the batch.
Firstly, it was observed an high anisotropy of the geometry of the biggest pores. It can be seen that the largest pores detected by this methodology seem to be formed by the balling (or spatter) effect. This phenomenon has been widely investigated in the welding processes[21,22]. In additive manufacturing, the balling effect has also been studied[23–28]. This effect can be described as small
balls of molten metal created near the laser melting zone and blown by gasflow. It is shown inFig. 5that the size of“balling” particles can be up to 200μm, which is much larger than the powder particle size (controlled by sieving with a maximum diameter of 100μm). Because the laser power was optimized for the powder particles size (by considering several criteria such as porosity density, residual stresses and the distortion of as-fabricated parts), the“balling” particles cannot be totally melted and this fact results in the formation of lack-of-fusion pores.
The geometry of the“balling effect” related pores has been investigated by Kasperovich et al.[28]using micro-tomography observations. These authors showed that the pores relating to the balling phenomenon have a very spread geometry, i.e. a large area but small thickness. The plane on which pores spread out is generally perpendicular to the building direction. A same observation was also showed in the work of Romano et al.[29]for an AlSi10Mg alloy obtained by the SLM process.
From the microstructural and porosity characterizations,Fig. 6shows a sketch illustrating the microstructural anisotropy and the pore morphology anisotropy for the 3 building directions. Thisfigure is important as it illustrates the relationship between the microstructure, the build direction and the pore shape. Specifically it shows the columnar grains are elongated in the direction parallel to the building direction, and that the pores are large but spread out in planes perpendicular to the building direction. One of the aims of this work is to answer the question as to which is more important to consider in fatigue, the oriented columnar mi-crostructure or the porosity population.
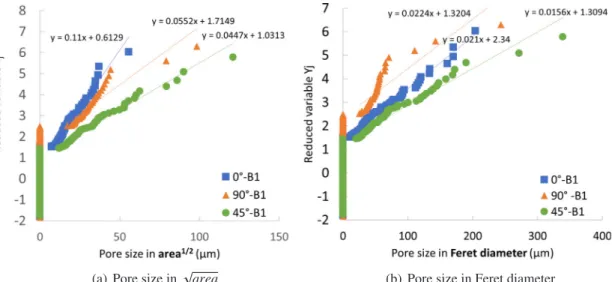
The pore size distributions for the three batches 0°-B1, 45°-B1 and 90°-B1 measured on the planes perpendicular to the specimen axis are shown inFig. 7. The y-axis is presented by using the reduced variable, Y, defined as a function of the empirical cumulative
probability, F, given as the following: = − −
Y ln( lnF) (1)
The Gumbel distribution[30]is used tofit the experimental data and shown inFig. 7as the linear regression lines of the non-zero experimental points. Greater details concerning this methodology can be found in references[31,32].
It can be observed that in general the pore size of the 0°-B1 specimens is smaller than that of 45°-B1 specimens, both in terms of
areaand the Feret diameter. The pore size of the 90°-B1 batch terms of area is slightly larger than the 0°-B1 but smaller than the 45°-B1 batch. In terms of Feret diameter, the pore size of 90°-B1 batch is the smallest. This trend is surprising because given the observed anisotropy of the large pore geometry as shown inFig. 6, it would be expected that the pore size of the 90° batch is the largest. In Section3.3presented below, it will be shown that the measured pore size distributions on polished samples are in good agreement with the pore size observed at the crack initiation sites for the 0°-B1 and the 45°-B1 batches. However, for the 90°-B1 batch, the pore size measured on polished samples under-estimates the porosity of the batch.
This disagreement could be due to the small thickness of the pores. At 90° the elongated direction of the pores is parallel to the
Fig. 5. Pores formed by the balling effect observed on a 0° (left) and 90° (right) specimen.
observation planes (seeFig. 6). The probability that an observation plane cuts a large pore is therefore small at 90°. The surface size based on 300 images with S0= 2.34 mm2is probably not enough to determine the largest defect size and correctly characterized the pore distribution of the batch.
In order to verify this hypothesis, a comparison of the pore size distribution between measurements on the perpendicular planes and measurements on the parallel planes for the 90°-B1 specimens is shown inFig. 8. It can be seen that the pore size measured on the parallel planes is larger than the one measured on the perpendicular planes, especially in terms of Feret diameter.
2.4. Tensile behaviour
Monotonic tensile tests were conducted using an INSTRON servo-hydraulic machine onflat specimens with rectangular cross-section of 2 mm × 6 mm and gauge length of 25 mm. The strain was measured thanks to an extensometer with an initial length
L0=25 mm and a displacement rangeΔL= ±2.5mm. All of the tests were conducted with a constant strain rate of 0.005 min−1at ambient temperature.
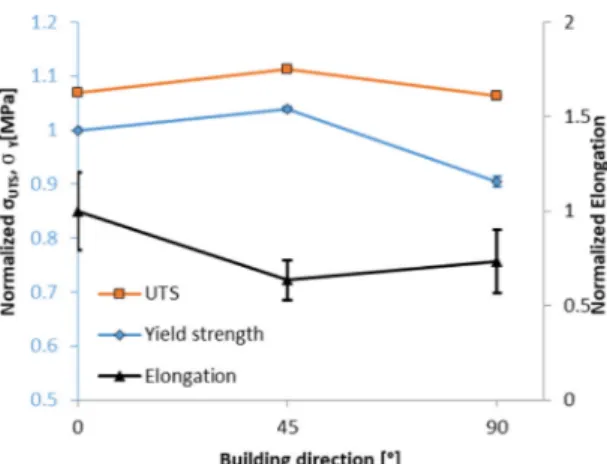
The comparison of the ultimate tensile strength, the yield strength and the fracture strain of the three building directions is shown inFig. 9. The values of the yield strength, σY, and ultimate strength,σUTS, were normalized by dividing by the mean value of the yield Fig. 7. Pore size distributions measured on polished samples of the three batches 0°-B1, 45°-B1 and 90°-B1. The observation planes are perpen-dicular to the specimen axis as shown inFig. 6.
strength of the 0° specimens. The values of the elongation were normalized by dividing by the mean value of the elongation of the 0° specimens. The error bars correspond to the standard deviations of the determined properties. It can be seen that the 45° specimens show the greatest yield strength and ultimate tensile strength and the 90° specimens have the lowest values.
3. Fatigue behaviour and damage mechanisms
All of the fatigue tests presented below were carried out at ambient temperature and pressure in laboratory air. The fatigue tests were conducted with a constant stress amplitude, a load ratio R = 0.1 and a frequency of 20 Hz. A maximum fatigue life of2×106 cycles was used. The stopping criterion was chosen to be the complete rupture of the specimen. The run-out specimens that survived
×
2 106cycles were re-tested at a higher load. 3.1. Wöhler curves
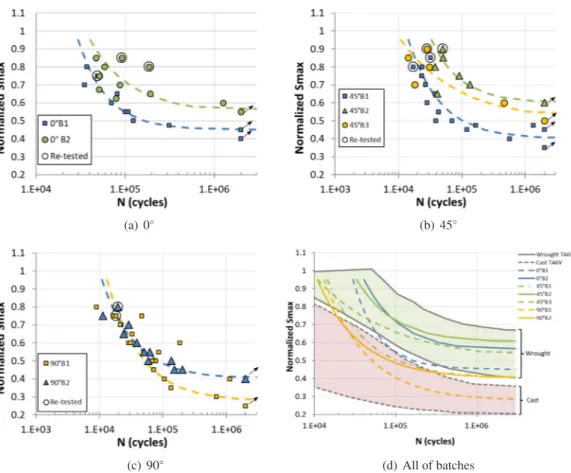
Fig. 10a-c shows the S-N curves for the 7 investigated batches. The values of the maximum stress, σmax, are normalized by the
average value of the ultimate strength,σUTS, for the three building directions as defined by the following equation. Note that the
maximum difference in the ultimate tensile strength between the three building directions is lower than 5%. = + + ° ° ° σ σ σ σ σ ( )/3 max n max
UTS UTS UTS
,
,0 ,45 ,90 (2)
The regression lines correspond to the Stromeyer theoretical model[33]as given by Eq.(3). The three parameters A B, and σmax n0, were identified to best fit the experimental data (seeTable 3).
= − × −
Log N( ) A B Log σ(max n, σmax n0, ) (3)
Firstly, a large degree of variability can be seen between the batches with the same building direction, in spite of the fact that the same process parameters were used. Measurements of the fabrication conditions such as the oxygen level or the plate and chamber temperatures also showed that there was no notable difference between batches. Similar variability was also seen in the work of Romano et al.[15]for the SLM process on an aluminium alloy. The scatter in the S-N curves is relatively high compared to wrought TA6V alloy[34], especially for the 0°-B2 and 45°B2 and B3 batches. It is interesting to note that these batches show a better fatigue strength compared with the other batch with the same building direction. In other words, it seems that the fatigue behaviour of the batch with a better fatigue resistance is more scattered than the one with lower fatigue strength.
Fig. 10(d) shows the comparison of thefitted Stromeyer curves of all of the batches as well as the fatigue data bands of the TA6V alloy obtained by the wrought and cast processes documented in[35]. It can be seen inFig. 10(d) that generally, the fatigue strength of the 90° batches is the lowest. However, no clear tendency is observed between the 0° and 45° specimens. In the literature, the results concerning the effect of the building direction of machined specimens show different trends. In the work of Wycisk et al.[10], no effect of the building direction was observed between the 45° and 90° specimens. However, in the work of Edwards and Ramulu
[2]and Nicolet to[36], the fatigue strength of the 90° specimens is lower than other directions. Comparing to the wrought and cast TA6V alloys, it can be stated that the fatigue strength of the 0° and 45° batches is comparable to the wrought TA6V while for the 90° batches, the fatigue strength slightly higher than the cast TA6V alloy.
3.2. Fatigue crack initiation mechanisms
All of the fatigue failure surfaces were analysed using a conventional ZEISS scanning electron microscope. It was observed that all of the fatigue cracks initiated from only one site. Almost all the fatigue cracks initiate from a pore (76 out of 77 specimens). Only one
specimen shows crack initiation with no detectable pore.
Most pores at the crack initiation sites are“lack of fusion” pores, located on the specimen surface (66 of 77 specimens) as shown in
Fig. 11.
Fig. 10. Wöhler curves for all of specimen batches: (a) 0° batches, (b) 45° batches, (c) 90° batches and (d) superposition of the Stromeyer theoretical curves of all batches. The arrows indicate the run-out specimens. The fatigue data bands for wrought and cast TA6V is documented in[35].
Table 3
Parameters of the Stromeyer equationfitted for each batch.
Batch A B σmax n0, 0-B1 4.250 0.742 0.450 0-B2 4.204 1.022 0.550 45-B1 3.861 1.150 0.400 45-B2 4.042 1.049 0.600 45-B3 3.309 2.106 0.500 90-B1 3.908 1.238 0.275 90-B2 3.728 1.193 0.400
Interestingly, it can also be seen inFig. 11for 45° and 90° specimens that“balling” particles seem to be the origin of the formation of the critical pore.
An other interesting observation is that the anisotropy of the pore morphology, related to the balling phenomenon (mentioned previously in Section2.3), can also be seen in the analysis of the failure surface.Fig. 12shows some pores at the crack initiation sites of 0° (left) and 90° (specimens).
It can be observed that the critical pores for the 0° specimens are generally elongated (i.e. the Minimum Feret diameter is much lower than the Maximum Feret diameter) while for the 90° specimens, the critical pores are more equiaxed.
3.3. Pore size distribution used for fatigue strength prediction
It was shown in the characterization of the pore size distribution obtained by optical microscopy on polished samples, taken from three batches 0°-B1, 45°-B1 and 90°-B1 (Section2.3), that the pore size of the 45°-B1 batch is the largest, while the difference in the
pore size between the 0°-B1 batch and the 90°-B1 batch is not clear. However, the order of the fatigue resistance for these three batches is not in agreement with the pore size distributions. In fact, the fatigue strength of the 90°-B1 is the lowest, while the 0°-B1 batch shows the highest fatigue strength (Fig. 10(d)). In order to understand this discrepancy, a comparison of the pore size dis-tributions characterized on polished samples with the disdis-tributions of pore size measured at the crack initiation site is shown in
Fig. 13.
Firstly, it can be seen that the pore size distributions measured on the fatigue failure surfaces is in a good agreement with the fatigue strength rank of the three batches (i.e. the 90°-B1 batch shows the lowest while the 0°-B1 batch shows the highest fatigue strength).
Secondly, it seems that the pore size distribution of the 90°-B1 batch characterized on polished samples by optical microscopy under-estimates the porosity level of the batch. In fact, the critical pore size distribution measured on the failure surfaces of the 90°-B1 batch is the largest while the distribution from polished samples for this batch shows a relatively low pore size compared to the other batches. One possible explanation is due to the anisotropy of the critical pore morphology (shown inFig. 12). That is, the possibility that a OM observation plane cuts a large pore is relatively small for the 90° building direction. Consequently, the measured pore size distribution for the 90° batch is not representative of the porosity density of the batch, even though a relatively large sample size was examined (i.e. 300 images of sizeS0= 2.34 mm2were analysed for each batch).
It can also be seen inFig. 13that the pore size distributions measured on polished samples is smaller than the ones measured at the crack initiation sites on the fatigue failure surfaces. This difference is widely observed in the literature ([37]) and can be ex-plained by the fact that the material volume characterized by the metallographic method is generally smaller than the gauge volume in the fatigue specimens. Hence, as per the extreme value theory ([30,38]), the pore size extreme distribution is larger when the volume of material characterized is higher.
In order to illustrate this“size effect” and to link the two distributions for each building orientation, it is proposed, as done in
previous work[37,39], to use an extension of the Murakami approach[20]proposed by Makkonen et al.[40]. As per this approach, the cumulative distribution function of the critical pore size at the crack initiation site associated with the loaded volume V is given by: ⎜ ⎟ = ⎡ ⎣ ⎢− ⎛ ⎝ − − ′ ⎞ ⎠ ⎤ ⎦ ⎥
F area V exp exp area μ β
( , ) ( )
(4) where ′ =μ μ+βln V V( / )0. μ and β are the location and scale parameter of the Gumbel distribution, metallographically identified by the line of best-fit inFig. 7.
The reference volume V0 characterized by the metallographic method can be calculated by V0=max( area)×S0 where
max( area)is the maximum pore size observed andS0= 2.34 mm2is the inspection area. The loaded volume V is the sub-surface hollow cylinder with a height of 24 mm, i.e. the specimen gauge length. The thickness of the hollow cylinder is 250μm corresponding to the maximum pore size observed on the failure surfaces. The reason for using the sub-surface volume is that it has been shown in the literature ([32,41,42]) for the high cycle fatigue (HCF) regime that surface pores are much more detrimental than internal pores. The dominate fatigue crack often initiates from surface pores, even though bigger pores are present in the bulk.Fig. 14shows the result of the prediction for the three batches 0°-B1, 45°-B1 and 90°-B1 for which the metallographical pore size characterization was done.
Good agreement between the prediction and the experimental data can be seen for the 0°-B1, 45°-B1 batches. However, for the 90°-B1 batch, the prediction under-estimates the critical pore size. This observation emphasizes both a volume effect and the dif-ficulty to correctly characterize the critical pore size distribution from the metallographic approach for each building direction. 4. The effect of porosity on the fatigue strength
In this section, the effect of pore size on the fatigue behaviour of all of the batches will be analysed and modelled. As shown in the
Fig. 13. Comparison of the pore size distributions obtained from observations on polished samples using optical microscopy (square data points labelled“OM”) and on failure surfaces(circular data points labelled “Crack initiations”).
Fig. 14. Correlation between the maximum pore size distributions predicted from the metallographical pore size characterization and the pore size distributions measured on the crack initiation sites.
previous section, the pore size distribution obtained by the metallographic method should not be assumed representative for all the building directions. For this reason, only the pore size distributions measured on the crack initiation sites will be considered in these analysis.
4.1. Correlation between the critical pore size distributions and the S-N curves
The pore size defined as the area measured at the crack initiation sites are plotted inFig. 15for all fatigue batches. By comparison with the S-N curves shown inFig. 10(d), it can be seen that the lowest fatigue strengths, obtained for the 90° batches are in a good agreement with the largest pore sizes compared with the 0° and 45° batches. For the 0° and 45° batches, no difference in the S-N curves is clearly visible. Furthermore, because of the large scatter in the Wöhler curves, the effect of the pore size on the fatigue strength can not be readily highlighted by correlation with the pore size distributions. In order to better understand the pore size effect, a map that links the applied stress (S), the pore size measured at the crack initiation site ( area ) and the fatigue life (Nf) is presented.
4.2. Generalized Kitagawa-Takahashi diagram: stress, pore size, fatigue life maps
The original Kitagawa-Takahashi diagram was proposed to show the relationship between the defect size and the fatigue strength at the infinite fatigue life of the material. The generalized Kitagawa-Takahashi diagram, initially proposed by Ciavarella et al.[43]
according to the authors knowledge, is used to show the relationship between three parameters: the fatigue life, the applied stress and the defect size. The authors presented this relationship in the“defect size - fatigue strength” plane using the fatigue life as isocurves. In the present work, the fatigue tests focused on the limited fatigue life domain with only a few data points were obtained for the “infinite” fatigue life. The run-out number of cycles was defined as ×2 106 cycles. Specimens that survived2×106cycles were considered to have an“infinite” fatigue life.
As discussed in the previous section, due to the large scatters in both the pore size distributions and the S-N curves, the classical diagrams such as the original Kitagawa-Takahashi or the Gumbel pore size distribution can not clearly highlight the role of the pore size on the fatigue behaviour. The generalized Kitagawa-Takahashi is hence an interesting way to analyse the data obtained at different fatigue lives.
Fig. 16(a) shows the generalized Kitagawa-Takahashi diagram for all pores for the three building directions. A linear interpolation in terms of Log N( f)was used tofill the maps. The Y-axis scale is the same for all of the three maps. The run-out specimens are also presented with a fatigue life of2×106cycles and with a pore size measured on the failure surface of the same specimen after re-tested at higher load.
Considering this representation of lifetime behavior, two interesting observations can be highlighted. Firstly, the yellow arrows shown in theFig. 16(a) point to perturbations, or specimens that have a better fatigue strength compared to neighbouring data. Observation of the fatigue failure surfaces, for these specimens showed that these points correspond to crack initiation from an internal pore as shown inFig. 16(b). This effect of initiation from an internal pore has been widely accepted in the literature ([42,44]).
The second observation concerns the effect of the pore morphology. It was mentioned previously in Section3.2that, for some of the 45°-B2 specimens, the crack initiated from spherical gas pores. By examining the map for the 45° batches (seeFig. 17(a)), a slightly better fatigue life can be seen for the specimens in which thefinal crack initiates from a spherical gas pore (indicated by yellow arrows).
The effect of pore morphology on the fatigue strength has been discussed in the literature ([41,45]) for both experimental and numerical studies.
By removing the data related to the internal crack initiation and the spherical gas pores and by considering only the surface “lack-of-fusion” pores, the map shown inFig. 18is constructed. Better agreement can be observed between the stress, the pore size and the
Fig. 16. (a) Generalized Kitagawa-Takahashi diagram or the S- area -Nfmap for all pores. The arrows indicate specimens for which crack initiation occurred from internal pores and (b) SEM images showing crack initiation from an internal pore[50].
Fig. 17. (a) Generalized Kitagawa-Takahashi map for 45° batches showing the effect of spherical gas pores (indicated by arrows) and (b) SEM images of crack initiation from a spherical gas pore.
Fig. 18. S- area -Nf map for only surface lack-of-fusion pores (i.e. without internal pores and spherical gas pores); circular dots = 0° specimens, square dots = 45° specimens, triangle dots = 90° specimens.
fatigue life, when compared to the original map. The effect of the oriented microstructure does not seem pronounced. As an example, the two points enclosed by the white ellipse inFig. 18correspond to two critical pores with similar size and geometry. The fatigue life of the two specimens are similar (67619 and 69350 cycles) however thefirst one is a 45° specimen and the second is a 90° specimen. 4.3. Modelling the effect of pore size on the fatigue life
As shown in the previous section, the fatigue resistance of the investigated alloy is controlled mainly by the pore size while the effect of the local microstructure does not seem pronounced. In this section, a model to predict the fatigue life, taking into account the pore size will be presented. Note that, in this section, crack initiation from internal pores (observed on 5 specimens out of a total of 77) and from spherical gas pores (observed on 5 specimens out of a total of 77) are not taken into account.
In the literature, several approaches for modelling the fatigue life, taking into account the defect size have been proposed. Among them, the fracture mechanics-based approach using the Paris law ([46,47]) is largely used to model the crack growth rate and predict the fatigue life. Similarly, Caton et al. ([16–18]) proposed a model for small fatigue crack growth and applied it with success to cast aluminium alloys. In the present study, these two approaches will be applied and compared for the investigated alloy.
•
The Paris law: =da
dN C(Δ )K
n
(5) whereΔK is the cyclic stress intensity factor (SIF). For microstructural crack-like pores, this factor can be calculated by the Murakami equation ([44]) given by:
=
K Y σ π area
Δ Δ (6)
where Y is equal to 0.65 for surface pores. By substituting Eq.(6)into Eq.(5)and given thatΔσ=(1−R σ) max, the initial crack
growth rate from a pore can be determined by the following equation: = ′ d area dN C σ area ( ) ( max( )1/2)n (7) where ′ =C C Y( (1−R))nπn/2and R is the load ratio.
•
The Caton approach:Caton assumed that the small crack growth rate is a function of the macroscopic maximum strainεmax, the stress amplitudeσaand
the yield strength of the materialσy, given by the following equation:
⎜ ⎟ = ⎛ ⎝ ⎜⎛ ⎝ ⎞ ⎠ ⎞ ⎠ ⎟ da dN D ε σ σ a max a y s t (8) where a is the defect size.
For the tests undertaken in our work the macroscopic maximum strainεmax can be replaced byσmax/E(where E is the Young’s
modulus) because the maximum applied fatigue loads always result in a maximum stress which is lower than the macroscopic yield strength of the material. If the Murakami’s parameter area is used to define the defect size, the initial crack growth rate from a pore is given by:
= ′ ′ d area dN D σ area ( ) (max( )1/2s t) (9) whereD′ =D
( )
−R Eσ st 1 2 y and ′ =t 2st.It can be seen from Eqs.(7) and (9)that mathematically, the Caton equation is an extension of the Paris law with the Murakami SIF. When s=1 the Caton model simplifies to the Paris law. Hence, the terms Yσ( max( area)1/2) for the Paris law and
Yσ area
( max( )1/2s)for the Caton approach can be used as variables to estimate the initial crack growth rate from a pore and therefore itsfinal fatigue life. InFig. 19, the relationship between the fatigue life and these terms for all the specimen batches is shown. In order to compare with the raw data in the S-N curves (shown inFig. 19(a)), the variable is normalized with reference pore size of
=
area 150μm.
=σ area For the Paris law:Corrected Smax ( )
(150)
max 1/2
1/2 (10)
=σ area For the Caton approach:Corrected Smax ( )
(150)
max s
s
1/2
1/2 (11)
The value ofs=1.67has been determined so that the scatter of the corrected S-N curves is the lowest.
One of the most interesting advantages of the“corrected stress versus fatigue life” diagram is that the validity of the criteria under investigation can be estimated with limited influence of the model parameter identification. For the Paris law, no parameters need to
be identified. However for the Caton approach, only one parameter s is necessary (instead of 3 parameters ′D s, andt′for the full model). In the literature, similar diagrams have been used to investigate the effect of the pore size and to validate a criterion. For example, in the work of Gunther et al.[11], the authors plotted the KI max, against the fatigue life while in the work of Masuo et al.
[48]and Yamashita et al.[49], a normalized stress σ σ/ wbased on the Murakami empirical modelσw=1.43(HV+120) area1/6was
used.
It can be clearly seen inFig. 19that the scatter in the corrected S-N diagrams is largely reduced, compared to the raw data. The Caton approach shows smaller scatter compared to the Paris law. Another observation is that no notable difference can be observed between the three building directions. A similar observation was shown in Section4.2. In other words, the effect of the oriented
microstructure, that is the columnar microstructure, is not the key factor controlling the fatigue strength.
To model the generalized Kitagawa-Takahashi map, the Caton approach is chosen. Caton et al. showed in their work ([18]) that the proposed model under-estimates the fatigue strength of the material for the unlimited fatigue life domain, so a combination with the crack growth threshold intensity factorΔKthseems necessary. A second term representing the asymptotic fatigue limit line is
added to Eq.(8)as shown in Eq.(12). This modification was also used in the work of Romano et al.[15].
⎜ ⎟ = ⎛ ⎝ ⎜⎛ ⎝ ⎞ ⎠ ⎞ ⎠ ⎟⎛⎝ − ⎞⎠ > da dN D ε σ σ a K K K K 1 Δ Δ ifΔ Δ max a y s t th p th (12) Four material parametersD s t, , and p, were identified to best-fit the experimental data.
The resulting generalized Kitagawa-Takahashi maps is shown inFig. 20a–c.Fig. 20(a) shows the predictions in log-log scale using the iso-value curves.Fig. 20(b) is nothing butFig. 18presented in log-log scale using the iso-value curves.Fig. 20(c) shows the error map in Log-Log scale. The error between the model and the raw data is defined as follow:
= N N Error f Exp f Sim , , (13)
where Nf Exp, and Nf Sim, are respectively the experimental and simulated number of cycles to failure.
Fig. 19. Comparison of the scatter of the S-N curves between (a) the raw data, (b) the Paris law corrected-stress data with the Murakami SIF, (c) the Canton corrected-stress data withs=1.67. The Y-axis of the three diagrams have the same scale.
It can be noticed that the discontinuities of the iso-value curves in log N( f)represented inFig. 20(b) are more pronounced in the unlimited fatigue life domain in which the lack of experimental data is probably the cause.
InFig. 20(a), the utilized model does not permit predicting the fatigue limit in the region without defect. This is simply because the LEFM based criterion used to model the fatigue strength at the unlimited fatigue life uses a constant stress intensity factor,
K
Δ th,that is not appropriate to model the fatigue strength of the porosity-free material. In the present study, this fact is not really
problematical because all the analysed fatigue specimens showed a crack initiation from pore. It can be seen in the error map that the predictions are quite good in this region with the error lies between 0.8 and 1.6 (i.e.0.8Nf Sim, ⩽Nf Exp, ⩽1.6Nf Sim, ).
5. Conclusion
This paper deals with the fatigue behaviour of TA6V titanium alloy fabricated by the SLM process. A great deal of experimental data was obtained for 7 specimen batches with 3 building directions. Several analyses have been done in order tofinely characterize the effect of pore size on the fatigue strength. A generalized Kitagawa-Takahashi diagram is shown to be an appropriate way to analyse the stress, fatigue life and pore size relationships.
The principal results are as follow:
•
It has been highlighted that the oriented microstructure (columnar grains) and the pore geometry anisotropy (“balling effect” related pores) are linked to the building direction.•
The characterization of the porosity by optical observations on polished samples under-estimates the critical pore size for the 90° specimens. For the 0° and 45°, the measured pore size distributions by this methodology is in agreement with the order of the fatigue resistance and can be used to predict the critical pore size distributions by the Murakami approach.•
The effect of the pore size on the fatigue behaviour, investigated using the generalized Kitagawa-Takahashi diagrams, showed that he fatigue resistance is mainly controlled by the pore size, characterized by the Murakami’s parameter area . The effect of the oriented microstructure is not pronounced.Fig. 20. The generalized Kitagawa-Takahashi diagrams using iso-values curves in log-log scale, modelled using the Caton approach (a) and built from the experimental data (b); The error map in log-log scale (c).
•
Two fracture mechanics approaches, the Paris law and the Caton model, were used to predict the fatigue life. By using the “corrected” S-N curves, the Caton approach shows better agreement than the Paris law. The predictions of the fatigue life obtained by using the Caton approach was correlated with the experimental data thanks to the generalized Kitagawa-Takahashi diagram and shows relatively good results.Acknowledgement
This study is part of the FATAL project, managed by IRT Jules Verne (French Institute in Research and Technology in Advanced Manufacturing Technologies for Composite, Metallic and Hybrid Structures). The authors wish to associate the industrial and aca-demic partners of this project; Respectively ACB, Arts et Métiers ParisTech, CNRS, DAHER, Ecole Centrale de Nantes, Europe Technologies, FIVES, Renault and University of Nantes.
References
[1] Leuders S, Lieneke T, Lammers S, Tröster T, Niendorf T. On the fatigue properties of metals manufactured by selective laser melting– the role of ductility. J Mater Res 2014;29(17):1911–9.https://doi.org/10.1557/jmr.2014.157.
[2] Edwards P, Ramulu M. Fatigue performance evaluation of selective laser melted Ti-6AL-4V. Mater Sci Eng: A 2014;598:327–37.https://doi.org/10.1016/j.msea. 2014.01.041.
[3] Xu W, Sun S, Elambasseril J, Liu Q, Brandt M, Qian M. Ti-6AL-4V additively manufactured by selective laser melting with superior mechanical properties. JOM 2015;67(3):668–73.https://doi.org/10.1007/s11837-015-1297-8.
[4] Gong H, Rafi K, Gu H, Ram GJ, Starr T, Stucker B. Influence of defects on mechanical properties of ti 6al 4v components produced by selective laser melting and electron beam melting. Mater Des 2015;86:545–54.https://doi.org/10.1016/j.matdes.2015.07.147.
[5] Bian L, Thompson SM, Shamsaei N. Mechanical properties and microstructural features of direct laser-deposited Ti-6AL-4V. JOM 2015;67(3):629–38.https:// doi.org/10.1007/s11837-015-1308-9.
[6] Rafi HK, Starr TL, Stucker BE. A comparison of the tensile, fatigue, and fracture behavior of Ti-6AL-4V and 15-5 PH stainless steel parts made by selective laser melting. Int J Adv Manuf Technol 2013;69(5-8):1299–309.https://doi.org/10.1007/s00170-013-5106-7.
[7] Facchini L, Magalini E, Robotti P, Molinari A, Hges S, Wissenbach K. Ductility of a Ti-6AL-4V alloy produced by selective laser melting of prealloyed powders. Rapid Prototyp J 2010;16(6):450–9.https://doi.org/10.1108/13552541011083371.
[8] Leuders S, Meiners S, Wu L, Taube A, Trster T, Niendorf T. Structural components manufactured by selective laser melting and investment casting impact of the process route on the damage mechanism under cyclic loading. J Mater Process Technol 2017;248:130–42.https://doi.org/10.1016/j.jmatprotec.2017.04.026. URLhttp://www.sciencedirect.com/science/article/pii/S0924013617301619.
[9] Chan KS, Koike M, Mason RL, Okabe T. Fatigue life of titanium alloys fabricated by additive layer manufacturing techniques for dental implants. Metall Mater Trans A 2012;44(2):1010–22.https://doi.org/10.1007/s11661-012-1470-4.
[10] Wycisk E, Solbach A, Siddique S, Herzog D, Walther F, Emmelmann C. Effects of defects in laser additive manufactured Ti-6AL-4V on fatigue properties. Phys Proc 2014;56:371–8.https://doi.org/10.1016/j.phpro.2014.08.120.
[11] Günther J, Krewerth D, Lippmann T, Leuders S, Tröster T, Weidner A, et al. Fatigue life of additively manufactured Ti-6AL-4V in the very high cycle fatigue regime. Int J Fatigue 2017;94:236–45.https://doi.org/10.1016/j.ijfatigue.2016.05.018.
[12] Greitemeier D, Palm F, Syassen F, Melz T. Fatigue performance of additive manufactured TiAl6v4 using electron and laser beam melting. Int J Fatigue 2017;94:211–7.https://doi.org/10.1016/j.ijfatigue.2016.05.001.
[13] Fatemi A, Molaei R, Sharifimehr S, Phan N, Shamsaei N. Multiaxial fatigue behavior of wrought and additive manufactured Ti-6AL-4V including surface finish effect. Int J Fatigue 2017;100:347–66.https://doi.org/10.1016/j.ijfatigue.2017.03.044.
[14] Fatemi A, Molaei R, Sharifimehr S, Shamsaei N, Phan N. Torsional fatigue behavior of wrought and additive manufactured Ti-6AL-4V by powder bed fusion including surfacefinish effect. Int J Fatigue 2017;99:187–201.https://doi.org/10.1016/j.ijfatigue.2017.03.002.
[15] Romano S, Brckner-Foit A, Brandão A, Gumpinger J, Ghidini T, Beretta S. Fatigue properties of AlSi10mg obtained by additive manufacturing: Defect-based modelling and prediction of fatigue strength. Eng Fract Mech 2018;187:165–89.https://doi.org/10.1016/j.engfracmech.2017.11.002.
[16] Caton M, Jones J, Boileau J, Allison J. The effect of solidification rate on the growth of small fatigue cracks in a cast 319-type aluminum alloy. Metall Mater Trans A 1999;30(12):3055–68.https://doi.org/10.1007/s11661-999-0216-4.
[17] Caton M, Jones J, Allison J. The influence of heat treatment and solidification time on the behavior of small-fatigue-cracks in a cast aluminum alloy. Mater Sci Eng: A 2001;314(1–2):81–5.https://doi.org/10.1016/S0921-5093(00)01916-X. URLhttp://www.sciencedirect.com/science/article/pii/S092150930001916X. [18]Caton MJ, Jones JW, Mayer H, Stanzl-Tschegg S, Allison JE. Demonstration of an endurance limit in cast 319 aluminum. Metall Mater Trans A
2003;34(11):33–41.
[19] Thijs L, Verhaeghe F, Craeghs T, Humbeeck JV, Kruth J-P. A study of the microstructural evolution during selective laser melting of Ti-6AL-4V. Acta Mater 2010;58(9):3303–12.https://doi.org/10.1016/j.actamat.2010.02.004.
[20] Murakami Y. Effects of small defects and nonmetallic inclusions. Elsevier; 2002.
[21] Wu D, Hua X, Li F, Huang L. Understanding of spatter formation infiber laser welding of 5083 aluminum alloy. Int J Heat Mass Transf 2017;113:730–40.https:// doi.org/10.1016/j.ijheatmasstransfer.2017.05.125.
[22] Zhang M, Chen G, Zhou Y, Li S, Deng H. Observation of spatter formation mechanisms in high-powerfiber laser welding of thick plate. Appl Surf Sci 2013;280:868–75.https://doi.org/10.1016/j.apsusc.2013.05.081.
[23] Gunenthiram V, Peyre P, Schneider M, Dal M, Coste F, Koutiri I, et al. Experimental analysis of spatter generation and melt-pool behavior during the powder bed laser beam melting process. J Mater Process Technol 2018;251:376–86.https://doi.org/10.1016/j.jmatprotec.2017.08.012.
[24] Koutiri I, Pessard E, Peyre P, Amlou O, Terris TD. Influence of SLM process parameters on the surface finish, porosity rate and fatigue behavior of as-built inconel 625 parts. J Mater Process Technol 2018;255:536–46.https://doi.org/10.1016/j.jmatprotec.2017.12.043.
[25] Darvish K, Chen Z, Pasang T. Reducing lack of fusion during selective laser melting of CoCrMo alloy: Effect of laser power on geometrical features of tracks. Mater Des 2016;112:357–66.https://doi.org/10.1016/j.matdes.2016.09.086.
[26] Anwar AB, Pham Q-C. Study of the spatter distribution on the powder bed during selective laser melting. Additive Manuf 2018;22:86–97.https://doi.org/10. 1016/j.addma.2018.04.036.
[27] Khairallah SA, Anderson AT, Rubenchik A, King WE. Laser powder-bed fusion additive manufacturing: Physics of complex meltflow and formation mechanisms of pores, spatter, and denudation zones. Acta Mater 2016;108:36–45.https://doi.org/10.1016/j.actamat.2016.02.014.
[28] Kasperovich G, Haubrich J, Gussone J, Requena G. Correlation between porosity and processing parameters in TiAl6v4 produced by selective laser melting. Mater Des 2016;105:160–70.https://doi.org/10.1016/j.matdes.2016.05.070.
[29] Romano S, Brandão A, Gumpinger J, Gschweitl M, Beretta S. Qualification of {AM} parts: extreme value statistics applied to tomographic measurements. Mater Des 2017.https://doi.org/10.1016/j.matdes.2017.05.091. URLhttp://www.sciencedirect.com/science/article/pii/S0264127517305737.
[30] Gumbel E. Statistical theory of extreme values and some practical applications: a series of lectures Applied mathematics series. U.S. Govt. Print. Office; 1954. URLhttp://books.google.fr/books?id=SNpJAAAAMAAJ.
different multiaxial loads. Int J Fatigue 2016;93(Part 1):109–21.https://doi.org/10.1016/j.ijfatigue.2016.08.014. URLhttp://www.sciencedirect.com/science/ article/pii/S014211231630247X.
[32] Le V-D, Morel F, Bellett D, Saintier N, Osmond P. Multiaxial high cycle fatigue damage mechanisms associated with the different microstructural heterogeneities of cast aluminium alloys. Mater Sci Eng: A 2016;649:426–40.https://doi.org/10.1016/j.msea.2015.10.026. URLhttp://www.sciencedirect.com/science/ article/pii/S0921509315304901.
[33] Kasi M. The determination of fatigue limits under alternating stress conditions. Proc Roy Soc London A: Mathe, Phys Eng Sci 1914;90(620):411–25.https://doi. org/10.1098/rspa.1914.0066. URLhttp://rspa.royalsocietypublishing.org/content/90/620/411.full.pdf.
[34] Nalla RK, Ritchie RO, Boyce BL, Campbell JP, Peters JO. Influence of microstructure on high-cycle fatigue of Ti-6AL-4V: Bimodal vs. lamellar structures. Metall Mater Trans A 2002;33(3):899–918.https://doi.org/10.1007/s11661-002-0160-z.
[35] Donachie MJ. Titanium: A technical guide. ASM International; 2000. URLhttps://www.amazon.com/Titanium-Technical-Matthew-J-Donachie/dp/ 0871706865?SubscriptionId=AKIAIOBINVZYXZQZ2U3A&tag=chimbori05-20&linkCode=xm2&camp=2025&creative=165953&creativeASIN= 0871706865.
[36] Nicoletto G. Anisotropic high cycle fatigue behavior of Ti-6AL-4V obtained by powder bed laser fusion. Int J Fatigue 2017;94:255–62.https://doi.org/10.1016/j. ijfatigue.2016.04.032.
[37] Le VD. Etude de linfluence des htrognits microstructurales sur la tenue en fatigue grand nombre de cycles des alliages daluminium de fonderie, Ph.D. thesis, ENSAM, thse de doctorat dirige par Morel, FranckSaintier, Nicolas et Bellett, Daniel Mcanique-matriaux Paris, ENSAM 2016; 2016. URLhttp://www.theses.fr/ 2016ENAM0012.
[38] Weibull W. A statistical theory of the strength of materials. Generalstabens litografiska anstalts frlag; 1939.
[39] Osmond P, Le V-D, Morel F, Bellett D, Saintier N. Effect of porosity on the fatigue strength of cast aluminium alloys: from the specimen to the structure. Procedia Eng 2018;213:630–43.https://doi.org/10.1016/j.proeng.2018.02.059.
[40] Makkonen L, Rabb R, Tikanmki M. Size effect in fatigue based on the extreme value distribution of defects. Mater Sci Eng: A 2014;594(0):68–71.https://doi.org/ 10.1016/j.msea.2013.11.045. URLhttp://www.sciencedirect.com/science/article/pii/S0921509313012732.
[41] Dezecot S, Maurel V, Buffiere J-Y, Szmytka F, Koster A. 3d characterization and modeling of low cycle fatigue damage mechanisms at high temperature in a cast aluminum alloy. Acta Mater 2017;123:24–34.https://doi.org/10.1016/j.actamat.2016.10.028. URLhttp://www.sciencedirect.com/science/article/pii/ S1359645416307923.
[42] Serrano-Munoz I, Buffiere J-Y, Verdu C, Gaillard Y, Mu P, Nadot Y. Influence of surface and internal casting defects on the fatigue behaviour of a357-t6 cast aluminium alloy. Int J Fatigue 2016;82(Part 3):361–70.https://doi.org/10.1016/j.ijfatigue.2015.07.032. URLhttp://www.sciencedirect.com/science/article/ pii/S0142112315002509.
[43] Ciavarella M, Monno F. On the possible generalizations of the Kitagawa-Takahashi diagram and of the el haddad equation tofinite life. Int J Fatigue 2006;28(12):1826–37.https://doi.org/10.1016/j.ijfatigue.2005.12.001.
[44] Murakami Y. Stress intensity factors handbook. Elsevier Science Limited; 1987. URLhttp://books.google.fr/books?id=E4lUAAAAMAAJ.
[45] Le V-D, Saintier N, Morel F, Bellett D, Osmond P. Investigation of the effect of porosity on the high cycle fatigue behaviour of cast al-si alloy by x-ray micro-tomography. Int J Fatigue 2018;106:24–37.https://doi.org/10.1016/j.ijfatigue.2017.09.012.
[46] Paris P, Gomez M, Anderson W. A rational analytic theory of fatigue. Trend Eng 1961;13:9.
[47] Paris P, Erdogan F. A critical analysis of crack propagation laws. J Basic Eng 1963;85(4):528.https://doi.org/10.1115/1.3656900.
[48] Masuo H, Tanaka Y, Morokoshi S, Yagura H, Uchida T, Yamamoto Y, et al. surface roughness and HIP on fatigue strength of Ti-6AL-4V manufactured by additive manufacturing. Procedia Struct Integ 2017;7:19–26.https://doi.org/10.1016/j.prostr.2017.11.055.
[49] Yamashita Y, Murakami T, Mihara R, Okada M, Murakami Y. Defect analysis and fatigue design basis for ni-based superalloy 718 manufactured by selective laser melting. Int J Fatigue 2018;117:485–95.https://doi.org/10.1016/j.ijfatigue.2018.08.002.
[50] Le V-D, Pessard E, Morel F, Edy F. Influence of porosity on the fatigue behaviour of additively fabricated ta6v alloys. MATEC Web Conf 2018;165:02008.https:// doi.org/10.1051/matecconf/201816502008.
![Fig. 2. Final geometry of the fatigue specimens [50].](https://thumb-eu.123doks.com/thumbv2/123doknet/7438362.220421/4.816.253.564.355.525/fig-final-geometry-fatigue-specimens.webp)

![Fig. 6. Illustration of the microstrucural anisotropy and the pore morphology anisotropy of the investigated alloy [50].](https://thumb-eu.123doks.com/thumbv2/123doknet/7438362.220421/6.816.162.661.83.266/fig-illustration-microstrucural-anisotropy-morphology-anisotropy-investigated-alloy.webp)