Science Arts & Métiers (SAM)
is an open access repository that collects the work of Arts et Métiers Institute of Technology researchers and makes it freely available over the web where possible.
This is an author-deposited version published in: https://sam.ensam.eu Handle ID: .http://hdl.handle.net/10985/12466
To cite this version :
Julie DIANI, Pierre GILORMINI - On necessary precautions when measuring solid polymer linear viscoelasticity with dynamic analysis in torsion - Polymer testing - Vol. 63, p.275-280 - 2017
Any correspondence concerning this service should be sent to the repository Administrator : [email protected]
On necessary precautions when measuring solid polymer linear viscoelasticity
with dynamic analysis in torsion
Julie Diania,*, Pierre Gilorminib
aLMS, Ecole Polytechnique, CNRS, Université Paris-Saclay, 91128 Palaiseau, France bLaboratoire PIMM, ENSAM, CNRS, CNAM, 151 bd de l’Hôpital, 75013 Paris, France *Corresponding author: [email protected], tel: +33 1 69 33 57 90 Abstract Solid polymer linear viscoelasticity in shear is often characterized by applying torsion and using the Saint-Venant solution when rectangular prismatic specimens are considered. It is shown that experimental dynamic torsion tests can show a dependency of the storage modulus and damping factor on the dimensions of the rectangular prismatic specimen when linear temperature ramps are applied. While the discrepancy of damping factor is explained by temperature heterogeneities and can be corrected easily by applying temperature steps, the inconsistency of storage modulus is due to an invalid application of the Saint-Venant solution. Finite element simulations allowed definition of the sample dimensions for which the Saint-Venant solution provides a good approximation, and a coefficient is given to correct the results obtained with commercial rheometers when other sample dimensions are used. Keywords: Viscoelasticity, Rheometer, Torsion, Solid 1.Introduction The linear viscoelastic behavior of solid polymers is often estimated from uniaxial tension or torsion dynamic mechanical tests. While uniaxial tension is appropriate to reach the storage and loss Young’s moduli, torsion allows measuring the storage and loss shear moduli. When dealing with torsion rheometers, such as the Anton Paar MCR series, tests are often run on rectangular specimens and the storage modulus and damping factor are obtained from the Saint-Venant solution [1]. The rectangular shape is often preferred to the cylinder shape despite the fact that clamping renders the Saint-Venant solution inappropriate. Dessi et al. [2] reported a storage modulus dependency on the specimen length/width aspect ratio measured on a styrene butadiene rubber in its rubbery state. They proposed a correction coefficient to the Saint-Venant solution when dealing with rubbers (Poisson's ratio equal to 0.5), a fixed width/thickness ratio equal to 4 and a length/width ratio ranging from 0.25 to 1.85. Unfortunately, these aspect ratios do not cover the entire range of specimen dimensions recommended by constructors. The Anton Paar documentation recommends a length (L) x width (W) x thickness (T) product of 40 x 10 x 1 mm3. The TA instruments Ares-G2
documentation mentions that sample length and width should be 40 and 12 mm respectively, while the specimen thickness should range between 0.3 and 6 mm. Finally, the international standard ISO 4664-2 [3], designed to determine the dynamic properties of rubbers with torsion pendulum methods at low frequencies, recommends using specimens of 1 mm thickness, with a preferred width value of 10 mm and a length between 40 and 120 mm chosen to fit the clamping device. In the latter respect, note for instance that the thermal chamber CTD 600 from Anton Paar limits the specimen length to 50 mm.
In the present contribution, we expose the significant impact of the sample dimensions when characterizing the linear viscoelastic response of a solid amorphous polymer with torsion dynamic tests applied to a rectangular prismatic sample. For this purpose, two specimens with
different aspect ratios were submitted to a sinusoidal torsion with constant amplitude and frequency, at various temperatures applied either with a linear ramp or stepwise in a rheometer. In order to better understand the experimental results, finite element simulations reproducing the experimental torsion tests were run. These simulations allow definition of the suitable geometries to apply the Saint-Venant solution, which is used by commercial rheometers. They also allow proposal of a correction coefficient when other geometries are used.
2. Impact of sample rectangular dimensions: Experimental evidence
2.1. Material and experiment
In order to run torsion tests on rectangular geometries, plates of an amorphous polymer network were prepared in the lab. The material was a mere acrylate network obtained by copolymerization of benzyl methacrylate (BMA) with poly (ethylene glycol) dimethacrylate (PEGDMA) of molar weight 550 g/mol used as crosslinking agent. Products were used as received from Sigma Aldrich in proportion 90% molar mass of BMA 10% molar mass of PEGDMA. The mix was cured in a UVP ultraviolet chamber CL-1000 for 50 minutes between glass plates in order to obtain acrylate plates of 1 mm thickness. Rectangular specimens of either 12 or 5 mm width were punched from the plates. Finally, once set in the grips, two geometries of 46x5x1 and 20x12x1 mm3 were tested. The material viscoelasticity was measured with a MCR502 rheometer from Anton Paar. During the dynamic mechanical analysis (DMA) tests, a sinusoidal deflection angle 𝜃 = 𝜃# sin (2𝜋𝑓𝑡) is applied with a small angle amplitude 𝜃# at a given frequency 𝑓. Due to the material linear viscoelastic behavior at low strain, the resulting torque is of the form 𝑀 = 𝑀# sin (2𝜋𝑓𝑡 + 𝛿), with tan 𝛿 characterizing the material damping factor in shear obtained directly from the phase difference between the applied deflection and the measured torque. If the Saint-Venant solution for the free-end torsion of prisms is applied, the material storage shear modulus is calculated from the measured torque as: 𝐺′ = 7 56 89 :; <8 =>? @ AB#.D5# :/9 (1) for width/thickness (W/T) ratios of at least 3 [4]. It is usual to submit amorphous polymers to a temperature sweep at given frequency and strain amplitude, in order to determine the glass transition temperature or the range of temperature that enhances the material viscoelasticity. Therefore, a temperature sweep was applied to the samples.
2.2. Linear temperature heating ramp
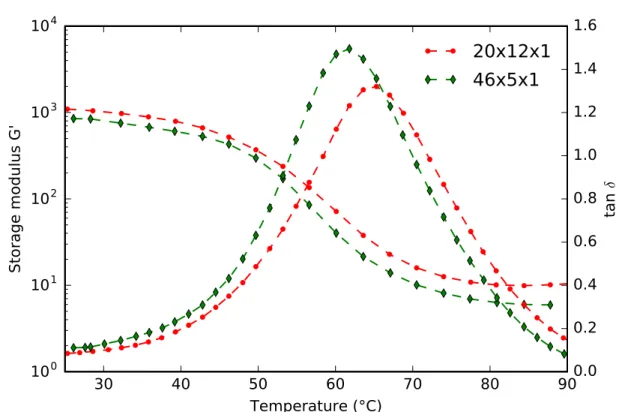
The rectangular samples were submitted to torsion oscillations at 1 Hz and 0.1% strain amplitude during linear heating ramps at 1 °C/min. Note that it was verified that the material response was linear at 0.1% strain. Figure 1 presents the storage shear modulus 𝐺′ and the damping factor tan 𝛿 calculated from the recorded torque 𝑀 using the Saint-Venant solution (Eq. (1)), with respect to temperature. These values are very similar to those read in the report data sheet from the Anton Paar rheometer except for some discrepancies noticed at high temperatures because the Anton Paar software does not account for the variations of sample length (gap between the two grips) as it should. Indeed, due to the constant axial force applied to avoid sample buckling, the gap between grips increases with temperature. Note that it is recommended to keep the axial force as low as possible to avoid large gap changes that may
occur suddenly, as we observed when the normal force was set to -1N (the minus sign stands for tension for Anton Paar reference).
Figure 1 shows a storage modulus and a damping factor which depend on the sample geometry, and this raises the question of which (if any) data represent the actual behavior of the material. Since the long sample stands from the bottom to the top of the thermal chamber and the short sample is relatively wide, it is not guaranteed that any sample is heated homogeneously during the heating ramp. Therefore, the same oscillatory loading was applied while the temperature was set stepwise, allowing temperature to homogenize throughout the samples during long steps.
2.3. Stepwise temperature change
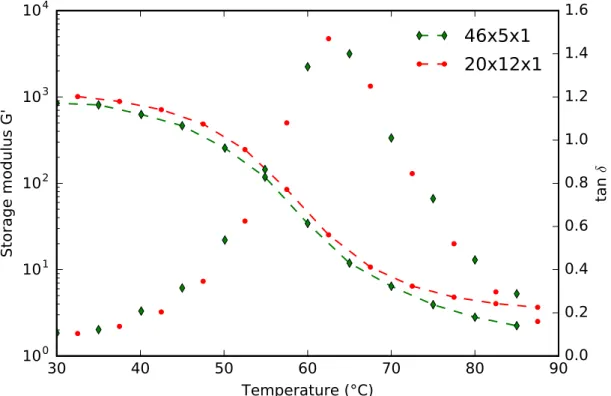
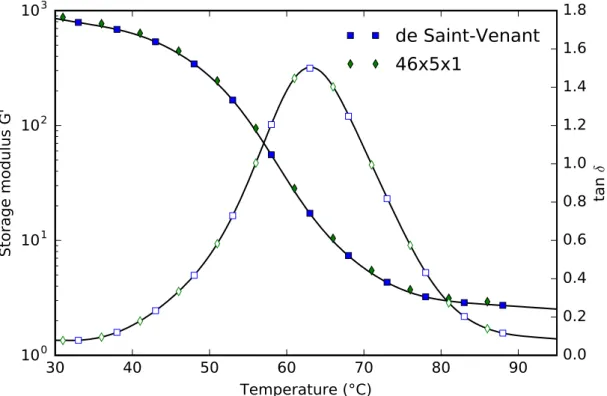
For these tests, once a target temperature was reached, the samples were kept for five minutes at constant temperature before applying the torsion at 1 Hz and 0.1% strain. Figure 2 displays the storage shear modulus and the damping factor obtained for both geometries with respect to temperature. Unlike in Figure 1, the damping factors now coincide. Note that the tan 𝛿 curve shown in Figure 2 does not superpose with any of the curves displayed in Figure 1, which have broader bell shapes. The latter result shows that a linear temperature ramp, even as low as 1 °C/min and with relatively thin samples (1 mm), may induce a non homogeneous temperature that leads to inaccurate damping factors. As a consequence, temperature should be applied stepwise to reach an equilibrium before attempting any measure. The storage modulus values remain specimen shape dependent in Figure 2, with the shorter and wider sample evidencing a significantly larger storage modulus. In order to understand this result, finite element simulations reproducing the torsion test were run. The material viscoelastic behavior, defined by a generalized Maxwell model combined the WLF equation [5] for time-temperature superposition, was fitted according to textbook procedures [6,7]. Since the long sample is closer to the Saint-Venant assumption of a slender prism, the material behavior was fitted on this sample response, and the resulting parameters are listed in Table 1. As shown in Figure 3, these parameters provide a very good representation of the viscoelastic response of the long and narrow sample obtained with temperature steps. These parameters are now used to specify the linear viscoelasticity of the material in finite element simulations. 3.Impact of sample geometry: Finite element analysis In the experiments, the specimens are clamped at both ends, and this defines a torsion test that differs from the Saint-Venant free-end torsion problem. Therefore, finite element simulations were performed to estimate how the actual recorded torque compares to the Saint-Venant solution according to the specimen shape.
3.1. Linear viscoelastic simulations
The Abaqus [8] finite element code was used to perform the simulations reported in this study. The material obeyed the small strain linear viscoelastic model described in the previous Section. The length unit was given by the specimen thickness, and a mesh was defined where all elements had the same cubic shape with an edge length equal to one tenth of the specimen thickness. Accordingly, a 20x12x1 specimen is made of 240,000 identical linear elements, for instance. A torsion about the long specimen axis was applied to one end of the specimen, while the opposite end was fixed. More precisely, two types of conditions were applied to these boundaries, according to which the displacements parallel to the torsion axis were
allowed (like in the Saint-Venant solution) in the end sections or not (like in the rheometer). Small angle amplitude sinusoidal torsions were applied at 1 Hz at various uniform and set temperatures. The calculated torque stabilized after the second cycle, which required to compute at least three cycles. Each cycle was discretized into 512 equal time steps to avoid inaccurate results within the glass transition, where the material viscoelasticity is enhanced. A fast Fourier transform was applied to the computed torque values in the stabilized cycle, leading to 𝑀# 𝑐𝑜𝑠𝛿 and 𝑀# 𝑠𝑖𝑛𝛿, which gives tan 𝛿 directly, and then the storage modulus 𝐺′
is evaluated by using Eq. (1). This assumes that the Saint-Venant solution applies, like in the rheometer software.
The first comparison considers the long narrow sample (LxWxT=46x5x1) with the two types of boundary conditions prescribed alternatively. The comparison between the model material behavior plotted in Figure 3 and the estimates deduced from the simulations is shown in Figure 4. First, as could be expected since the Saint-Venant solution is exact, finite element simulations using the free-end boundary conditions reproduce the material behavior perfectly. Second, Figure 4 shows that the material behavior estimated by applying the rheometer boundary conditions to the long narrow sample is very close to the actual material behavior, although the storage modulus 𝐺′ is slightly overestimated. This shows the pertinence of the Saint-Venant assumption for the long and narrow sample, since the latter geometry gives access to a very good estimate of the material behavior directly. The dynamic torsion test was also simulated with the short wide 20x12x1 sample. Of course, both the short wide sample and the long narrow sample lead to the same (and exact) material behavior when the free-end boundary conditions are applied in the simulations. Like for the long sample, the Saint-Venant solution (Eq. (1)) is applied to calculate the storage modulus from the calculated torque when rheometer-like boundary conditions are applied, and Figure 5 compares the results to the experimental data. As one reads, the simulations are in very good agreement with the experimental data for the short sample as well as for the long one, therefore our finite element simulations do capture the essential features of the dynamic torsion test. Although the damping factor is assessed well, it can be observed that the storage modulus is still overestimated when applying the Saint-Venant solution to the clamped short sample. In order to better understand this result and to ultimately propose a geometry correction when needed, simulations were now run in linear elasticity allowing to test quickly a large number of cases.
3.2. Linear elastic simulations
The material is now elastic and characterized by its shear modulus 𝐺 and its Poisson's ratio 𝜈. Either classical linear 8-node elements (for 𝜈=0.2, 0.3 and 0.4) or hybrid linear 8-node elements (with both displacements and hydrostatic pressure as unknowns, for 𝜈=0.5) were used. A constant small angle torsion was applied with the same boundary conditions as in section 3.1. Figure 6 compares the Mises stress induced in 46x5x1 and 20x12x1 specimens with a Poisson's ratio of 0.5, after normalization by the value that would apply at the free surfaces of an infinitely long and wide specimen, namely 3𝐺 𝜃 𝑇/𝐿, where 𝜃 is the torsion angle. In each subfigure, one quarter of the specimen has been removed in order to show the stress distribution inside the specimen. It may be observed first that letting the vertical displacements free at the upper and lower sections does induce a field that is uniform along
the specimen length, which is in agreement with the Saint-Venant solution. In these cases, an edge effect can be observed at the ends of the transversal section, which extends over a length of the order of a few specimen thicknesses and is duly included in the Saint-Venant solution. Accordingly, the torques computed in the cases b and d shown in Figure 6 are in perfect agreement with Eq. (1) where 𝐺′ is replaced by 𝐺 and where 𝛿 = 0. Incidentally, the transversal cross sections shown in Figures 6b and 6d recall that a torsion test is basically non uniform, even in ideal conditions, since the stress varies linearly through the thickness for simple elastic behavior. More importantly, an additional edge effect is noticed in Figures 6a and 6c, which extends along the length of the specimen. Like for the transversal edge effect mentioned above, this effect extends over a length of the order of a few specimen widths. Consequently, the central transversal section of the specimen is barely affected by the longitudinal edge effect in Figure 6a, and the torque is computed as 1.057 times the Saint-Venant solution (recall that the latter ignores the longitudinal edge effect). In contrast, the longitudinal edge effect is dominant in the short specimen of Figure 6c, and the torque is computed as 1.490 times the Saint-Venant value. Consequently, Figure 6 illustrates the assumption made when the Saint-Venant solution is used to interpret a torsion test: approximating Figure 6a by Figure 6b (which is reasonable, case of a long specimen), or approximating Figure 6c by Figure 6d (which is very imprecise, case of a short specimen). Since commercial rheometers use the Saint-Venant solution, one understands easily why short wide samples are not recommended to measure the viscoelasticity of solid polymers experimentally. Nonetheless, one may be constrained and not able to choose the sample dimensions. This will result in a measured storage modulus 𝐺PQRST larger than the actual
storage modulus 𝐺#T. To provide a sensible correction, we have simulated the elastic torsions
of clamped specimen with various rectangular dimensions and Poisson’s ratio, and computed a correction coefficient 𝐾 𝐿/𝑇, 𝑊/𝑇, 𝜈 that relates the shear modulus resulting from the Saint-Venant analysis to the actual shear modulus by 𝐺XYZ = 𝐾. 𝐺#. Assuming that the
Poisson’s ratio is purely elastic at a given temperature, one may apply this coefficient to the measured viscoelastic storage modulus 𝐺PQRST and thus reach 𝐺#T.
3.3. Shape correction factor
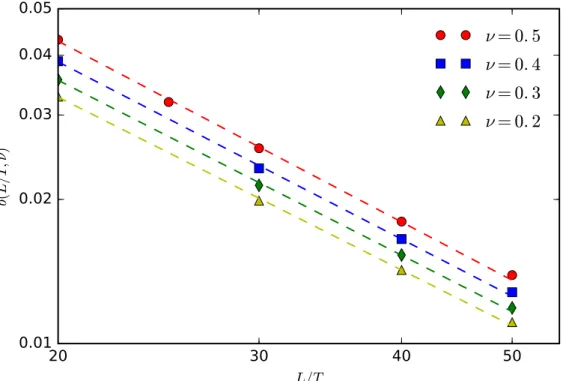
The sample thickness stands as the unit length. Since the simplified expression (Eq. (1)) of the Saint-Venant solution assumes that the sample width is at least three times its thickness, this value is chosen as the lower limit for 𝑊/𝑇. In order to cover the rectangular dimension recommended by rheometer constructors, the upper limit of 𝑊/𝑇 is set to 12. The prism length is larger than its width and ranges between 20 and 200 times its thickness. First, elastic torsions were simulated for 𝑊/𝑇 = 3. The ratio of the elastic shear modulus estimated by using the Saint-Venant solution over the actual material shear modulus is presented in Figure 7 with respect to the length over thickness ratio 𝐿/𝑇 . As can be seen, the results depend on the Poisson’s ratio. It may be noted that the correction coefficient 𝐾 = 𝐺XYZ/𝐺# is well
estimated by the following expression:
𝐾 𝐿/𝑇, 3, 𝜈 = 1 + 𝐴 𝜈 / 𝐿/𝑇 A.#55 (2)
The values of 𝐴 𝜈 used to plot the broken lines in Figure 7 are reported in Table 2.
Parameter 𝑊/𝑇 was then varied from 3 to 12 for various values of 𝜈 and 𝐿/𝑇. Figure 8 shows the values of 𝐺XYZ/𝐺# obtained when 𝜈 = 0.5. For each value of 𝐿/𝑇, the 𝐺XYZ/𝐺# ratio
Poisson’s ratio of 0.2, 0.3 and 0.4. Consequently, the correction coefficient 𝐾 can be written as 𝐾 𝐿/𝑇, 𝑊/𝑇, 𝜈 = 𝐾 𝐿/𝑇, 3, 𝜈 + 9: − 3 𝑏 𝐿/𝑇, 𝜈 (3) The parameter 𝑏 𝐿/𝑇, 𝜈 was determined by a mere linear regression in a log-log plot and its values are shown in Figure 9, where the broken lines are evaluations using the relation: 𝑏 𝐿/𝑇, 𝜈 = 𝐵 𝜈 / 𝐿/𝑇 a b (4)
with the values of parameters 𝐵 𝜈 and 𝐶 𝜈 listed in Table 2.
Finally, Eqs. (2), (3) and (4) define the expression of the correction coefficient needed when approximating the torsion of clamped rectangular prisms by the Saint-Venant solution: 𝐾 𝐿/𝑇, 𝑊/𝑇, 𝜈 = 1 + 𝐴 𝜈 / 𝐿/𝑇 A.#55+ 9 : − 3 𝐵 𝜈 / 𝐿/𝑇 a b (5) When this coefficient is used to divide the measured storage modulus to reach the actual material storage modulus, one recognizes its dependence on the Poisson’s ratio. While the Poisson’s ratio is known to be approximately 0.5 in the rubbery state, and is relatively easy to measure in the glassy state, it is more difficult to grasp at temperatures within the glass transition. Therefore, the correction proposed here might lead to moderate discrepancies; nonetheless it provides with a fast correction to an error that may reach several tens of percents, as one can see in Figure 8 for instance.
4. Conclusions
Experimental investigation and numerical finite element simulations were run in order to understand how to characterize the linear viscoelasticity of solid polymers in shear accurately when using the dynamic torsion of rectangular prismatic samples. It was shown that long temperature steps should be preferred to the usual linear heating ramp to avoid possible temperature heterogeneities that induce significant inaccuracies. Moreover, since commercial rheometers apply the Saint-Venant solution that does not account for the displacement constraints parallel to the torsion axis resulting from specimen clamping, it was shown that specific geometries have to be considered to access the storage modulus without correction. Actually, slender narrow specimens are to be preferred since they minimize edge effects that may be significant otherwise. When other geometries are to be used, a correction coefficient has been proposed that depends on the specimen geometry and on the material Poisson’s ratio. Dividing the measured storage modulus by this coefficient allows determination of the actual material storage modulus. References [1] A. B. de Saint-Venant, De la torsion des prismes avec des considérations sur leur flexion ainsi que sur l’équilibre des solides élastiques en général et des formules pratiques, Mémoires des Savants Etrangers, Paris, 1855. [2] C. Dessi, G.D. Tsibidis, D. Vlassopoulos, M. De Corato, M. Trofa, G. D’Avino, P.L. Maffettone, S. Coppola, Analysis of dynamic mechanical response in torsion, J. Rheol. 60 (2016) 275-287. [3] ISO 4664-2:2006(E) Rubber vulcanized or thermoplastic. Determination of dynamic properties. Part 2: Torsion pendulum methods at low frequencies (2006).
[4] A.E.H. Love, A Treatise on the Mathematical Theory of Elasticity, Cambridge University press, 4th ed. 1944.
mechanisms in amorphous polymers and other glass-forming liquids, J. Am. Chem. Soc. 77 (1955) 3701–370. [6] J. D. Ferry, Viscoelastic Properties of Polymers, Wiley, 3rd ed. 1980. [7] I. M. Ward, J. Sweeney, An Introduction to the Mechanical Properties of Solid Polymers, Wiley, 2nd ed. 2004. [8] Abaqus, 2016. Dassault Systèmes Simulia Corporation, Providence, RI, USA. Figure captions Fig. 1. Storage modulus and damping factor measured from torsion oscillations at 1 Hz and 0.1% strain during a linear temperature ramp at 1 °C/min for samples of LxWxT geometries.
Fig. 2. Storage modulus and damping factor measured at various equilibrated temperature
steps at 1 Hz and 0.1% strain for samples of LxWxT geometries.
Fig. 3. Comparison between the model linear viscoelasticity (solid lines) defined by the
parameters listed in Table 1 and the experimental behavior measured on the 46x5x1 mm3 sample during temperature steps.
Fig. 4. Viscoelastic behaviors obtained by applying the Saint-Venant solution (Eq. (1)) to the
results of finite element simulations where the displacements parallel to the torsion axis of the sample is either free (Saint-Venant) or prevented (46x5x1 specimen). Comparison with the model material used in the simulations (solid lines).
Fig. 5. Impact of the specimen dimensions (LxWxT) on the linear viscoelastic behavior
estimated from finite element simulations (Abaq.) of the torsion tests by using the Saint-Venant solution (Eq. (1)). Comparison to the experimental data (Exp.) measured for the same geometries.
Fig. 6. Maps of the Mises stress normalized by 3𝐺θ 𝑇/𝐿 in 46x5x1 (a and b) and 20x12x1 (c and d) elastic specimens. The torsion axis is vertical and the Poisson's ratio is 0.5. The vertical displacements in the upper and lower sections are either prevented (a and c) or let free (b and d). Fig. 7. Ratio of the shear moduli evaluated by applying the Saint-Venant solution over the actual material value for the elastic torsion of a clamped rectangular sample with 𝑊/𝑇 = 3.
Fig. 8. Ratio of the shear moduli evaluated by applying the Saint-Venant solution over the actual material value for the elastic torsion of a clamped rectangular sample according to the geometry parameters 𝑊/𝑇 and 𝐿/𝑇 for an elastic Poisson’s ratio of 0.5. Fig. 9. Values of parameter 𝑏 𝐿/𝑇, 𝜈 defined in Eq. (3) and calculated by linear regressions of the data displayed in Fig. 8. Table 1.
WLF parameters and generalized Maxwell model parameters leading to the curves shown in Figure 3.
WLF parameters 𝑇eQf = 64 °C 𝐶A = 17 𝐶g = 128 °C
𝐺Q=2.37 MPa
𝐺h (MPa) 𝜏h (s) 𝐺h (MPa) 𝜏h (s)
4.408E+01 1.259E-08 5.714E+01 3.435E-03
3.768E+01 2.354E-08 4.949E+01 6.422E-03
3.239E+01 4.401E-08 3.719E+01 1.201E-02
2.824E+01 8.230E-08 2.374E+01 2.245E-02
2.514E+01 1.539E-07 1.351E+01 4.198E-02
2.305E+01 2.877E-07 7.376E+00 7.850E-02
2.195E+01 5.380E-07 4.119E+00 1.468E-01
2.189E+01 1.006E-06 2.473E+00 2.744E-01
2.296E+01 1.881E-06 1.638E+00 5.132E-01
2.529E+01 3.517E-06 1.163E+00 9.595E-01
2.904E+01 6.576E-06 8.015E-01 1.794E+00
3.418E+01 1.230E-05 4.803E-01 3.355E+00
4.045E+01 2.299E-05 2.489E-01 6.272E+00
4.714E+01 4.299E-05 1.272E-01 1.173E+01
5.330E+01 8.038E-05 7.584E-02 2.193E+01
5.804E+01 1.503E-04 5.837E-02 4.100E+01
6.094E+01 2.810E-04 5.886E-02 7.667E+01
6.210E+01 5.254E-04 7.395E-02 1.434E+02
6.200E+01 9.824E-04 1.066E-01 2.680E+02
6.068E+01 1.837E-03 1.627E-01 5.012E+02
Table 2. Parameters of the correction coefficient given by Eq. (5). 𝜈 = 0.2 𝜈 = 0.3 𝜈 = 0.4 𝜈 = 0.5 𝐴 𝜈 1.127 1.204 1.300 1.412 𝐵 𝜈 1.189 1.346 1.542 1.817 𝐶 𝜈 1.200 1.213 1.230 1.250