Science Arts & Métiers (SAM)
is an open access repository that collects the work of Arts et Métiers Institute of Technology researchers and makes it freely available over the web where possible.
This is an author-deposited version published in: https://sam.ensam.eu
Handle ID: .http://hdl.handle.net/10985/12055
To cite this version :
Charlotte HESLOUIN, André STUMPF, Lionel POURCHERESSE, Véronique PERROT BERNARDET, Alain CORNIER, Nicolas PERRY - Effects of product usage scenarios on environmental performance for road transport refrigeration units - In: 4th IIR International Conference on Sustainability and the Cold Chain., Nouvelle-Zélande, 2016-04-07 - 4th IIR International Conference on Sustainability and the Cold Chain. Proceedings: Auckland, New Zealand, April 7-9, 2016. - 2016
EFFECTS OF PRODUCT USAGE SCENARIOS ON ENVIRONMENTAL
PERFORMANCE FOR ROAD TRANSPORT REFRIGERATION UNITS
C. Heslouin
(a,b,c)*, A. Stumpf
(a), L. Pourcheresse
(a), V. Perrot-Bernardet
(b),
A. Cornier
(b), N. Perry
(c)(a) *Carrier Transicold Industries
810 Route de Paris, 76520 Franqueville Saint Pierre, Fr +33 (0)4 79 26 26 90, charlotte.heslouin@carrier.utc.com
(b) Arts et Métiers Paristech, Institut de Chambéry, Savoie Technolac, BP 50295, F-73375 Le Bourget du Lac, Fr (c) Arts et Métiers ParisTech, I2M, UMR 5295, F-33400 Talence, Fr
ABSTRACT
A significant issue for the transport refrigeration industry is its high use of non-renewable energy for both motion and refrigeration. With the goal of reducing the environmental footprint, this study is focused on the Life Cycle Assessment (LCA) of Truck Refrigeration Units (TRU). Contrary to most studies about TRU, this study considers alternative impact categories, including energy consumption, refrigerant fluids and their associated impacts. The LCA reveals that the operation phase is a significant source of environmental impact, while the usage-scenario also has a high influence on the impact. The purpose of this paper is to demonstrate the weight of the transported product profile (frozen or fresh), type of transport (distribution or long haul) and the operating mode (continuous run, start/stop) on the environmental footprint of transport refrigeration. Finally, the LCA results highlight the necessity to consider the role of customer behavior on the environmental performance of transport refrigeration units.
Keywords: Refrigeration unit, Road transport, Life Cycle Assessment, Usage scenarios, Environmental impact, Energy consumption
1.
INTRODUCTION
Environmental performance of static refrigeration systems, such as refrigerators or cabinets, have already been studied but they are focused on the design and environmental impact of the production phase and not on the impact of customer behavior on the environmental performance of the use phase (Ciantar and Hadfield, 2000; Calm, 2002; Kruse et al., 2006; Watkins and Tassou, 2006; Mudgal et al., 2010; Ma et al., 2012). More efforts are needed for analyzing the use phase of refrigeration systems. In the field of Truck Refrigeration Units (TRU), the environmental issues are linked to the use of refrigerant and energy consumption to run the units (Barnabe and Bensafi, 2007; James and James, 2010). According to the Montreal Protocol, the ozone depletion potential of refrigerants is no longer an issue; however, the potential negative climate change impact of refrigerant leakage is still a concern. Barnabe et al., (2003) found that for air coolers and heat pumps, when the leak rate is under control, the energy consumption becomes the main environmental issue in terms of the GHG effect. The research focuses on understanding the environmental impact of TRUs depending on various conditions of use based on varying usage scenarios.
Most of the existing studies about the environmental impact of TRU use focus on the Life Cycle Climate Performance (LCCP) method and calculation references. The purpose of LCCP is to provide the potential climate change of a system in terms of GHG, from the refrigerant and the energy consumption. In the field of transport refrigeration, Nasuta et al. (2014) provides a tool based on this method. This tool calculates the energy consumption of the TRU depending on the use, the distribution profile, the commodity type and the weight of the unit. Its main limitations are that it is based only on CO2 equivalent emissions and energy
consumption (in MJ) and does not take into account the impact of all the inputs throughout the entire life cycle. Barnabe and Bensafi (2007) used Life Cycle Assessment (LCA) to evaluate a TRU. LCA is more comprehensive than LCCP, because it takes into account all of the input and output throughout the life cycle
NN-1570185019 of the product and evaluates the environmental performance based on more than one indicator. However, Barnabe and Bensafi (2007) are only evaluating three indicators: the global warming potential, the ozone depletion potential and the energy resource consumption. Neither of these studies (LCCP and LCA) analyzed the end-user’s behaviors or presented a detailed use phase hypothesis.
The relationship between product’s usage and environmental performance is rarely considered when using LCA. Generally, an average usage scenario is used and does not take into account the weight of the usage context on environmental performance which can be positive or negative. However, the effect of usage, and its modeling, has been recognized among LCA researchers and practitioners. Telenko and Seepersad (2014) proposed to model usage context by using Bayesian network models. In their model, usage context factors were human factors (who? skills or habits?), situational factors (where? when? for what task?) and product factors (design and specification influencing the use of product). Ma and Kim (2015) proposed a time usage model in which the lifespan of the product made a strong impact. Egede et al. (2015) analyzed the influence of internal and external factors such as vehicle characteristics, location of use and user influence.
For TRUs, it is difficult to determine the Environmental Impact (EI) of the use phase because it depends on several factors influencing the energy consumption. These factors are the following: trailer specification, size and packaging of product loaded, outside climate (temperature, hygrometry), operating mode (continuous run vs. start/stop), start/stop parameters, type of product (fresh or frozen), type of transport (urban distribution vs. long haul), speed of engine, coefficient of performance (COP) of the unit, refrigerant efficiency, etc. (Repice and Stumpf, 2007; Tassou et al, 2009; Barnitt et al, 2009; Cavalier and Stumpf, 2010; Fitzgerald et al, 2011; Wu et al, 2013).
A key influencing factor is the end-user behavior. End-users (truck drivers) influence the EI through unit settings (temperature, choice of operating mode) and the load/unload conditions (precooling or not, unit on while doors are opened, use of curtains, use of removable wall, etc.). The integration of end-user information can lead to developing highly innovative product (He et al., 2014).
In this study, the environmental performance of TRUs, depending on the scenario of use, is evaluated using LCA. LCA is a method and a tool used to quantify the environmental impact throughout the entire life cycle, from raw material extraction to end of life treatment. The environmental assessment (internal work made previously for this study) of the entire life cycle shows that the use phase has a significant environmental impact compared to other life cycle stages. These results are in accord with previous publications from Barnabe and Bensafi (2007), and James and James (2010). These findings reinforce the necessity to more clearly define and analyze the use phase. As a result this study focused only on the use phase of the TRU. The objective of this work is to understand how the internal and external factors of the use phase influence the environmental performance of the product. Three factors, which are known to influence the EI of the use phase, were selected: (1) the product profile (fresh or frozen); (2) the type of transport profile (distribution or long haul), as internal factors; and (3) the operating mode (continuous run or start/stop) as the external factor. This study proposed that end-user behavior has the ability to influence environmental impact.
2.
LIFE CYCLE ASSESSMENT
2.1 Presentation of TRU under study
In order to analyze the influence of the chosen factors on the EI of the use phase, a LCA is conducted on a trailer product with the specifications shown in Table 1.
2.2 LCA methodology
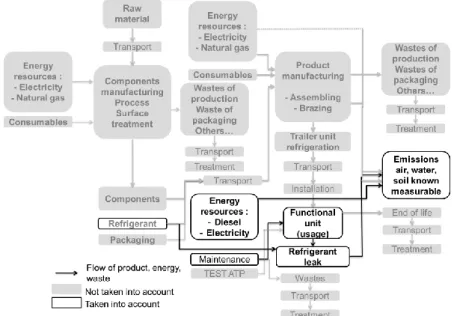
The LCA methodology is based on ISO 14040 (2006) and ISO 14044 (2006). Our study is focused on the use phase only. The scope of the study is presented in Figure 1.
The functional unit is described as “maintain the transported product at the suitable temperature for the 12 year lifetime of the equipment”. A lifetime of 12 years has been selected in accordance with the ATP rules. Since we want to know the influence of the aforementioned internal and external factors, there is no technical value (of use) in the functional unit. For the purposes of the LCA, we used the indicators and methods recommended by the ILCD method (JRC-IES, 2011). The chosen database is Ecoinvent V3.
Table 1: Specifications of TRU
Dimensions (mm) 2 227*2 050*430 Weight (kg) 704
Air flow (m3/h) 5 700 Kind of refrigerant R404A Refrigerant nominal load (kg) 5 Cooling capacity (W) Box
temperature
Capacity
Diesel high speed Diesel low speed Standby 0°C/30°C 14 995 11 830 13 200 -20°C/30°C 8 285 6 850 7 360
For clarity, we chose to focus on only six midpoint indicators: Climate Change (CC) [kg CO2 eq], Ozone
Depletion Potential (ODP) [kg CFC-11 eq], Acidification (AC) [molc H+ eq], Photochemical Ozone Formation (POF) [kg NMVOC eq], Particulate Matter Formation (PMF) [kg PM2,5 eq], and Non-Renewable
Energy (NRE) [MJ primary eq].
Figure 1: Scope of the LCA for the TRU
An initial study was done considering an average European usage scenario. Using that data, a sensitive analysis was conducted using two rates of leakage: 5% and 10%. The 5% rate corresponds to the annual average leak rate for the product under study. The 10% rate is an annual average leak rate between 8% and 20% as reported by UNEP (2015). Following the sensitive analysis, a detailed examination of the use phase was conducted considering three factors that influence the energy consumption with a leak rate of 5%. These three factors are as follows: (1) the transported product profile, (2) the type of transport profile and (3) the operating mode of use.
Transported product profile: The transported product profile is an internal factor. For this study, two
transported product profiles are considered, fresh and frozen products. Fresh products are transported at 0°C and frozen product at -20°C.
Type of transport profile: The type of transport is also an internal factor. In this study the two main types
of transport are:
- Distribution, which typically has multiple stops with very frequent door openings. - Long haul, which has long travel times without access to the cargo.
During long haul, the unit will run over long periods including during driver breaks. Very few door openings will occur. During distribution, there will be several door openings in short intervals, which enable hot air to get inside the trailer and create frost on the evaporator requiring defrosting, which consumes more energy. Frequent door openings can also alter the food quality (Ducoulombier et al., 2011). Both of the transport
NN-1570185019 types occur for a period of eight hours per day, 260 days per year, for 12 years. Eight hour per day was choose for both scenario to ensure the comparison of results. In real operation, long distribution is more often eighteen hours per day.
Operating mode: The operating mode is an external factor because the end-user makes the decision of
continuous run or start/stop. In continuous run the unit runs all the time to reach and maintain a precise temperature. In this mode the temperature and air flow are permanently maintained. This results in higher energy consumption. In start/stop mode, the unit will run until it reaches the pre-defined temperature, then it will turn off. An inadequate end-user choice, use of continuous run instead of start/stop when it is possible, can lead to overconsumption of energy.
Eight usage scenarios were studied (Table 2). They are defined based on the three influencing factors for which the energy consumption was previously determined. The energy consumption is directly linked to emissions.
Four of these scenarios are recommended by TRU manufacturers to maintain the cold chain without an overconsumption of energy. The product type influences the operating mode decision (start/stop or continuous run). For fresh product it is recommended to use the continuous run mode because precise temperature regulation is necessary to ensure the perishable products are not damaged (Fitzgerald et al., 2011). For frozen product it is recommended to use the start/stop mode because frozen products are less sensitive to slight temperature fluctuations (Tassou et al., 2009; IIR, 2003). The unit temperature setting is chosen by the end-user. An inadequate adjustment can result in energy overconsumption. For example, setting the temperature lower than the recommended transportation temperature (-25 ° C instead of -20 ° C) can lead to energy overconsumption.
For each scenario, the energy consumption (fuel consumption) varies according to the three factors. Energy consumption was measured at:
- 0°C/30°C (setpoint/external temperature) for fresh products and -20°C/30°C for frozen products - 84% of the time in partial load (start/stop or continuous run) and 16% at full capacity for long haul
transportation and 74% of the time in partial load (start/stop or continuous run) and 26% at full capacity for distribution. We choose the higher rate at full capacity for distribution because of the larger number of door opening.
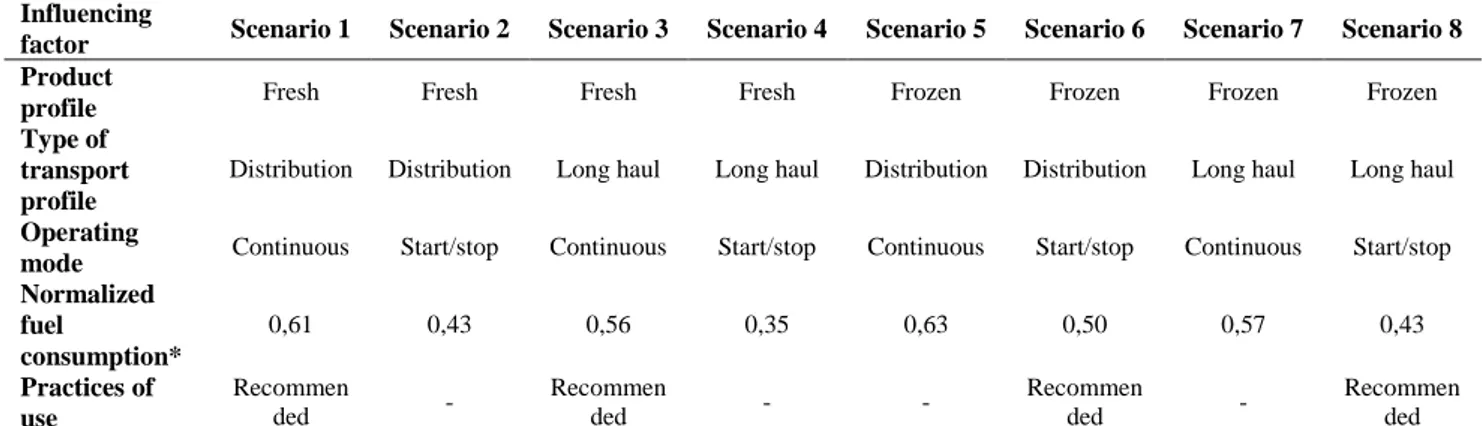
Table 2: Description of usage scenarios Influencing
factor Scenario 1 Scenario 2 Scenario 3 Scenario 4 Scenario 5 Scenario 6 Scenario 7 Scenario 8 Product
profile Fresh Fresh Fresh Fresh Frozen Frozen Frozen Frozen Type of
transport profile
Distribution Distribution Long haul Long haul Distribution Distribution Long haul Long haul
Operating
mode Continuous Start/stop Continuous Start/stop Continuous Start/stop Continuous Start/stop Normalized fuel consumption* 0,61 0,43 0,56 0,35 0,63 0,50 0,57 0,43 Practices of use Recommen ded - Recommen ded - - Recommen ded - Recommen ded *fuel consumption of TRU is expressed as a relative value depending on fuel consumption of TRU measured during ATP for max cooling at 0/30°C and equal to 1. Normalized fuel consumption = Measured (fuel consumption)/ATP (reference value for fuel consumption, worst case fuel consumption of the unit).
3.
RESULTS AND DISCUSSION
First results considered an average European usage scenario. The EI of the TRU’s use phase is due to the energy consumption (fuel consumption), the potential leakage of refrigerant, and the maintenance schedule (change of worn parts, liquid, etc.). These results show that the energy consumption and the potential leakage are the primary sources of EI in the use phase. The EI of the maintenance schedule is negligible. The
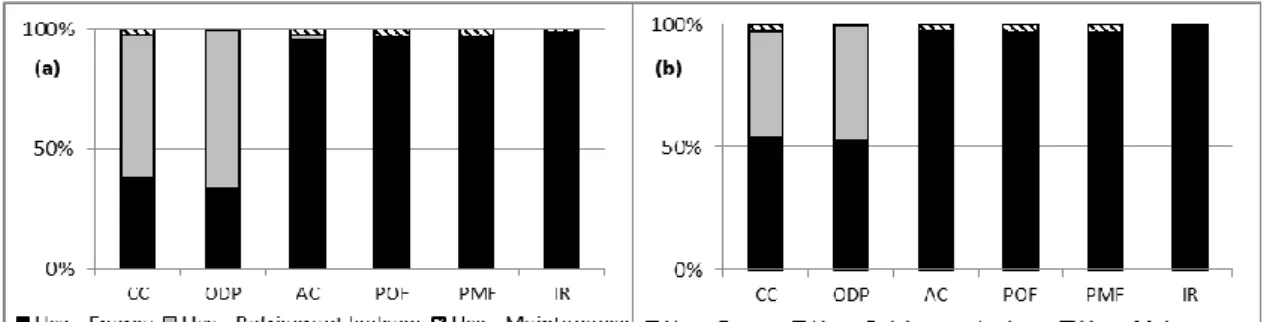
comparison between a refrigerant leakage rate of 10% and 5%, demonstrates that when the leakage rate is under control, the energy consumption becomes the primary source of EI in terms of climate change and ozone depletion potential (ODP) indicators, as shown in Figure 2. This is consistent with the conclusion of Barnabe et al. (2003). The refrigerant R404A has an ODP equal to zero, but its production for refill due to leakage, releases emissions which contribute to ozone depletion.
Figure 2: Environmental analysis of TRU, based on average usage scenario with leakage rate of 10% (a) and 5% (b). CC: Climate Change; ODP: Ozone Depletion Potential; AC: Acidification; POF: Photochemical Ozone Formation; PMF: Particulate Matter Formation; NRE: Non Renewable Energy.
Figure 3 shows the EI of the eight usage scenarios on the environmental indicators. The least impactful scenario is Scenario 4. For each indicator, results show the increase of impact compared to scenario 4.
Figure 3: Influence of usage scenario on the six environmental indicators. Y-axis is the percent of increase in comparison to the best scenario. (a) Climate Change; (b) Ozone Depletion Potential; (c) Acidification; (d) Photochemical Ozone Formation; (e) Particulate Matter Formation; (f) Non Renewable Energy.
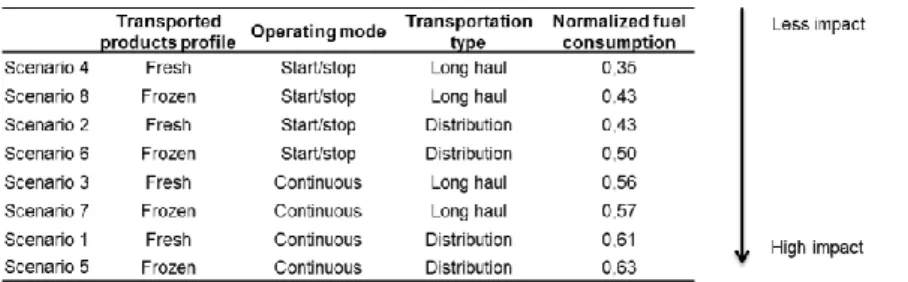
For all of the environmental indicators the scenario impact ranking is always the same, as can be seen in Table 3. The increase of EI on each indicator is directly related to energy consumption; however, the EI does not increase proportionately. The lowest EI is associated with scenario 4 (fresh product in long haul transportation operating in start/stop mode); however, this scenario is not recommended for sensitive fresh product. This scenario did not take into account the impact of the refrigeration on quality and sanitation of the transported product or any potential loss of product. As previously stated, fresh products are perishable and need more precise temperature control and a high airflow to maintain cold chain quality. Scenario 5 (frozen product in distribution transportation operating in continuous run mode) has the most negative EI; however, this scenario is not a recommended usage practice. As previously stated continuous run mode has a higher negative EI than start/stop mode and frozen product, regardless of distribution or long haul, can easily be transported in start/stop mode.
NN-1570185019
Table 3: Ranking of Scenarios based on EI
Generally, fresh products have less EI (1 to 20% based upon LCA results) than frozen products (value independent of the two others factors). The results clearly reveal that the TRU in continuous run operating mode has the most negative EI as compared to a TRU in the start/stop operating mode, regardless of the product or transport type (from 7 to 54% based upon LCA results). In continuous run, the compressor is usually turning on and the fans are at permanent flow rate. Long haul transportation is less impactful (3-20% based upon LCA results) than distribution transportation (values independent of the two others factors) primarily due to the frequency of door openings and the consequential effect of hot air entering the trailer. As a result, more cooling capacity is needed to recap the setpoint and the hot air creates frost on the evaporator requiring defrosting, which consumes more energy. These working conditions require more energy to reach the setting temperature. Our results are consistent with Repice and Stumpf (2007) who confirm that the distribution cycle will result in 16% higher fuel consumption (on average) than the long haul cycle. To refine the model of distribution mission, the chosen test parameters have to be expanded to include end-user practices as well as other external factors such as how long the doors are open, whether a curtain is used and load/unload conditions.
The results highlight the strong influence of the operating mode on environmental performance emphasizing the need to consider end-user behavior. They also support the need to consider other external factors dependent on the end-users’ decisions such as using electric mode instead of fuel while parking, not setting to recommended temperature (-25°C instead of -20°C for frozen product for example), precooling before loading, etc. Future studies should also consider other external factors that are independent of end-user behavior such as the climate and unit maintenance schedules.
In continuous operating mode, whether using distribution or long haul, fresh and frozen products have the same EI (difference of 1 to 3%, based upon LCA results, is not significant given the uncertainty of characterization model in LCA). However, in start/stop operating mode, the EI for frozen products is 4 to 20% (based upon LCA results) higher than the EI of fresh product. When considering the type of transported product (fresh vs. frozen), the operating mode selected for fresh products (EI of continuous run is 10 to 54%, based upon LCA results, higher than start/stop) influences EI more than the mode chosen for frozen product transport (EI of continuous run is 7 to 33%, based upon LCA results, higher than start/stop). However, it is recommended to use the continuous mode for fresh sensitive product in order to maintain the cold chain quality. The higher variation for fresh products is because it is more difficult to maintain cold temperatures for fresh products (0°C) than for frozen products (-20°C). Also the timing between the start and stop (when in partial load) is shorter for fresh products than for frozen products, which means that the TRU is running more often for fresh products than for frozen products. The benefit of the start/stop mode is connected to the inertia of the load and the body. The transported product profile and the transportation type have a strong influence on EI, especially when the start/stop operating mode is used. In continuous operating mode the difference is less or not enough significant to conclude when considering the uncertainty in LCA (less than 10%).
The end-user’s operation mode decision has a strong influence on EI, therefore, the end-user must be encouraged to only choose continuous operating mode when it is recommended to do so, normally with fresh product. There is a risk of damaging the transported product if start/stop is chosen for fresh product (Scenario 4) but there is also an overconsumption of energy if continuous run mode is chosen for frozen products (Scenario 5). Temperature consideration is required to avoid wrong practices based only on fuel consumption analysis.
CONCLUSIONS AND PERSPECTIVE
This research confirms that energy consumption is the foremost contributor to the EI of TRUs. It validates the influence of the following three factors on the EI of TRUs in use phase: (1) the product profile (fresh or frozen), (2) the type of transport profile (distribution or long haul), and (3) the operating mode (start/stop or continuous mode). The results show that the operating mode, in particular, is an important factor. The relationship between these influencing factors and energy consumption is clear; however, there is also a codependent relationship between the factors themselves. This study demonstrates that the best usage scenario in terms of EI is not the recommended usage to end-users. The analysis performed does not take into account the potential loss of transported product due to a non-optimal transportation setting (temperature setting, choice of operating mode). This research also highlights the need to study end-user behavior, such as door openings, temperature setting, operating mode decisions, etc., and how it influences EI. It further highlights the need to refine the modeling of the use phase to take into account complementary usage practices of end-users. Furthermore, while the design influences end-user usage, the end-user should also influence design. This research can guide future design changes to help end-users make energy efficient decisions.
NOMENCLATURE
AC Acidification ATP Agreement on the international carriage of perishable foodstuff and on the special equipment to be used for such carriage CC Climate Change EI Environmental impact
GHG GreenHouse Gases LCA Life Cycle Assessment LCCP Life Cycle Climate Performance NRE Non Renewable Energy ODP Ozone Depletion Potential PMF Particulate Matter Formation POF Photochemical Ozone Formation TRU Truck Refrigeration Unit
REFERENCES
Barnabe, F., Khalifa, K., Malek, A., 2003. Life-cycle analysis: first stage in the development of new eco-tools for air conditioning systems designers. International congress of refrigeration, Washington, D.C. Barnabe, F., Bensafi, A., 2007. LCA of a transport refrigeration unit and development of an HVAC&R equipment ecodesign tool. 22nd International congress of refrigeration, Beijing, China.
Barnitt, R.A., Chernich, D., Burnitzki, M., Oshinuga, A., Miyasato, M., Lucht, E., Van der Merwe, D., Schaberg, P., 2009. Emissions of transport refrigeration units with CARB Diesel, Gas-to-liquid diesel, and emissions control devices. 2009 SAE Powertrain, Fuels, and Lubricants Meeting, San Antonio, Texas. Calm, J.M., 2002. Emissions and environmental impacts from air-conditioning and refrigeration systems. International Journal of Refrigeration, 25, 293-305.
Cavalier, G., Stumpf, A., 2010. Measurement and simulation of energy consumption of transport refrigeration equipments. 1st Cold Chain conference, Cambridge.
Ciantar, C., Hadfield, M., 2000. An environmental evaluation of mechanical systems using environmentally acceptable refrigerants. Int. J. LCA., 5, (4), 209-220.
Ducoulombier, M., Sartre, V., Bonjour, J., 2011. Experimental investigation of the infiltration heat load during the opening of a refrigerate truck body. International Congress of Refrigeration, Prague.
NN-1570185019 Egede, P., Dettmer, T., Herrmann, C., Kara, S., 2015. Life cycle assessment of electric vehicles – A framework to consider influencing factors. Proceedings of the 22nd CIRP conference on life cycle engineering, 233-238.
Fitzgerald, W.B., Howitt, O., Smith, I.J., Hume, A., 2011. Energy use of integral refrigerated containers in maritime transportation. Energy Policy, 39, 1885-1896.
He, Y., Keung Lai, K., Sun, H. Chen, Y., 2014. The impact of supplier integration on customer integration and new product performance: the mediating role of manufacturing flexibility under trust theory. Int. J. Production Economics, 147, 260-270.
IIR (International Institute of Refrigeration), 2003. Refrigerated transport: progress achieved and challenges to be met. 16th Informatory note on refrigeration technologies, Paris, 3 pages.
ISO 14040, 2006. Environmental management – Life cycle assessment – Principles and framework. ISO 14044, 2006. Environmental management – Life cycle assessment – Requirements and guidelines. James, S.J., James, C., 2010. The food cold-chain and climate change. Food Research International, 43, 1944-1956.
Joint Research Center – Institute for Environment and Sustainability (JRC-IES), European Commission 2011. International Reference Life Cycle Data system (ILCD) Handbook – Recommendations for life cycle impact assessment in the European context. First edition. Publications office of the European union, Luxembourg. EUR 24571 EN.
Kruse, H., Jakobs, R., Riva, M., 2006. European Supermarket Refrigeration Systems Eco-efficiency considerations. International Refrigeration and Air Conditioning Conference. Paper 738, Purdue.
Ma, J., Yin, F., Liu, Z., Zhou, X., 2012. The eco-design and green manufacturing of a refrigerator. Procedia Environmental Sciences, 16, 7th International conference on waste management and technology, 522-529. Ma, J., Kim, H.M., 2015. Predictive usage mining for life cycle assessment. Transportation Research Part D, 38, 125-143.
Mudgal, S., Bain, J., Liput, M., 2010. Ecodesign of refrigeration products. Ist IIR Conference on Sustainability and the cold chain, Cambridge.
Nasuta, D., Srichai, R., Martin, C., 2014. Life cycle climate performance model for transport refrigeration/air conditioning systems. Proceedings of the 3rd IIR International Conference on Sustainability and the Cold Chain, London, England, 94-101.
Repice, C., Stumpf, A., 2007. Energy efficiency in transport refrigeration. 22nd International Congress of Refrigeration, Beijing, China.
Tassou, S.A., De-Lille, G., Ge, Y.T., 2009. Food transport refrigeration – Approaches to reduce energy consumption and environmental impacts of road transport. Applied Thermal Engineering, 29, 1467-1477. Telenko, C., Seepersad, C.C., 2014. Probabilistic graphical modeling of use stage energy consumption: a lightweight vehicle example. Journal of Mechanical Design, 136, 101403.
UNEP Ozone secretariat, 2015. Fact sheets on HFCs and low GWP alternatives. Fact sheet 6, transport refrigeration.
Watkins, R., Tassou, S.A., 2006. Life cycle analysis of the environmental impact of different cabinet designs. 13th world congress of food sciences technology.
Wu, X., Hu, S., Mo, S., 2013. Carbon footprint model for evaluating the global warming impact of food transport refrigeration systems. Journal of cleaner production, 54, 115-124.