Science Arts & Métiers (SAM)
is an open access repository that collects the work of Arts et Métiers Institute of Technology researchers and makes it freely available over the web where possible.
This is an author-deposited version published in: https://sam.ensam.eu
Handle ID: .http://hdl.handle.net/10985/15536
To cite this version :
Qiaorui SI, Qianglei CUI, Keyu ZHANG, Jianping YUAN, Gérard BOIS - Investigation on centrifugal pump performance degradation under air-water inlet two-phase flow conditions - La Houille Blanche n°3, p.41-48 - 2018
Any correspondence concerning this service should be sent to the repository Administrator : archiveouverte@ensam.eu
INVESTIGATION ON CENTRIFUGAL PUMP PERFORMANCE
1
DEGRADATION UNDER AIR-WATER INLET TWO-PHASE
2
FLOW CONDITIONS
3 4
Qiaorui SI (1), Qianglei CUI(3), Keyu ZHANG(2), Jianping YUAN(4), Gérard BOIS(5)*
5
(1) National Research Center of Pumps, Jiangsu University, Zhenjiang, China, 212013, e-mail: siqiaorui@163.com 6
(2) National Research Center of Pumps, Jiangsu University, Zhenjiang, China, 212013, e-mail: zhangky189@163.com 7
(3) National Research Center of Pumps, Jiangsu University, Zhenjiang, China, 212013, e-mail: 786485282@qq.com 8
(4)
National Research Center of Pumps, Jiangsu University, Zhenjiang, China, 212013, e-mail: yh@ujs.edu.cn
9
(5) LML, UMR CNRS 8107, Arts et Métiers ParisTech, Lille, France, 59000, e-mail: gerard.bois@ensam.eu 10
11
In order to study the flow characteristics of centrifugal pumps when transporting the gas-liquid mixture, water and air
12
were chosen as the working medium. Both numerical simulation and experimental tests were conducted on a centrifugal
13
pump under different conditions of inlet air volume fraction (IAVF). The calculation used URANS k-epsilon turbulence
14
model combined with the Euler-Euler inhomogeneous two-phase model. The air distribution and velocity streamline
15
inside the impeller were obtained to discuss the flow characteristics of the pump. The results shows that air
16
concentration is high at the inlet pressure side of the blade, where the vortex will exist, indicating that the gas
17
concentration have a great relationship with the vortex aggregation in the impeller passages. In the experimental
18
works, pump performance were measured at different IAVF and compared with numerical results. Contributions to the
19
centrifugal pump performance degradations were analyzed under different air-water inlet flow condition such as IAVF,
20
bubble size, inlet pressure. Results show that pump performance degradation is more pronounced for low flow rates
21
compared to high flow rates. Finally, pressure pulsation and vibration experiments of the pump model under different
22
IAVF were also conducted. Inlet and outlet transient pressure signals under four IAVF were investigated and pressure
23
pulsation frequency of the monitors is near the blade passing frequency at different IAVF, and when IAVF increased,
24
the lower frequency signal are more and more obvious. Vibration signals at five measuring points were also obtained
25
under different IAVF for various flow rates.
26
Key words:
27
Pump Performance, Two-Phase flow, Numerical-Experiment Comparisons, Vibration
28
Analyse de la dégradation des performances de pompes centrifuges en
29
présence de mélange diphasique air-eau en entrée de roue
30 31
Un mélange diphasique air-eau alimente une pompe centrifuge pour en étudier les modifications de performance par
32
rapport à de l’eau pure. Les analyses sont conduites à l’aide de simulations numériques et des expériences pour
33
différentes valeurs de fraction volumique du mélange en entrée de la pompe. La simulation numérique utilise une
34
approche instationnaire URANS avec le modèle de fermeture turbulente k-epsilon associé à une description Eulérienne
35
pour chaque fluide, l’ensemble étant traité comme un milieu inhomogène. La distribution locale des caractéristiques du
36
mélange ainsi que des lignes de courant à l’intérieur de la pompe et plus particulièrement de la roue sont utilisés pour
37
permettre une analyse locale détaillée en particulier de l’évolution de la fraction volumique. La concentration d’air est
38
importante à l’entrée de la roue et sur la face en pression des aubages dans les zones de forts gradients et les zones où
39
se concentrent les zones tourbillonnaires à l’intérieur des passages inter-aubes. Les analyses portent prennent
40
également en compte, outre différentes valeurs de la fraction volumique initiale, les variations du diamètre des bulles
41
d’air et celles du débit global traversant la pompe. Les modifications des performances globales de la pompe, mesurées
42
expérimentalement, sont plus importantes vers les bas débits. Elles sont confirmées, qualitativement et quantitativement
43
par l’approche numérique retenue. Les mesures complémentaires de fluctuations de pressions en entrée et en sortie de
44
pompe ainsi que des mesures de vibration sur le corps de pompe permettent une analyse en fréquence des signaux et
45
leur mise en relation avec les résultats numériques sur les caractéristiques locales des écoulements
46 47
Mots-clefs :
48
Pompe, Ecoulement diphasique, Comparaisons calculs-expériences, vibrations.
49
I INTRODUCTION
50
Two-phase gas-liquid flows often happened in air conditioning systems, refrigerating, cryogenic,
51
petroleum, nuclear power and also in sewage treatment. Centrifugal pumps play important roles in
52
all these fields. It is well known that pump head will decrease under two-phase mixture conditions
compared to single-phase one. The degree of head degradation depends on geometrical, physical
54
and thermal conditions (Gülich [2014]). For a given pump geometry and increasing value of void
55
gas fraction, the head can be totally lost, the consequence of which can result in huge system
56
instabilities and pump degradations.
57
Several authors like Murakami et al. [1974a], Minemura et al. [1985] have proposed prediction
58
methods for the two-phase flow performances on axial and centrifugal type of pumps in order to
59
evaluate existing experimental measurement results with some visualization technique as well. A
60
non-exhaustive list of important published works is proposed in Si et al. paper [2017]. All these
61
models can be considered to be valid for low values of volumetric void fraction (max. 6%-7%) and
62
so, far from surge operating conditions that correspond to a rapid performance decrease of the
63
pump, the rate of which depend on the initial water flow rate. Just before such severe conditions,
64
several investigations have detected the presence of stationary bubbles at impeller entrance channels
65
for high gas fractions, being responsible for performance degradation of the pump (Murakami and
66
Minemura [1974 b]; Patel and Rundstadler[1978]; Sekoguchi [1984]. Estevam[2003] and Barrios
67
and Prado [2009]. Numerical simulations using URANS approach have been also performed in
68
order to determine local phenomena more precisely in such flow conditions. All numerical results
69
have in common that they show significant deviations between predicted and experimental overall
70
results for the head drop especially for gas fraction values higher than 6%. Recently, Müller at al.
71
[2015], have performed numerical calculation using a mono dispersed phase distribution model, the
72
results of which are compared with experimental results obtained from Kosyna[2001]. The
73
comparison on impeller blade static pressure distributions showed that some improvement should
74
be done for high flow rate in order to get better fit between numerical and experimental results.
75
However, most of the centrifugal pump impeller geometries that have been studied are designed
76
using two dimensional blade sections and constant passage width along the radius from leading to
77
trailing edge. There is still a need of experimental results combined with numerical ones to explain
78
the dynamic characteristics of centrifugal pump under air-water two-phase flow working condition.
79
In the present paper, experimental and numerical comparisons results are presented on two- phase
80
flow performance in a centrifugal pump designed with three dimensional shrouded impeller shape.
81
Numerical results have been performed using inhomogeneous model (instead of usually
82
homogeneous model), for which each fluid possesses its own flow field and the fluids interact via
83
interphase transfer terms and compared with overall experimental ones. In addition, inlet and outlet
84
transient pressure and vibration signals under four IAVF are analyzed with frequency to investigate
85
the dynamic characteristics.
86
II PUMP GEOMETRY AND TEST RIG ARRANGEMEMENT
87
A commercial single stage, single-suction, horizontal-orientated centrifugal pump with specific
88
speed (Ωs= 65) was used for the investigation, whose casing is typically combined with a
spiral-89
volute. The design parameters and global pump geometry, given by the manufacturer, can be found
90
in Si et al. [2017]. The test rig is schematically shown on Figure 1. In this open loop, air injection
91
system is driven by a compressor. Air flowrate is measured by micro-electro mechanical systems
92
flow sensors, which could supply volume air flowrate value on standard conditions (25°, 93
101325Pa). Air-water flow is sucked by the pump, goes through the regulating valve and finally
94
arrives into the downstream tank. Air bubbles exhaust to external space in open tank and the left
95
pure water run to the upstream tank. Volume flowrate of pure water was measured by an
96
electromagnetic flowmeter set between upstream tank and the air supply device. Pump head and
97
global efficiency is also obtained following ISO 9906: 2012.
Pump Upstream Tank Mixer Compressor Gas-liquid flow Non-return valve Air flow meter
Gas-liquid flow
Flow meter
Regulating valve
Water flow meter Ball valve
Downstream Tank
Flexible connecting pipe
99
Figure 1: Test rig Figure 2: Sensor locations
100
It has to be noticed that the inlet pipe loop is in horizontal and part of the inlet tubing is
101
transparent in order to observe the inlet bubble distribution. This allows see a rough global view of
102
bubbles size. At this step, only air volume flow rate is measured, bubble diameter distribution
103
including bubble number per volume at pump inlet is not available. Measurements are performed
104
using the followed procedures: a constant void fraction is set by changing the throttle vane position
105
and consequently obtained the corresponding water flow rate. Inlet air volume flow rate was 106
transferred after knowing the pump inlet pressure value from the inlet static pressure sensor in order 107
to calculate the inlet air void fraction. Measurement uncertainties calculated by instrument precision
108
are 0.33m error on pump head and 2.4% on pump global efficiency. Figure 2 shows a general view
109
of sensor locations close to the pump environment.
110
III EXPERIMENTAL PUMP PERFORMANCE CHARACTERISTICS
111
The test loop condition were that 2m water high level inside the tank, air injection is performed
112
with the same inlet compressor pressure mainly 60kPa. Four injecting tubes around the inlet pipe
113
section inject air bubbles with the same direction of the water flow. The above loop setting could
114
ensure that no cavitation happened during the experiment process. The water flow rate is kept
115
constant, changing the air injecting flow rate and get inlet air void fraction values at 1%, 3%, 5%,
116
8%, 9% and 10%.
117
Figure 3a shows pump performance curves at different given void fraction values. It can be seen,
118
as already pointed out by several previous researchers, that pump performance starts to be
119
significantly lower when void fraction reaches 3% and more. The value of the head performance
120
degradation also depends on the water flow rate. A decrease of 20% of head compared with single phase
121
shut-off conditions is achieved for all water flow rates below nominal conditions for void fraction going up
122
to 7%. Lowest void fraction up to 10% can be achieved without pump surge for water flow rates around
123
32~40 m3/h. These values correspond to 0.7 up to 0.8 Q
d, compared to a manufacturer given operating pump
124
flow rate of 50.6m3/h. Other two phase flow experimental results are also plotted in Figure 3b, using
125
the theoretical head coefficient. All points are on a quite unique curve whatever the void fraction
126
value is. This result validates all semi-empirical and one dimensional model assumptions that have
127
been used for most existing approaches in the literature for such a pump geometry. As a
128
consequence, efficiency values (from Si et al [2017]) are always lower than efficiency for zero void
129
fraction, which is obviously normal due to increasing impeller passage losses when two-phase flow
130
conditions are existing. One can also observed that maximum efficiency locations are displaced
131
towards lower water flow rates when void fraction is increasing. This can be attributed to blockage
132
effects at impeller inlet section which may modify the incidence angle values.
IV NUMERICAL SIMULATION ANALYSIS
134
With the validated CFD model, values of blade forces, pressure heads, and inlet air void fraction
135
(IAVF) distributions inside the pump can be analysed. These values are very difficult and expensive
136
to be measured using experimental instrumentation. All of this could help us well understand inner
137
flow characteristics of centrifugal pump working under air-water two-phase flow condition.
138 0 0.1 0.2 0.3 0.4 0.5 0.6 0.7 0.8 0 0.02 0.04 0.06 0.08 0.1 0.12 0.14 ψ φ
IAVF=0 IAVF=1% IAVF=3% IAVF=5% IAVF=7% IAVF=8% IAVF=9% IAVF=10% 0 1 2 3 4 0 0.02 0.04 0.06 0.08 0.1 0.12 0.14 ψth φ IAVF=0 IAVF=1% IAVF=3% IAVF=5% IAVF=7% IAVF=8% IAVF=9% IAVF=10% 139
(a) Head coefficient (b) Theoretical head coefficient
140
Figure 3: Pump performance modification for different values of IAVF
141 142
IV.1 PUMP MODEL AND MESHES
143
The pump was divided into five component parts such as the inlet, impeller ring, chamber,
144
impeller and volute to build a model mesh for a complete pump. This process would allow each
145
mesh to be individually generated and tailored to the flow requirements in that particular
146
component. The influence of boundary conditions was investigated to discard any effect on the
147
numerical results, particularly on the inlet and outlet part. These last two parts are extended to
148
assure that the flow closed to inlet and outlet parts corresponds to a fully developed condition.The
149
grids for the computational domains were generated using ANSYS ICEM-CFD14.5 with blocking
150
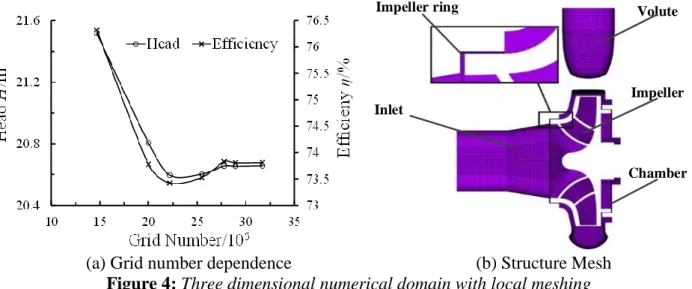
method. The independence of the solutions from the number of grid elements was proven by
151
simulating the flow field with different numbers of grid elements, as shown in Figure 4a. The
152
resulting pump model consisted of 2775915 elements was chosen for rotating and stationary
153
domains in total. Structured hexahedral cells were used to define the calculation domains, whose
154
detail are shown in Figure 4b.
155 Inlet Impeller ring Impeller Chamber Volute 156
(a) Grid number dependence (b) Structure Mesh
157
Figure 4: Three dimensional numerical domain with local meshing
158 159
IV.2 BOUNDARY CONDITION AND NUMERICAL MODELS
160
The professional CFD software ANSYS CFX14.5 was used for the simulation. Three
161
dimensional URANS equations were solved using the k-e turbulence model, with boundary
162
conditions of total pressure at the inlet and mixture mass flow rate at the outlet. Smooth wall
condition was used for the near-wall function. Inhomogeneous model also named the inter-fluid
164
transfer model was chosen to adapt the Eulerian-Eulerian multiphase flow. In this model each fluid
165
possesses its own flow field and the fluids interact via interphase transfer terms. Thus, this model
166
provides one solution field for each of the separate phases. Transported quantities interact via
167
interphase transfer terms. Furthermore, particle model is applied for the interphase transfer terms,
168
which is suitable for modeling dispersed multiphase flow problems such as the dispersion of air
169
bubbles in a liquid. Initial bubble diameter set as 0.1mm and 0.2mm.
170
The interface between the impeller and the casing is set to “transient rotor-stator” to capture the
171
transient rotor-stator interaction in the flow, because the relative position between the impeller and
172
the casing was changed for each time step with this kind of interface. The chosen time step (△t) for
173
the transient simulation is 1.718×10⁻⁴ s for nominal rotating speed, which corresponds to a changed
174
angle of 3°. Within each time step, 20 iterations were chosen and the iteration stops when the
175
maximum residual is less than 10-4. Ten impeller revolutions were conducted for each operational
176
condition in order to reach stable periodicity results for convergence criteria, and the last four
177
revolutions results were kept for analysis.
178
It is quite well known that unsteady calculation is mandatory for rotating machinery analysis when
179
looking at rotor-stator interaction problems instead of steady conditions. This is more evident when
180
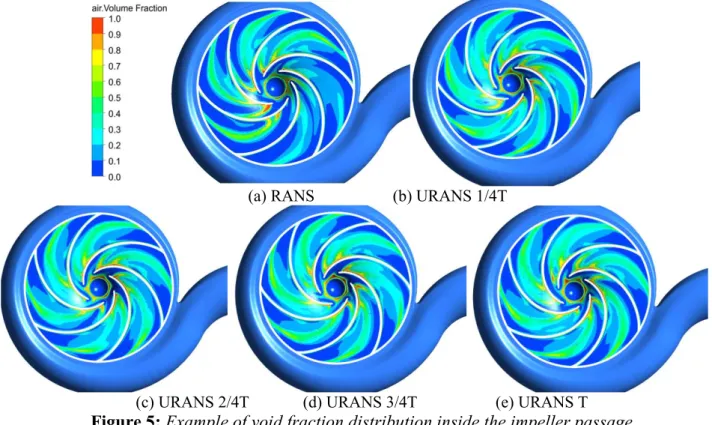
two-phase flows are investigated. As an example, figure 5 illustrates the big differences on air void
181
fraction distribution inside the impeller corresponding for both two approaches.
182
183
(a) RANS (b) URANS 1/4T
184
185
(c) URANS 2/4T (d) URANS 3/4T (e) URANS T
186
Figure 5: Example of void fraction distribution inside the impeller passage
187
IV.3 Numerical results
188
IV.3.1 Pump performance comparison between the simulation and experiment 189
Comparisons between simulation and experiment when pump works at pure water condition are
190
quite good as already shown in a previous publication done by the same research team (SI et al.
191
[2017]). This means that the calculated domain, meshes, boundary condition and numerical
192
turbulence models are suitable for further analysis. Performance curves of numerical simulation and
193
experiment with different IAVF are shown in Figure 6. Numerical results show that the calculation
194
is quite sensitive to initial bubble diameter value for small flow rates. Numerical results are quite
195
comparable up IAVF= 7% for the adapted bubble diameter. From experimental investigation, it
196
seems that pump performance is less sensitive to inlet bubble diameter values than numerical results.
This result also needs more investigation in order to explain it. The simulation results are believable
198
if the adequate initial bubble diameter is chosen.
199 0.2 0.3 0.4 0.5 0 1 2 3 4 5 6 7 8 ψ IAVF Experiment
CFD-initial bubble diameter as 0.1mm CFD-initial bubble diameter as 0.2mm
0.2 0.3 0.4 0.5 0.6 0 1 2 3 4 5 6 7 8 9 ψ IAVF Experiment
CFD-initial bubble diameter as 0.1mm CFD-initial bubble diameter as 0.2mm
200 (a) ψ=0.097 (b) ψ=0.077 201 0.2 0.3 0.4 0.5 0.6 0 1 2 3 4 5 6 7 8 ψ IAVF Experiment
CFD-initial bubble diameter as 0.1mm CFD-initial bubble diameter as 0.2mm
0.2 0.3 0.4 0.5 0.6 0 1 2 3 4 5 6 7 8 ψ IAVF Experiment
CFD-initial bubble diameter as 0.1mm CFD-initial bubble diameter as 0.2mm
202
(c) ψ=0.059 (d) ψ=0.039
203
Figure 6: Comparisons of head pump coefficient for different IAVF values
204
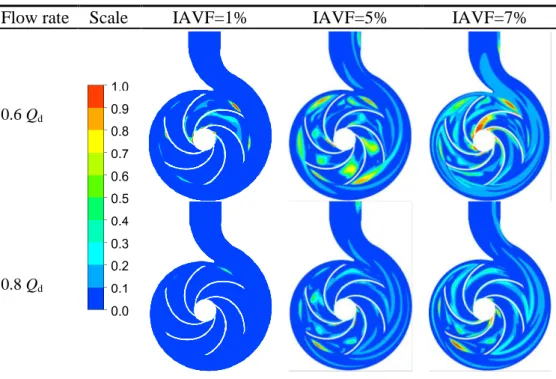
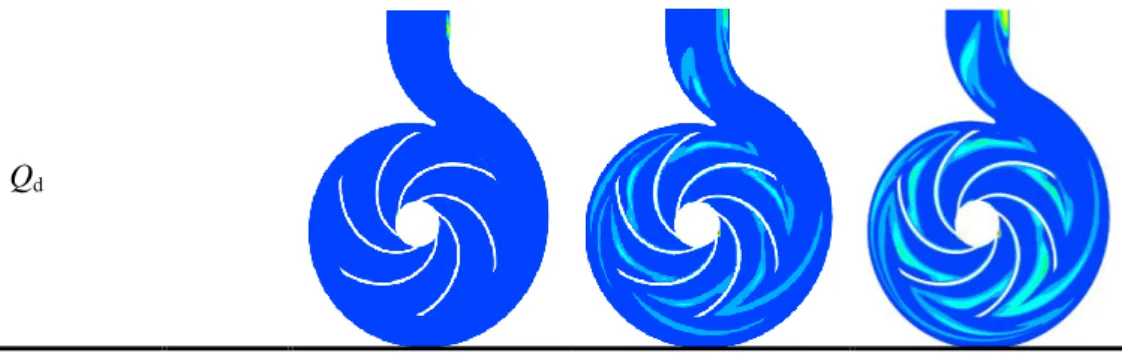
Table 1: Air distribution in middle section of the pump under different IAVF
205
Flow rate Scale IAVF=1% IAVF=5% IAVF=7%
0.6 Qd
Qd
IV.3.2 Flow analysis inside the impeller and volute 206
The transport air-water ability of the pump mainly depends on air and water distributions inside
207
the flow channel. Table 1 shows the local air void fraction distribution inside the impeller and
208
volute channel for three flow rate and for three IAVF values. It can be seen that air void fraction is
209
bigger inside the impeller than volute channel for all three flow rates and all three IAVF. Air
210
bubbles distribute on pressure side of the blade and are detained more and more inside the impeller
211
channel near “wake” area when IAVF increase. Bubbles take over 60% part of the channel when
212
IAVF increase to 7% in all three flowrates, which is probably the reason why pump performance
213
breaks down. The biggest value of air void fraction decrease as pump flowrate increase, which
214
means centrifugal pump are more sensitive to the air at small flow rates. Air bubbles are also
215
detected on blade pressure side from leading edge to the middle channel parts. Further
216
investigations from numerical results are needed in order to evaluate high loss locations due two
217
phase conditions and on impeller blade static pressure distribution as pointed out in the conclusions
218
of Müller’s paper [2015].
219
IV.3.3 Unsteady pressure evolution 220
Numerical unsteady pressure evolution results, corresponding to position p1-p6, are given on
221
figure 7a. Temporal pressure coefficient evolution results are obtained for a flow rate equivalent to
222
Q/Qd=0.8, as is shown in figure7b. The corresponding FFT chart is given on figure 7c. Comparative 223
FFT chart under 0.6Qd is given on figure 7d. One can detect that pressure fluctuations are stronger 224
when inlet void fraction increases with a maximum power value for 5% at blade passing frequency
225
value. Amplitude of the pressure cofficient always present bigger values if the monitoring points
226
near the volute tongue. FFT results of the pressure cofficient at the two flowrates show the same
227
variation law when IVAF increase. Smaller flowrate give more low frequency characteristic.
228
When looking at vibration results (which are presented in the next section), same kind of results
229
can be found. It is interesting to notice, as already pointed out in section IV.3.2 that this corresponds
230
to the fact that regions with high void fraction levels are not any more close to the impeller walls
231
but are pushed in the main flow when flow rate is decreasing and IAVF is close to 5% (see results
232
also from Table 1) .
233 -0.15 -0.12 -0.09 -0.06 -0.03 0 0.03 0.06 0.09 0.12 0 0.005 0.01 0.015 0.02 Cp t/s p1 p2 p3 p4 p5 p6 234
(a) Location of monitoring points (b) Temporal pressure coefficient evolution when IAVF=3%
236
(c) FFT results at p6 when 0.8Qd (d) FFT results at p6 when 0.6Qd
237
Figure 7: Unsteady pressure evolution of the monitoring points
238
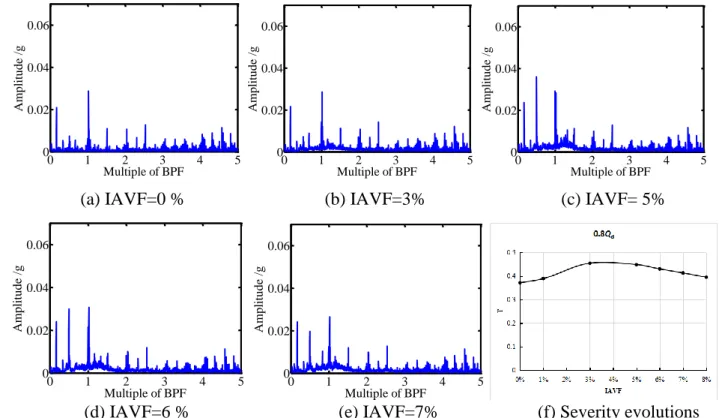
IV.3.4 Casing vibration experimental results 239
Part of vibration results, obtained by accelerometer X (radial position- see figure 2), are given using
240
FFT analysis for the same flow rate Q/Qd=0.8 and for several IAVF conditions. It can be seen, from 241
figures 8a to 8e, that maximum acceleration amplitude always occur at blade passing frequency (6
242
impeller blades). When IAVF increases, lower frequencies appear with growing amplitude
243
corresponding to one and three blades. The average value of acceleration severity (all frequencies
244
are taken into account) is given in figure 8f. It can be observed that maximum severity levels are
245
obtained for IAVF values close to 5-6% and then tend to decrease. It is believed that unsteady
246
experimental results agree, at least qualitatively, with what have been obtained with the chosen
247
numerical approach. This has also been experimentaly pointed out in the conclusion of Kosyna’s
248
paper [2001] using unsteady measurements performed on the rotating impeller close to outlet
249
radius. More deep analysis is in progress in order to extract more detailed informations in particular
250
for lower flow rates.
251 0 1 2 3 4 5 0 0.02 0.04 0.06 Multiple of BPF Ampl it ude / g 0 1 2 3 4 5 0 0.02 0.04 0.06 Multiple of BPF Ampl it ude / g 0 1 2 3 4 5 0 0.02 0.04 0.06 Multiple of BPF Ampl it ude / g 252
(a) IAVF=0 % (b) IAVF=3% (c) IAVF= 5%
253 0 1 2 3 4 5 0 0.02 0.04 0.06 Multiple of BPF Ampl it ude / g 0 1 2 3 4 5 0 0.02 0.04 0.06 Multiple of BPF Ampl it ude / g 254
(d) IAVF=6 % (e) IAVF=7% (f) Severity evolutions
255
Figure 8: FFT acceleration levels (X direction) for several IAVF values at Q/Qd=0.8
V CONCLUSIONS
257
Experimental overall pump performances and dynamic characteristics have been performed
258
under air-water two phase conditions for a centrifugal geometry. Local flow pattern inside the pump
259
have been also obtained using CFD tools in order to explain the performance degradation when
260
IAVF was increased. The main results are the following:
261
1. Pump performance degradation is more pronounced for low flow rates compared to high
262
flow rates. The starting point of severe pump degradation rate is related a specific flow
263
coefficient, which value corresponds to the change of the slope of the theoretical head curve.
264
2. Compared with existing experimental results for 2D impeller shapes, the present 3D
265
impeller pump geometry head degradation is quite small ( less than 1%) within IAVF values
266
below 5% between 0.75Qn and Qn. 267
3. Local numerical results inside the impeller and volute passages give some explanation about
268
this last point and describe the air-water flow pattern change just before the experimental
269
pump breakdown. Particle fluid model with interface transfer terms looks quite suitable to
270
evaluate pump performance degradation up to IAVF values of 7%.
271
4. Maximum experimental IAVF of 10% can be reached before pump breakdown only for
272
initial inlet flow conditions close to best efficiency ones. Numerical approach always fails
273
using high IAVF inlet conditions.
274
5. Pressure fluctuations are stronger when inlet void fraction increases with a maximum power
275
value for 5% at blade passing frequency value and small flowrate would be given more low
276
frequency characteristics. Maximum severity levels of vibration are obtained for IAVF
277
values close to 5-6% and then tend to decrease.
278
VI NOMENCLATURE
279
b: impeller blade width 280 u: circular velocity 281 R: radius 282 n: rotational speed 283 p: static pressure 284
Cp: local pressure coefficient 2
2 0.5 p p p C u 285 H: pump head 286
Q: volume water flow rate 287
t: time 288
α: local air void fraction 289
φ: flow coefficient φ=Q/(2π·R2·b2·u2)
290
ρ: density of mixed fluid water
1
air291
v: water cinematic viscosity 292
ω: angular velocity 293
η: global efficiency of the pump gQwaterH
P
294
ψ: head coefficient ψ=gH/(u2)2
295
ψt: theoretical head coefficient ψt= ψ/ η 296 Ωs: specific speed 0.5 0.75 ( ) Q s gH 297
Z: impeller blade number
298
BPF: blade passing frequency
299
d: design condition
300
IAVF: Inlet air void fraction air air water Q IAVF Q Q 301
T: vibration severity 2 1 1 N k k T X N
302 *: result from FFT 303 VII ACKNOWLEDGEMENTS 304The authors gratefully acknowledge the financial support by National Natural Science Foundation
305
of China (51509108), Natural Science Foundation of Jiangsu Province (BK20150516), China
306
Postdoctoral Science Foundation Funded Project (2015M581735, 2016T90422) and Senior Talent
307
Foundation of Jiangsu University (15JDG048).
308
VIII REFERENCES
309
Barrios, L., Prado, M. G. (2009). Modeling Two Phase Flow Inside an Electrical Submersible Pump Stage.
310
ASME 2009, International Conference on Ocean, Offshore and Arctic Engineering (Vol.133, pp.227-231).
311 312
Estevam, V., França, F.A., Alhanati, F.J.S., (2003), Mapping the Performance of Centrifugal Pumps under
313
Two- Phase Conditions, 17th International Congress of Mechanical Engineering, SaoPaulo.
314 315
Gülich, I. J. F. (2014). Design of the Hydraulic Components. Centrifugal Pumps. Springer Berlin Heidelberg.
316 317
Kosyna, G., Suryawijaya,P., Froedrichs,J., (2001), Improved Understanding of Two-Phase Flow Phenomena
318
Based on Unsteady Blade Pressure Measurements, Journal of Computational and Applied Mechanics, Vol. 2,
319
N1, pp. 45-52.
320 321
Minemura, K., Murakami,M., Katagiri,H., (1985). Characteristics of Centrifugal Pumps Handling Air-Water
322
Mixtures and Size of Air Bubbles in Pump Impellers, Bulletin of JSME, Vol. 28, N244, pp 2310- 2318.
323 324
Müller, T., (2015).Numerical 3D RANS Simulation of Gas-Liquid Flow in a Centrifugal Pump with an
325
Euler-Euler Two-Phase Model and a Dispersed Phase Distribution, 11thEuropean Conference on
326
Turbomachinery Fluid dynamics & Thermodynamics, ETC11, March 23-27, ETC2015-076, Madrid.
327 328
Murakami, M., Minemura, K., (1974a). Effects of Entrained Air on the Performance of a Centrifugal Pump.
329
Fisrt report- Performance and Flow Conditions, Bulletin of JSME, Vol. 17, N.110, pp 1047-1055.
330 331
Murakami, M., Minemura, K., (1974b). Effects of Entrained Air on the Performance of a Centrifugal Pump.
332
Second Report- Effect of Number of Blades, Bulletin of JSME, Vol.17, N.112, pp 1286-1295.
333 334
Patel,B.R., Rundstadler, P.W., (1978). Investigation into the Two-Phase Behaviour of Centrifugal Pumps,
335
ASME Symposium on Polyphase Flow in Turbomachinery- San Francisco-USA.
336 337
Sekoguchi, K., Takada, S., Kanemori, Y. (1984). Study of Air-Water Two-Phase Centrifugal Pump by
338
Means of Electric Resistivity Probe Technique for Void Fraction Measurement: 1st Report, Measurement of
339
Void Fraction Distribution in a Radial Flow Impeller. Bulletin of JSME, Vol.27, N.227, pp 931-938.
340 341
Si, Q., Bois, G., Zhang, K., Yuan, S., (2017). Air-Water Two-Phase Flow Experimental and Numerical
342
Analysis in a Centrifugal Pump. Proceedings of 12th European Conference on Turbomachinery Fluid
343
Dynamics and Thermodynamics, ETC 12, Stockholm, April 3-7th