UNIVERSITÉ DE MONTRÉAL
DEVELOPMENT OF A STRATEGY FOR ENERGY EFFICIENCY
IMPROVEMENT IN A KRAFT PROCESS BASED ON SYSTEMS
INTERACTIONS ANALYSIS
ENRIQUE MATEOS-ESPEJEL DÉPARTEMENT DE GÉNIE CHIMIQUE ÉCOLE POLYTECHNIQUE DE MONTRÉAL
THÈSE PRÉSENTÉE EN VUE DE L’OBTENTION DU DIPLÔME DE PHILOSOPHIAE DOCTOR (Ph. D.)
(GÉNIE CHIMIQUE) OCTOBRE 2009
UNIVERSITÉ DE MONTRÉAL
ÉCOLE POLYTECHNIQUE DE MONTRÉAL
Cette thèse intitulée:
DEVELOPMENT OF A STRATEGY FOR ENERGY EFFICIENCY IMPROVEMENT IN A KRAFT PROCESS BASED ON SYSTEMS INTERACTIONS ANALYSIS
présentée par: MATEOS-ESPEJEL Enrique
en vue de l’obtention du diplôme de: Philosophiae Doctor a été dûment acceptée par le jury d’examen constitué de:
M. JOLICOEUR Mario, Ph. D., président
M. PARIS Jean, Ph. D., membre et directeur de recherche
Mme SAVULESCU Luciana Elena, Ph. D., membre et codirectrice de recherche M. MARÉCHAL François, Ph.D., membre et codirecteur de recherche
M. PATIENCE Gregory-S., Ph. D., membre M. SCHMIDT John, Ph. D., membre
To my parents, my sister and my goddaughter Luciana
ACKNOWLEDGEMENTS
I would like to express my acknowledgments to my supervisor, Professor Jean Paris for his support and guidance during these four years, for all the suggestions and advices that have derived in the accomplishment of this thesis. You are an inspiration of hardwork and dedication.
I would like to thank my co-supervisors, Dr. Luciana Savulescu and Dr. François Marechal, for their support, their constructive critic to my work and their advices.
I would like to thank Dr Mariya Marinova for her support at the beginning of this project, and for all collaborations, advices and friendship that have come after
I would like to thank the Chemical Engineering Department of École Polytechnique
I would like to thank the Mexican National Council of Science of Technology for awarding me a scholarship.
I would like to thank my friends, Magdalena Brito, Lionel Mendez and Christian Rivera for their friendship, the great moments, the invaluable soccer talk, and for sharing this unforgettable time in Montreal.
I would like to thank all students that have been part of our research group during these years, especially to Bahador Bakhtiari, Adriana Cakembergh and Roberto Pinto.
Finally I would like to thank my parents and my sister for all the love, support, trust, and guidance that I have received during my time abroad. I am also grateful to my uncles and cousins, for all their support and for never forgetting about me.
RÉSUMÉ
L’objectif de ce projet de recherche est de développer, valider et appliquer une méthodologie unifiée qui considère les interactions des systèmes qui affectent la performance énergétique du procédé Kraft et permet d’en améliorer l’efficacité. Le développement d’une stratégie d’implantation des mesures d’économie d’énergie est le résultat final. L’usine qui fait l’objet de cette étude et située dans l’est du Canada et produit environ 700 adt/d de pâte kraft blanchie. L’industrie des pâtes et papiers est une des principales industries canadiennes ainsi qu’un des plus gros consommateurs d’eau et de d’énergie du secteur industriel. La hausse des coûts énergétiques et les réglementations environnementales ont amené l’industrie à réorienter ses efforts pour développer des programmes de conservation d’eau et d’énergie. Ces deux éléments sont généralement analysés séparément, cependant ils sont fortement interdépendants. Par conséquent, une méthodologie qui considère l’eau, l’énergie ainsi que la production et l’utilisation d’utilitaires est nécessaire.
La méthodologie développée comprend quatre étapes successives. La première est la définition et la caractérisation du procédé, car la mise à disposition d’un modèle de simulation fiable et représentatif est essentielle à l’optimisation énergétique. Une procédure qui inclut quatre volets est proposée: la collecte de données, la construction du diagramme de procédé, l’analyse des systèmes utilitaires, et le développement de la simulation. Les systèmes d’eau et d’énergie sont les axes principaux de la simulation. La deuxième étape de la méthodologie est l’évaluation de l’efficacité énergétique actuelle. Le but est d’identifier les inefficacités du procédé et d’établir des directives pour le développent des mesures d’amélioration. L’efficacité du procédé est évaluée par comparaison avec la pratique industrielle et l’application de nouveaux indicateurs énergétiques et éxergétiques. Les besoins minimums d’énergie et d’eau du procédé sont aussi déterminés lors de cette étape. La troisième étape, qui comprend la définition des mesures d’économie d’énergie techniquement faisables, est le noyau de la méthodologie. Plusieurs techniques sont appliquées dans une procédure itérative pour mettre en évidence les synergies existantes. L’objectif est d’améliorer le procédé en maximisant les économies d’énergie et en minimisant l’investissement requis. La quatrième étape est l’implantation de la stratégie. Puisque
les configurations et les conditions opératoires varient d’un procédé à l’autre, il est important de développer une stratégie d’implantation des mesures d’économie, générale et avantageuse pour différents cas. Pour le cas de base considéré, une stratégie qui correspond au plan de gestion de l’usine est choisie, elle comprend trois phases: l’élimination du combustible fossile, la production de puissance et la libération de vapeur. Une analyse comparative subséquente est réalisée afin de quantifier l’amélioration de l’efficacité du procédé suite à l’implantation des mesures d’économie d’énergie. Les indicateurs de performance sont recalculés.
L’amélioration de l’efficacité du procédé grâce à l’application de la méthodologie unifiée permet d’économiser plus d’énergie par rapport aux techniques typiques appliquées individuellement. L’implantation des mesures proposées permet à l’usine d’économiser 5.6 GJ/adt (27% des besoins actuels) de vapeur, 32 m3/adt (34% des besoins actuels) d’eau, ainsi que de générer 44.5 MW d’électricité.
Le résultat de l’application de la méthodologie unifiée est un procédé vert qui n’utilise pas de combustible fossile, consomme moins d’eau et de vapeur que la moyenne canadienne, et produit de l’électricité à partir de la biomasse.
ABSTRACT
The objective of this thesis is to develop, validate, and apply a unified methodology for the energy efficiency improvement of a Kraft process that addresses globally the interactions of the various process systems that affect its energy performance. An implementation strategy is the final result. An operating Kraft pulping mill situated in Eastern Canada with a production of 700 adt/d of high-grade bleached pulp was the case study.
The Pulp and Paper industry is Canada’s premier industry. It is characterized by large thermal energy and water consumption. Rising energy costs and more stringent environmental regulations have led the industry to refocus its efforts toward identifying ways to improve energy and water conservation. Energy and water aspects are usually analyzed independently, but in reality they are strongly interconnected. Therefore, there is a need for an integrated methodology, which considers energy and water aspects, as well as the optimal utilization and production of the utilities.
The methodology consists of four successive stages. The first stage is the base case definition. The development of a focused, reliable and representative model of an operating process is a prerequisite to the optimization and fine tuning of its energy performance. A four-pronged procedure has been developed: data gathering, master diagram, utilities systems analysis, and simulation. The computer simulation has been focused on the energy and water systems. The second stage corresponds to the benchmarking analysis. The benchmarking of the base case has the objectives of identifying the process inefficiencies and to establish guidelines for the development of effective enhancement measures. The studied process is evaluated by a comparison of its efficiency to the current practice of the industry and by the application of new energy and exergy content indicators. The minimum energy and water requirements of the process are also determined in this step. The third stage is the core of the methodology; it represents the formulation of technically feasible energy enhancing options. Several techniques are applied in an iterative procedure to cast light on their synergies and counter-actions. The objective is to develop a path for improving the process so as to maximize steam savings while minimizing the investment required. The fourth stage is the implementation strategy. As the
existing process configuration and operating conditions vary from process to process it is important to develop a strategy for the implementation of energy enhancement programs in the most advantageous way for each case. A three-phase strategy was selected for the specific case study in the context of its management strategic plan: the elimination of fossil fuel, the production of power and the liberation of steam capacity. A post-benchmarking analysis is done to quantify the improvement of the energy efficiency. The performance indicators are computed after all energy enhancing measures have been implemented.
The improvement of the process by applying the unified methodology results in substantially more steam savings than by applying individually the typical techniques that it comprises: energy savings of 5.6 GJ/adt (27% of the current requirement), water savings of 32 m3/adt (34% of the current requirement) and an electricity production potential of 44.5MW.
As a result of applying the unified methodology the process becomes eco-friendly as it does not require fossil fuel for producing steam; its water and steam consumptions are below the Canadian average and it produces large revenues from the production of green electricity.
CONDENSÉ EN FRANÇAIS
L’efficacité énergétique est d’une importance primordiale pour les industries chimiques énergétiquement intensives qui continuent d’utiliser des combustibles fossiles. La mondialisation des marchés a provoqué une course à la réduction des coûts de production, y compris ceux liés à l’énergie. La mise en œuvre de programmes de réduction d’énergie est essentielle pour que les industries manufacturières dans les pays industrialisés restent compétitives. Par conséquent, une grande variété de méthodologies et de technologies ont été développées. Ces méthodologies utilisent des techniques spécifiques qui sont destinées à améliorer une section du procédé mais qui ne considèrent pas les interactions existantes entre les systèmes utilitaires d’eau et de vapeur et les opérations unitaires. De plus, la façon dont le procédé est évalué n’est pas toujours complète et correcte. Pour cette raison, il est essentiel de proposer une méthodologie qui permettrait d’évaluer le procédé global et d’identifier des mesures d’économie d’énergie en considérant les interactions entre les systèmes utilitaires et le procédé.
L’industrie des pâtes et papiers est un des plus gros consommateurs d’énergie du secteur industriel au Canada, et représente 25% de la consommation d’énergie annuelle au niveau national. Bien que beaucoup d’efforts aient été déployés pour identifier les possibilités de réduire les coûts d’énergie en améliorant l’efficacité énergétique de ces usines, le potentiel de réduction reste encore important. Les usines canadiennes de pâte kraft comblent par elles mêmes environ 60% de leurs besoins en énergie mais peuvent encore augmenter ce pourcentage, la recherche et la mise en œuvre des technologies à haut rendement énergétique devraient permettre de concevoir et exploiter une usine entièrement autosuffisante
L’usine objet de cette étude produit environ 700 adt/d de pâte kraft blanchie. Les copeaux de bois sont d’abord soumis à une action chimique dans des lessiveurs où la lignine, l’agent liant les fibres de cellulose, est dégradée et solubilisée. La décharge des lessiveurs est ensuite évacuée dans des réservoirs de dépression. Un système de lavage sépare les fibres de la liqueur résiduaire de cuisson (liqueur noire) qui contient les sous-produits de la cuisson et les matières organiques dissoutes. La pâte lavée est blanchie au ClO2, séchée, découpée en feuilles et vendue. La liqueur
d’évaporateurs à effets multiples et est ensuite envoyée à la chaudière de récupération où les matières organiques sont brûlées pour la production de vapeur, et où les produits chimiques oxydés sont réduits et récupérés sous forme d’un salin qui est recaustifié avec de la chaux vive. Les produits chimiques ainsi régénérés sont retournés aux lessiveurs. Dans le procédé Kraft une forte interaction entre les systèmes utilitaires d’eau et de vapeur existe.
Dans le cadre de ce travail, une méthodologie d’amélioration de l’efficacité énergétique d’un procédé chimique a été développée, ses objectifs principaux étant :
- La définition correcte et l’évaluation du cas de base et
- L’amélioration énergétique du procédé en combinant plusieurs techniques d’analyse, les interactions entre les systèmes utilitaires et le procédé, et les contraintes économiques et techniques.
La méthodologie comprend quatre étapes successives : - La définition et la caractérisation du procédé; - L’évaluation de son efficacité énergétique actuelle;
- L’analyse de toutes les interactions des systèmes du procédé; - La stratégie d’implantation des mesures d’amélioration identifiées.
La première étape, souvent négligée, est le développement détaillé des systèmes utilitaires, du diagramme de procédé et des bilans d’eau et d’énergie. Le développement d’une simulation représentative du procédé global est fondamental pour une étude énergétique. La simulation est la source principale de données et un outil permettant d’évaluer l’impact des changements proposés sur la configuration du procédé.
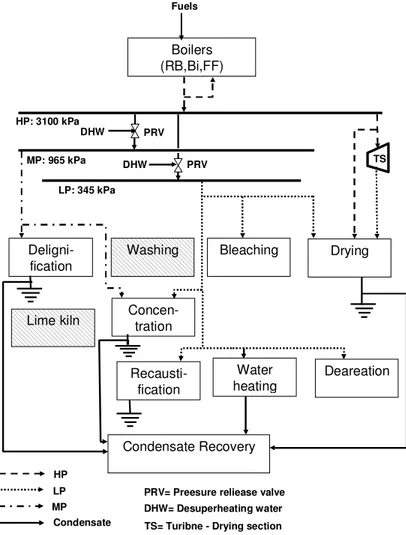
Pour satisfaire les besoins en vapeur de l’usine considérée, deux chaudières de récupération, une chaudière à biomasse et une chaudière à mazout produisent de la vapeur à haute pression. Une partie de la vapeur à haute pression est directement utilisée et le reste est dépressurisé, dans des
vannes de détente, à deux niveaux inférieurs, la moyenne pression et la basse pression. Une turbine activée par de la vapeur à haute pression entraine les équipements de séchage et mise en feuille. Les chaudières de récupération produisent 65% de la demande moyenne annuelle de vapeur de l’usine, la chaudière à biomasse produit 25% et le restant (10%) est produit par la chaudière à mazout. La chaudière à biomasse consomme des déchets de bois provenant de scieries régionales. La consommation totale de vapeur de l’usine est de 21.1 GJ/adt. Une petite quantité de vapeur est exportée à une scierie avoisinante.
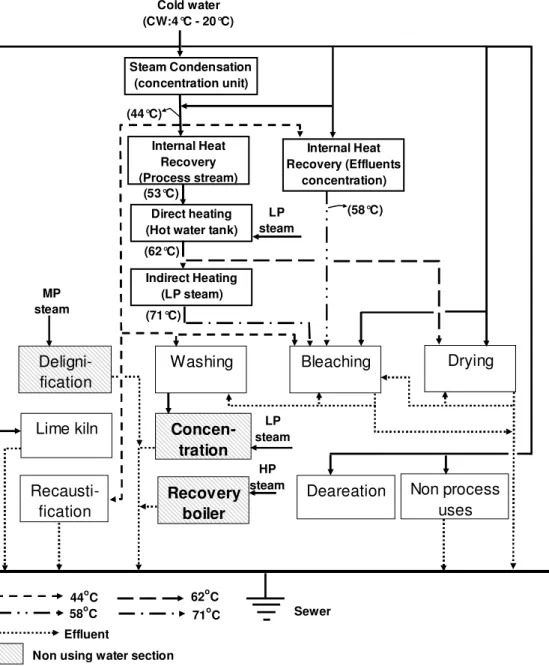
L’usine utilise de l’eau à cinq niveaux de température: froide (4°C en hiver, 20°C en été), tiède (44°C) et chaude (58, 62 et 71°C). L’eau tiède est générée dans les condenseurs de la section de concentration de la liqueur noire. L’eau chaude à 58°C est produite par échange indirect de chaleur avec les effluents de la section de concentration. Le reste de l’eau chaude est obtenue comme suit : la température de l’eau tiède est portée à 53°C par récupération interne de chaleur, et ensuite à 62°C par injection directe de vapeur. Une partie de l’eau à 62°C est utilisée, et le reste est chauffé à 71°C par échange indirect de chaleur avec de la vapeur. La consommation totale d’eau dans le procédé est de 110 m3/adt.
La seconde étape de la méthodologie comprend l’évaluation du procédé par comparaison de divers indicateurs avec la pratique industrielle. Toutefois, les résultats obtenus grâce à cette méthode ne fournissent pas suffisamment d’information sur les moyens d’améliorer le procédé. Par conséquent, une nouvelle procédure a été développée. Elle considère de nouveaux indicateurs basés sur le contenu énergétique et éxergétique des effluents et des gaz de fumée, l’éxergie requise par le procédé et fournie par le système utilitaire et, la réutilisation d’eau. Les analyses de pincement thermique et d’eau sont utilisées pour déterminer la quantité maximale et théorétique ment possible de récupération interne de chaleur et d’eau.
Le contenu énergétique des effluents et des gaz de fumée est un indicateur d’utilisation excessive de vapeur. Plus d’énergie est rejetée avec ces flux de chaleur, plus de vapeur est requise par le procédé. Par ailleurs, la production d’effluents est un indicateur d’utilisation excessive d’eau. Tous les procédés chimiques respectent la loi de conservation d’énergie. Mais, cette loi ne tient pas compte de la dégradation d’énergie dans un procédé irréversible. L’éxergie est un indice de la
qualité et de la quantité d’énergie impliquée dans des transformations qui ont lieu dans le système et des échanges à travers ses frontières. Par conséquent, l’éxergie peut également être utilisée comme un indicateur de l’efficacité d’un procédé.
La consommation du vapeur de l’usine considérée est supérieure à la moyenne canadienne qui est de 18.5 GJ/adt. Le déficit thermique net soit la différence entre la vapeur produite par les chaudières de récupération et la vapeur consommée par le procédé est de 8.1 GJ/adt, une valeur bien au-dessus de la moyenne canadienne dont la valeur est 2.4 GJ/adt. La consommation totale d’eau est aussi supérieure à la moyenne qui est de 75 GJ/adt. Environ 60% de l’éxergie fournie par les combustibles est détruite ce qui indique un potentiel important de conversion d’énergie qui est actuellement perdu. L’optimisation des niveaux de pression de vapeur, l’amélioration de l’efficacité des chaudières et l’implantation de turbines peuvent égalent réduire la quantité d’éxergie détruite.
Dans le cas du procédé étudié, le besoin minimum de chauffage est de 123 MW, le besoin minimum de refroidissement est de 10 MW et le point de pincement est situé à 71°C. Un intervalle de température minimal entre les courbes composites de 10°C est utilisé. La quantité maximale de récupération interne de chaleur est de 192 MW. Le besoin minimum d’eau fraîche est de 1000 m3/h, la production minimale d’effluents est de 875 m3/h et le pincement est situé à 0 ppm de solides dissous. Le potentiel maximal de réutilisation d’eau est de 1360 m3/h.
La troisième étape de la méthodologie proposée comprend l’analyse des interactions entre les systèmes du procédé. Plusieurs outils destinés à améliorer l’efficacité énergétique d’un procédé chimique sont disponibles, la récupération interne de chaleur et la réutilisation d’eau sont parmi les plus utilisés. Toutefois, ces outils ne considèrent pas les fortes interactions qui existent entre l’eau et l’énergie. Pour cette raison, les résultats obtenus par une analyse peuvent limiter les options générées par l’autre. Pour maximiser les économies dans un contexte global, les deux analyses doivent être appliquées ensemble et de manière itérative. De plus, d’autres outils comme l’élimination de points de mélange non isothermiques, la récupération des condensats, et l’augmentation de température des effluents doivent être considérés.
L’amélioration de la récupération interne de chaleur nécessite l’implantation d’un réseau d’échangeurs de chaleur, dont la configuration dépend du degré de réutilisation d’eau et de la présence des points de mélanges non isothermiques. Les mesures de réutilisation d’eau économisent de l’eau et de la vapeur, quant à l’élimination des points de mélanges non isothermiques, elle peut se faire par modification de la configuration des mélanges ou pour récupération interne de chaleur. L’élimination des points de mélanges non isothermiques doit être faite après l’implantation des mesures de réutilisation d’eau. L’augmentation de la température des sources de chaleur est atteinte après la maximisation de la récupération interne de chaleur. Par contre, la conception du réseau d’échangeurs de chaleur peut être modifiée pour créer des opportunités d’intégration d’une pompe à chaleur. L’augmentation de la récupération des condensats doit être basée sur un procédé où toutes les économies de vapeur possibles par d’autres méthodes ont déjà été identifiées. L’implantation des technologies de conversion d’énergie, telles que les turbines doit être réalisée après que les économies de vapeur ont été maximisées tout en ciblant un potentiel d’augmentation de la production de puissance. Les indicateurs de contenu énergétique, la réduction de la demande en vapeur et la surface du réseau d’échangeurs de chaleur sont utilisés pour évaluer le degré des interactions possibles.
Étant donné que la configuration du procédé et les conditions opératoires varient d’une usine à l’autre, il est important de développer une stratégie d’implantation de programmes d’efficacité énergétique de façon qu’elle puisse servir à plusieurs usines. L’ordre optimal d’implantation peut être différent de l’ordre dans lequel les interactions des systèmes ont été analysées, car les facteurs économiques sont prédominants lors de la formulation de cette stratégie.
La stratégie proposée sera implantée de manière graduelle. La première phase comprend l’élimination de la production de vapeur par combustible fossile et les mesures correspondantes sont la récupération des condensats, la réutilisation des effluents et la récupération interne de chaleur. Cette phase s’avère très attrayante à cause du coût élevé des combustibles fossiles. L’objectif de la deuxième phase est de réduire d’avantage la consommation de vapeur pour augmenter le potentiel de génération de puissance. Les mesures proposées dans cette phase semblent moins attrayantes du point de vue économique parce que la réduction de la consommation de vapeur est calculée par rapport aux économies de vapeur à bas coût, générée à
partir de biomasse. Toutefois, elles sont essentielles pour augmenter les profits grâce à la vente d’électricité. La troisième phase consiste en l’implantation de pompes à chaleur à absorption et des turbines pour la cogéneration. Ces deux technologies peuvent être combinées de façon que la vapeur sortant de la turbine devienne la force motrice de la pompe à chaleur. Cet arrangement, connu comme tri-génération, est avantageux pour la production de puissance et pour la réduction simultanée de la consommation d’utilités de chauffage et de refroidissement.
L’implantation des mesures proposées permet à l’usine d’économiser 46.1 MW (5.6 GJ/adt) de vapeur, ce qui abaisse la consommation totale à 15.4 GJ/adt, bien au-dessous de la moyenne canadienne pour un usine de pâte Kraft (18.5GJ/adt). Le déficit net thermique diminue de 8.1GJ/adt à 2.5 GJ/adt, ce qui contribue à réduire la dépendance de l’usine vis-à-vis des combustibles achetés. L’économie d’eau est de 1080 m3/h (37.02 m3/adt) et sa consommation dans le procédé est de 73.1 m3/adt, légèrement au-dessous de la moyenne canadienne (75 m3/adt). Le contenu énergétique des effluents rejetés est réduit de 0.26 à 0.11 (GJ effluents /GJ production de la vapeur) parce que leur énergie est récupéré et moins d’effluents sont générés; la quantité de vapeur destinée à chauffer l’eau est aussi réduite. Le contenu énergétique des gaz de fumées est entièrement récupéré par des courants froids situés au-dessus du point de pincement.
La destruction d’éxergie dans le procédé est réduite de 32% suite à l’optimisation des niveaux de pression de vapeur, l’élimination de vannes de détente et par la diminution de la consommation de vapeur. De plus, l’implantation des turbines permet de générer 44.4 MW de puissance.
L’amélioration du procédé grâce à l’application de la méthodologie unifiée permet d’économiser plus de vapeur que par l’application indépendante des techniques typiques.
Les deux premières étapes, la définition du cas de base et l’analyse comparative, bâtissent le fondement pour toutes les analyses subséquentes. Les indicateurs basés sur les contenus énergétique et éxergétique permettent d’analyser l’efficacité du système actuel de production de vapeur ainsi que les pertes d’éxergie dues à l’absence des mesures de récupération interne de chaleur et de réutilisation d’eau. Le fait que des facteurs, tels que l’énergie, l’eau et l’éxergie sont analysés, donne une vision plus large de l’efficacité énergétique car toutes les forces motrices
sont analysées en termes de quantité, qualité et mode d’utilisation. Le procédé amélioré, suite à l’application de la méthodologie proposée, devient un bas consommateur d’eau et d’énergie et il possède des systèmes efficaces de production de vapeur et d’eau chaude. La réduction d’éxergie détruite et perdue permet la fermeture de la chaudière à combustible fossile et l’augmentation de la production de puissance.
Le résultat final de la méthodologie unifiée est un procédé vert qui n’utilise pas de combustible fossile, consomme moins d’eau et de vapeur que la moyenne canadienne et produit de l’électricité à partir de biomasse (bio-énergie).
Grâce aux résultats obtenus dans le cadre de ce travail, de nouvelles perspectives de recherche s’ouvrent. En ce qui concerne l’évaluation de l’efficacité énergétique, il serait intéressant de mener des études plus approfondies sur l’analyse exégétique de toutes les opérations unitaires, quant à l’analyse des interactions, le développement d’une procédure d’optimisation mathématique pourrait résulter en une réduction plus importante de la consommation d’eau et de vapeur. L’application de la méthodologie devrait être considérée lors de la transformation d’une usine de pâte Kraft en une bioraffinerie verte et durable.
TABLE OF CONTENTS
Dedication………...iii Acknowledgements ... iv Résumé ... v Abstract... vii Condensé en français ... ixTable of contents ... xvi
List of Tables ... xxi
List of Figures ... xxiii
List of Appendices... xxvii
Nomenclature ... xxviii
Chapter 1 Introduction... 1
1.1 Problem ...1
1.2 General objective ...4
1.3 Structure and organisation...4
Chapter 2 Context of the study... 6
2.1 Kraft process...7 2.1.1 Delignification ... 8 2.1.2 Washing ... 8 2.1.3 Bleaching ... 8 2.1.4 Recovery loop ... 9 2.1.5 Drying... 10
Chapter 3 Literature review ... 11
3.1 Internal heat recovery...11
3.1.1 Applications of Pinch Analysis... 12
3.2 Water reutlization...16
3.2.1 Application of Water Pinch ... 19
3.3 Energy and water ...20
3.5 Energy upgrading and conversion ...29
3.6 Synthesis...31
3.7 Specific objectives ...32
3.8 Overall methodology approach...32
Chapter 4 Base Case Process Development for Energy Efficiency Improvement, Application to a Kraft Pulping Mill. Part I: Definition and Characterization ... 34
4.1 Presentation of the article ...34
4.2 Abstract ...34 4.3 Introduction ...35 4.4 Context ...37 4.5 Methodology...38 4.5.1 Data gathering ... 38 4.5.2 Master diagram... 39 4.5.3 Systems analysis... 39 4.5.4 Computer simulation ... 39 4.6 Case study...40 4.6.1 Data gathering ... 40 4.6.2 Master diagram... 41 4.6.3 Systems analysis... 42 4.6.4 Computer simulation ... 53 4.7 Conclusions ...57 4.8 Acknowledgements...58 4.9 References ...58
Chapter 5 Base Case Process Development for Energy Efficiency Improvement, Application to a Kraft Pulping Mill. Part II: Benchmarking analysis... 61
5.1 Presentation of the article ...61
5.2 Abstract ...62
5.3 Introduction ...62
5.4 Literature review...63
5.5.1 Phase I Data compilation. ... 66
5.5.2 Phase II Comparison to the current practice. ... 67
5.5.3 Phase III New key performance indicators... 67
5.5.4 Phase IV Targeting... 69
5.5.5 Phase V Synthesis. ... 69
5.6 Case study...69
5.6.1 Phase I Data compilation ... 71
5.6.2 Phase II: Comparison to current practice... 71
5.6.3 Phase III New key performance indicators... 75
5.6.4 Phase IV Targeting... 79 5.6.5 Water reutilization... 82 5.6.6 Phase V. Synthesis ... 83 5.7 Conclusions ...83 5.8 Acknowledgements...84 5.9 Annex ...85 5.10 References ...88
Chapter 6 Systems interactions analysis for the retrofit of a typical Kraft process ... 90
6.1 Introduction ...90
6.2 Methodology...91
6.2.1 Step I: Internal heat recovery (IHR)... 96
6.2.2 Step II: Water reutilization (WR)... 99
6.2.3 Step III: Non isothermal mixing (NIM) ... 102
6.2.4 Step IV: Energy upgrading ... 106
6.2.5 Step V: Condensate recovery (CR) ... 108
6.2.6 Step VI: Energy conversion... 109
6.3 Conclusions ... 109
Chapter 7 Implementation Strategy Towards an Energy Efficient Kraft Mill... 111
7.1 Presentation of the article ... 111
7.2 Abstract ... 111
7.4 Context ... 113
7.5 Previous work ... 115
7.6 Implementation strategy... 121
7.6.1 Phase I: Base steam demand reductions and shut down of the fossil fuel boiler 123 7.6.2 Phase II. Additional steam demand reductions... 132
7.6.3 Phase III. Energy upgrading and conversion ... 133
7.7 Post-benchmarking... 138
7.8 Economics of the complete implementation ... 139
7.9 Conclusions ... 140
7.10 Acknowledgements... 140
7.11 References ... 141
Chapter 8 Unified methodology for thermal energy efficiency improvement: Application to Kraft process ... 144
8.1 Introduction ... 144
8.2 Unified methodology ... 144
8.2.1 Stage 1. Base case ... 147
8.2.2 Stage 2 Pre-benchmarking ... 148
8.2.3 Stage 3. Interactions analysis ... 151
8.2.4 Implementation strategy and post-benchmarking ... 153
8.3 Application to case study ... 154
8.3.1 Stage 1. Base case ... 155
8.3.2 Stage 2. Benchmarking analysis ... 160
8.3.3 Stage 3. Interactions analysis ... 166
8.3.4 Implementation strategy and postbenchmarking ... 172
8.4 Conclusions ... 178
General Discussion... 180
Base Case ... 180
Benchmarking analysis ... 180
Systems interactions analysis ... 180
Conclusions and Recommendations... 182
Original contributions ... 183
Recommendations for future research ... 183
References... 185
Appendices…… ………..198
LIST OF TABLES
Table 4-1 Average mill data for the overall production and utilization of steam...41
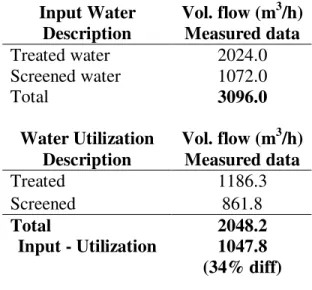
Table 4-2 Average mill data for the overall input and utilization of water ...41
Table 4-3. Boiler efficiency and steam production ...43
Table 4-4 Direct or indirect steam utilization by process section...44
Table 4-5 Steam consumption and condensate recovered by process section...52
Table 4-6 Water consumption by process section...52
Table 4-7 Overall production and utilization of steam...56
Table 4-8 Water intake and utilization ...57
Table 5-1 New KPI...69
Table 5-2 Energy and exergy data for the nominal process ...78
Table 5-3 Exergy and energy indicators for the nominal process...78
Table 6-1 Classification of the energy enhancing techniques ...91
Table 6-2 Steam savings by section ...95
Table 6-3 Indicators Assessment...95
Table 6-4 Violations to the pinch rules in the current process (values in MW) ...97
Table 6-5 Violations to the pinch rules after water reutilization ... 101
Table 7-1 Steam consumption by process section ... 116
Table 7-2 Water consumption by process section... 117
Table 7-3. Average and maximum utilization of steam ... 123
Table 7-4 Economic analysis installation of a heat exchanger ... 124
Table 7-5 Economic Analysis of Water Reutilization measures ... 129
Table 7-6 Phase I Economic Analysis ... 131
Table 7-7 Phase II Economic Analysis... 133
Table 7-8 AHP economic analysis ... 135
Table 7-9 Phase III Economic Analysis ... 138
Table 7-10 Postbenchmarking: indicators variation... 139
Table 7-11 Economics of the full implementation strategy... 140
Table 8-2. Steam consumption by process section ... 157 Table 8-3. Water consumption by process section... 159 Table 8-4 Overall water balance ... 160 Table 8-5 Overall steam balance... 160 Table 8-6 Energy and exergy data for the nominal process ... 163 Table 8-7 Exergy and energy indicators for the nominal process... 163 Table 8-8 HEN performances ... 171 Table 8-9. Average and maximum utilization of steam ... 173 Table 8-10 Phase I Economic Analysis ... 175 Table 8-11 Phase III Economic Analysis ... 177 Table 8-12 Economics of the full strategy implementation... 177 Table 8-13 Postbenchmarking: indicators variation... 178
LIST OF FIGURES
Figure 2-1. Simplified diagram of the Kraft process...7 Figure 2-2 Utilization and recovery of Na and Ca in Kraft process...9 Figure 3-1 Example of the hot and cold composite curves of a process ...11 Figure 3-2 Advanced composite curves (Nordman and Berntsson, 2009)...14 Figure 3-3 Combined process and utilities analysis by Mateos-Espejel et al (2007). ...14 Figure 3-4 Pinch diagram ...17 Figure 3-5 Composite concentration curve...18 Figure 3-6 Fluid efficiency pinch diagram ...19 Figure 3-7 Grid diagram with temperature and concentration flow rates (Savulescu et al.,
2005b) ... 22 Figure 3-8 Water mains and identification of hot and cold streams (Savulescu, L. et al. 2005)...22 Figure 3-9 Merge operations (Savulescu, L. et al. 2005) ...23 Figure 3-10 Identification of sources and sinks (Savulescu, L. et al. 2005)...23 Figure 3-11 Tanks curves (Nordman and Berntsson, 2006)...24 Figure 3-12 Combined process and utilities analysis for a concentration section (Marinova et
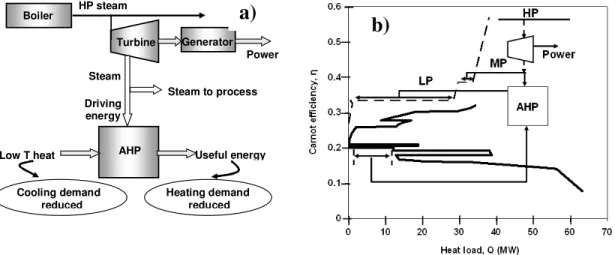
al., 2007)... 27 Figure 3-13 Sankey Diagram Exergy flow (Sorin et al., 1998b) ...28 Figure 3-14 Positioning of an AHP ...29 Figure 3-15 a) Schematic of a trigeneration unit b) Positioning of the trigeneration unit in
the process ... 30 Figure 3-16. Methodology ...32 Figure 4-1 Simplified diagram of the Kraft process...37 Figure 4-2 Nominal conditions definition and characterization methodology ...38 Figure 4-3 Overview of the master diagram. ...42 Figure 4-4 Energy consumed by process department as a fraction of the total consumption ...45 Figure 4-5 Distribution of condensates in the process ...45 Figure 4-6 Deareation system ...46 Figure 4-7 Simplified diagram of the production, utilization and post-utilization of steam ...47
Figure 4-8 Water consumption distribution in the process...49 Figure 4-9 Distribution of sewered effluents in the process...50 Figure 4-10 Simplified diagram of the production, utilization and post-utilization of water...51 Figure 5-1. Methodology ...65 Figure 5-2 Bleaching section ...70 Figure 5-3 Black liquor concentration section...70 Figure 5-4. Overall thermal consumption and thermal energy production ...72 Figure 5-5. Thermal consumption by process section...73 Figure 5-6. a: Water consumption; b:Effluent production...74 Figure 5-7 Exergy composite curves of the current process...76 Figure 5-8 Sankey diagram of the exergy heat flows supplied to the process...76 Figure 5-9 Sankey diagram of the exergy supplied for producing hot water ...77 Figure 5-10 ∆T min targeting...80 Figure 5-11 Thermal composite curves of the process...81 Figure 5-12 Water composite curves of the process ...82 Figure 6-1 Interaction analysis procedure ...92 Figure 6-2 Interactions identification sequential approach...93 Figure 6-3 Thermal composite curves of the process in initial configuration ...96 Figure 6-4 Water composite curves of the process ... 100 Figure 6-5 Thermal composite curves of the process after water reutilization... 100 Figure 6-6 Exergy destroyed for different NIM points: current and after water reutilization
configuration ... 103 Figure 6-7 a) Current hot water production system; b) retrofit system... 104 Figure 6-8 a) Current deareation system b) retrofit system... 104 Figure 6-9 Thermal composite taking into account the elimination of NIM points (Case 3a).... 105 Figure 6-10 Thermal composite taking into account the elimination of NIM points (Case 3b).. 105 Figure 6-11 Case 3b: network design above the pinch... 107 Figure 6-12 Case 4b: network design above the pinch... 108 Figure 7-1 Simplified diagram of the Kraft process... 114 Figure 7-2 Steam Production ... 116
Figure 7-3 Water production... 117 Figure 7-4 Thermal composite curves of the process... 119 Figure 7-5 Water composite curves of the process ... 119 Figure 7-6 Thermal composite curves before and after WR and elimination of NIM ... 120 Figure 7-7 Implementation methodology ... 122 Figure 7-8. Whitewater preheating; a) Current; b) energy saving measure 2... 124 Figure 7-9. Condensates from BL section; a) Current b) Water reutilization measure 3... 126 Figure 7-10. Reuse of white water; a) Current b) Water reutilization measure 4... 127 Figure 7-11. Bleaching filtrate reutilization; water reutilization measure 5... 128 Figure 7-12 Vacuum pump sealing water; a) current b) Water reutilization measure 6 ... 128 Figure 7-13 Fresh water pre-heating a) Current; b) Energy saving measure 7... 130 Figure 7-14 Hot oil recirculation system... 131 Figure 7-15 Whitewater reheating; a) Current; b) Energy saving measure 8 ... 132 Figure 7-16 BL concentration section ... 133 Figure 7-17 Current configuration for chilled water production ... 135 Figure 7-18 a) Double lift AHP for chilling water production in the chemical making plant
b) Single lift AHP to upgrade the bleaching effluents heat content ... 135 Figure 7-19 Grand composite curve and steam pressure levels... 137 Figure 7-20 Cogeneration system to be implemented... 138 Figure 8-1. Unified methodology... 145 Figure 8-2 Interactions analysis procedure... 145 Figure 8-3 Detailed Unified Methodology ... 146 Figure 8-4. Overview of the master diagram. ... 156 Figure 8-5. Steam Production ... 157 Figure 8-6. Water production... 159 Figure 8-7 Sankey diagram of the exergy flows supplied to the process ... 162 Figure 8-8 Thermal composite curves of the process... 164 Figure 8-9 Water composite curves of the process ... 165 Figure 8-10. Interactions analysis procedure ... 166 Figure 8-11. a) Current hot water production system; b) retrofit system... 168
Figure 8-12. a) Current deareator system b) retrofit system... 168 Figure 8-13 Case 3b: network design above the pinch... 169 Figure 8-14 Case 4b: network design above the pinch... 170 Figure 8-15 Thermal composite curves modifications ... 171 Figure 8-16 Implementation methodology ... 173
LIST OF APPENDICES
Appendix 1 Detailed steam production and utilization mass balances ...…...198 Appendix 2 Detailed water production and utilization mass balances ….………...201 Appendix 3 List of publications……….. ….………...204
NOMENCLATURE
Symbol Description Units
AHP Absorption heat pumps ŋi, Carnot coefficient
Cpi, Heat capacity kJ/kg*K
DSC Dissolved solids concentration ppm
ESP Energy supplied to the process (MW) MW
ECE Indicator energy content effluents MJ/MJ
ECFG Indicator energy content flue gases MJ/MJ
ECT
Indicator for the total energy content of effluents and
flue gases MJ/MJ
ECWTot Indicator energy required to heat up water MJ/MJ
ExProc Exergy required by the process MW
ExSP Exergy supplied to the process by fuels MW ExWater Total exergy required to heat up water MW Exdest,∆THX Exergy destroyed –steamutilization MW Exdest,PRV’s Exergy destroyed - adiabatic expansion HP MW Exdest,HPprod Exergy destroyed - HP steam production MW Exlost,eff+FG Exergy lost associate with the effluents and flue gases MW
ExCE Indicator exergy content of effluents MJ/MJ
ExCFG Indicator exergy content of flue gases MJ/MJ
ExCT
Indicator of the total exergy content of effluents and flue
gases MJ/MJ
ExCCog Indicator cogeneration potential MJ/MJ
ExCWTot Indicator exergy required to heat up water MJ/MJ HEN Heat exchanger network
HP High pressure steam kPa
LP Low pressure steam kPa
M Mass flow kg/s
MCR Minimum cooling requirement MW
MER Minimum energy requirements MW
MP Medium pressure steam kPa
MHR Minimum heating requirement MW
MWC Minimum water consumption MW
NIM Non isothermal mixing
PP Pinch point ºC
PRV Pressure release valve
Tin Inlet temperature ºC
Ttarget Target temperature ºC
T Temperature of heat sources or sinks ºC
TET Effluent treatment temperature ºC
TSAC Condensation temperature of sulfuric acid ºC
To Ambient temperature ºC
Tlm Mean logarithmic temperature ºC
CHAPTER 1
INTRODUCTION
1.1 Problem
The enhancement of the energy efficiency is of paramount importance for the energy intensive chemical industries that still rely on expensive fossil fuels. The globalization of markets has led the industries to reduce all costs, including that of energy, without modifying the quality of the end product. The implementation of energy reduction programs is essential for all manufacturing industries in industrially mature countries to remain competitive. In response, a wide variety of methodologies and technologies have emerged to improve the chemical processes. These methodologies tend to focus on a specific enhancing technique and also on a specific process section without regard to the interactions between the utility systems, water and steam, and the unit operations. The application of individual techniques will indeed lead to reduction of energy consumption of a plant but they will not accomplish the full reduction potential
A preliminary step to the process analysis, often overlooked, is the definition of the base case. It consists of developing the utility systems, the process diagram and the overall steam and water balances. The construction of a computer simulation, representative of the complete process, is fundamental for any energy study (Paris, 2000a). The simulation is the principal source of data and also an instrument to asses the impacts of possible process modifications. The evaluation of the process sections or units is achieved by benchmarking (Francis et al., 2006; Towers and Turner, 1998). Benchmarking typically consists of comparing a given process with the industrial practices. However, the results of this analysis do not provide information on the means to improve the process. Paris (2000) proposed a systematic approach for implementing water reutilization measures that can also be extended to the improvement of the energy efficiency. This approach consists of three sequential steps: good housekeeping, good engineering practice and advanced energy optimization. Measures to improve pipes insulation, stop leaks and take other simple measures should be implemented first. The optimization of the operating conditions and the control systems should be performed before applying more complex energy enhancing techniques.
The interactions between the utilities systems and the process must be identified to formulate technically feasible energy enhancing options. There are various techniques to improve the energy efficiency of a process; however, these techniques must be applied in an iterative procedure to cast light on their synergies and counter-actions. The two best known techniques and most often utilized are internal heat recovery and water reutilization by the application of systems closure measures. In response, milestone methodologies such as Pinch analysis®, Water Pinch and Exergy Analysis have been developed.
The objective of Pinch analysis® is to increase process to process heat exchanges by the design of a retrofit heat exchanger network (HEN). It can be applied to complex industrial sites such as petroleum refineries. It can incorporate complementary techniques such as energy conversion and upgrading.
Water Pinch (Dhole, 1998; El-Halwagi and Manousiouthakis, 1989; Wang and Smith, 1994) is an extension of Pinch Analysis® but with a water reutilization perspective. The objective is to maximize the reutilization of water streams within the process or to determine appropriate water regeneration measures.
Exergy is a measure of both the quality and quantity of the energy involved in transformations within a system and the transfers across its boundary. Therefore, the exergy is an indicator of the inefficiencies of a process. Exergy analysis is an approach based on the principle of exergy destruction and exergetic efficiency used to analyze the performance of certain operations or identify the bottlenecks of a process (Kotas, 1985; Szargut et al., 1988). The objective is to propose enhancement measures that reduce the exergy destroyed by the way the process operations are performed. Exergetic efficiency is a term that can have several interpretations (Brodyansky et al., 1994) and that may lead to different results. Moreover, the concept of exergy might seem unrelated to the engineering practice when compared to other more familiar quantities such as enthalpy and concentration. In fact thermal pinch, water pinch and exergy analysis complement each other and should all be part of a unified methodology for the improvement of the energy efficiency. They have been combined to analyze specific sections of a process. Staine and Favrat (1996) proposed the utilization of exergy composite curves for the energy optimization of a process in the context of a life cycle analysis. The reduction of exergy
lost associated to internal heat recovery was the objective of this study. Sorin and Paris (1999) integrated exergy and pinch analysis for improving the operating conditions of a process and the retrofit of the HEN. They introduced the concept of transit exergy (Sorin et al., 1998b) in the computation of the exergetic efficiency. Marechal and Favrat (2005) demonstrated the combined used of exergy analysis and process integration techniques to analyse the implementation of utility systems in industrial processes. Linnhoff and Alanis (1991) applied Pinch Analysis® and Gaggioli et al (1991) exergy analysis separately to the same case study. Their results only highlight the fields of action for each methodology. Exergy analysis identifies the operations with poor performance and Pinch Analysis® the heat transfer inefficiencies or lack of internal heat recovery.
The interactions between energy and water have also been studied. Savulescu et al (2005a) proposed a method to reduce water and steam consumption in water networks by the utilization of a diagram that incorporates the temperature and contaminants concentration to develop measures for internal heat recovery and water reutilization. Schaareman et al. (2000) applied Pinch Analysis and Water Pinch in sequence but without analyzing the impacts of water reutilization strategies in the thermal side of the process. Savulescu and Alva-Argaez (2008a) proposed a methodology for the elimination non isothermal mixing used for direct heat recovery, to reduce the steam demand in water and steam systems. Lafourcade et al (2006) developed a methodology where two types of water reduction projects are proposed: projects formulated by benchmarking the current reutilization strategies, and based on an analysis of the thermal composite curves so as to consider thermal constraints.
There are other energy enhancing techniques, such as: the increment of the rate of condensate return to the utility system, the elimination of non isothermal mixing for heating or cooling and the adjustment of the temperature or pressure levels of the utilities. These techniques are often ignored in energy retrofit projects yet, they can have a significant effect on the overall steam consumption but they may also limit the scope of internal heat recovery and system closure. There are also vast amounts of heat at low potential in various process streams near ambient temperature, which cannot practically be recovered by the techniques mentioned above. Upgrading some of this heat to a useful level by means of a heat pump can, in some cases, yield
significant energy gains. Absorption heat pumps can be attractive because of their specific characteristics (Bakhtiari et al 2009). Finally the availability of excess steam production capacity generated by an energy integration project can be used to produce electric power for sale thus generating revenues to offset energy costs and investments.
Therefore, there is a need for a methodology that analyzes the energy efficiency of the processes globally, which integrates several energy enhancing techniques, and that take into account the systems interactions. The final result should be a strategy where different kinds of measures are implemented conjointly with the objective of improving the overall energy efficiency.
1.2 General objective
The objective of this thesis is to develop, validate, and apply a unified methodology for energy efficiency improvement that addresses globally the systems interactions in a Kraft process.
1.3 Structure and organisation
In Chapter II, the context of the thesis is explained. The specifics of the Kraft process are introduced as well as the current situation of the Canadian pulp and paper (P&P) industry.
In Chapter III, the literature review of the techniques used for improving energy efficiency is presented. Several studies concerning the internal heat recovery, water reutilization, energy-water studies and, energy upgrading and conversion are introduced. The application of these techniques to P&P processes is also discussed. The conclusion of this chapter states the specific objectives of this thesis. The four stages of the overall methodology are described as well as their purpose. In Chapter IV, the definition and characterization of the base case is performed. The details of the development of the steam and water systems, the required data to construct them and the computer simulation are presented.
In Chapter V, the benchmarking analysis is performed. A new benchmarking procedure has been developed to evaluate the current energy efficiency of the process. The 5 phases of the procedure
are explained: data compilation, comparison to the industrial practices, utilization of new energy and exergy content indicators, targeting by Pinch Analysis and Water Pinch, and a synthesis. In Chapter VI, the systems interactions analysis is performed. A method is presented to identify and evaluate the systems interactions in the base case. Several energy enhancing techniques are considered: internal heat recovery, water reutilization, elimination of non isothermal mixing, energy upgrading & conversion, and condensate recovery.
In Chapter VII, a strategy for implementing the measures that is the result of the systems interactions analysis is presented. The strategy has 3 objectives: elimination of fossil fuel, liberation of steam capacity and production of power. Economical and technical constraints are considered. A post-benchmarking analysis is also performed.
In Chapter VIII, the unified methodology developed in this thesis is presented. It consists of four phases: definition and characterization of the base case, benchmarking, systems interactions analysis, and implementation strategy.
In the general discussion, the highlights of each step of the methodology are presented.
In the conclusions and recommendation, the originality and topics for future research are discussed.
In the appendix the overall steam and water systems are presented. A list of publications which have been developed is attached.
CHAPTER 2
CONTEXT OF THE STUDY
The object of this study is an operating Kraft pulping process situated in Eastern Canada. The pulp and paper (P&P) industry has been a major contributor to the North American economy for many years. Due to the simultaneous impact of several factors such as the intense world wide competition from mills producing fiber from fast-growing forests, the reduced demand for newsprint and pulp, and the high cost of energy, the industry has been under heavy pressure, and unable to generate enough profit.
The total production of paper products in Canada is of 30 345 000 tonnes, which represents a declined of 5% in the period 2000-2005 as published by PPPC (2005). In the same period the sales of the industry have decreased by 25%.
P&P processes are Canada’s most energy intensive sector, accounting for 25 % of the total industrial energy consumption (Cipec, 2007). Even though 60% of its energy requirement is generated from biomass, its consumption of fossil fuel remains a heavy burden. Its high water consumption compounds its energy challenge (Turner, 1994). Overall, energy accounts for up to 30% of the total pulp manufacturing cost in Canada. Facing increasing energy costs and more stringent environmental regulations, the industry has refocused its research efforts towards energy efficient practices and technologies and water conservation programs.
The energy efficiency of the Kraft process is strongly related to the proper management of water and steam that are the driving forces of the process. Water is used for cooling, dilution, pulp washing, and for steam production. Steam is employed for the chemical delignification, to heat up the water, to concentrate the black liquor and for pulp drying.
Systematic energy optimization with the application of advanced methodologies is necessary to improve the energy efficiency of P&P processes in a cost effective way.
2.1 Kraft process
The Kraft process is the dominating pulping process by which wood chips are transformed into paper pulp, the intermediate material from which a very broad spectrum of finished or semi-finished paper products are made. Its simplified representation is given in Figure 2-1. A typical Kraft pulp mill uses biomass (wood chips), fuel (fossil and hog), chemicals, and water to produce market pulp, steam and power. The major components of wood are cellulose (40-47%), hemicellulose (25-35%), lignin (16-31%), and extractives (2-8%) (Smook, 2002). The core of the Kraft process is the chemical delignification step in which the individual cellulosic fibers are separated from lignin to form pulp. The Kraft delignification agent (white liquor) is a mixture of sodium hydroxide (NaOH) and sodium sulfide (Na2S). For bleachable grade pulp, 45-65% of the
wood mass is dissolved in the pulping liquor during delignification. The dissolved material consists primarily of degraded hemicellulose, cellulose, lignin and various others organics (the extractives). After delignification, the fibers are washed, and chemically bleached. Finally, they are drained, pressed, and thermally dried in a pulp machine. An important characteristic of the Kraft process is that the spent delignification liquor (black liquor), separated from the fibers in the washing step, is concentrated and burnt to produce steam and an inorganic smelt. The smelt composed of sodium carbonate (Na2CO3) and sodium sulfide is dissolved to form green liquor,
which is reacted with quick lime (CaO) to regenerate the original white liquor.
Delignifi-cation Washing Bleaching Drying Pulp
Concen- tration Recovery Boiler Recausti- fiaction Lime Wood Chips CaCO3 Steam to process Smelt
Water Water Chemicals
Black Liquor CaO White Liquor Water ClO2 making
2.1.1 Delignification
In the Kraft process the delignification occurs in a chemical reactor named the digester. The objective is to remove as much lignin as possible without losing large quantities of cellulose and hemicelluloses. For this purpose a chemical mixture of caustic soda and sodium sulphide (100 – 110 g/L), named white liquor, is employed. Before bleaching, about 90% of the lignin has been dissolved. The unbleached pulp contains 36% cellulose, 8% hemicellulose and 2 % lignin, based on the original weight of wood (Van Lierop, 2006).
Depending on the type of digester (continuous or batch), the live steam requirement varies; for a continuous digester it is 1.7 GJ/adt (Francis et al., 2004) and 4.78 GJ/adt for a batch digester (Francis et al., 2006).
2.1.2 Washing
A series of counter-current washers are used to separate the black liquor from the fibres. An excess of water utilization, to increase washing efficiency, increases the steam demand in the black liquor concentration. On the other hand, ineffective washing results in high consumption of bleaching chemicals.
2.1.3 Bleaching
Chemical pulp bleaching removes the lignin that remains in the fibers after the chemical delignification. The primary objective is to produce pulp with high brightness. The secondary objectives are retaining brightness stability, high pulp cleanliness, and high cellulose content. The steam consumption of a modern bleaching department using only 4 stages is about 2.3 GJ/adt (Francis et al., 2004). This section is also the highest water consumer of the process. The consumption depends on the age of the mill, the number of stages, and the degree of water reutilization. A conventional bleach plant uses between 25 to 60 m3/a.d.t and if the consumption is 100 m3/a.d.t, it would be considered excessively high (Turner, 1994).
2.1.4 Recovery loop
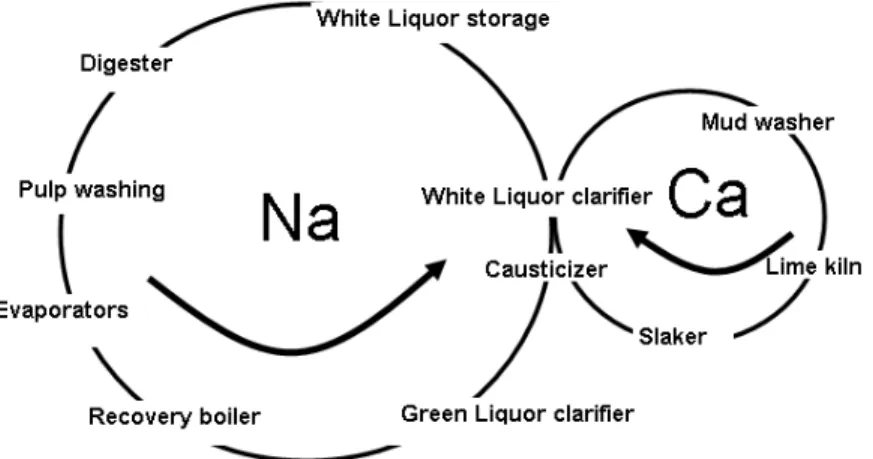
Most of the steam required by the process and the delignification chemicals are generated in the recovery loop of a Kraft process (Figure 2-2).
Figure 2-2 Utilization and recovery of Na and Ca in Kraft process
The recovery loop has three sections: the evaporators where the black liquor is concentrated; the recovery boilers where the concentrated black liquor is burnt to produce steam and recover an inorganic smelt, green liquor; this smelt is recaustified so as to regenerate the white liquor used in the delignification.
Evaporators. The so-called strong black liquor is concentrated to a 70 % dissolved solids content. The average steam consumption for a modern seven effect train of evaporators with one concentrator is calculated to be: 3.1 GJ/adt (Francis et al., 2004). Most of the warm water used in the process (40°C) is produced in this section.
Recovery boilers. The boilers burn the concentrated black liquor to produce steam and the inorganic smelt that will be recaustified.
Recaustification. The objective is to produce enough white liquor for the delignification at a minimum cost. The white liquor is produced by the soda-lime process represented by the following pathways.
Caustification reaction:
CaO +H2O Ca(OH)2 + Na2CO3 CaCO3 + 2NaOH
Lime burning reactions:
CaCO3 + heat CaO + CO2
2.1.5 Drying
This is the final stage of the process, it has two principal objectives: extraction of the water and formation of the fibre net. The dryers are, with the evaporators, the biggest energy consumers of the Kraft process. For a new mill the steam consumption is 2.3 GJ/adt (Francis et al., 2004). The average consumption of dryers in Canadian mill is 4.54 GJ/adt (Francis et al., 2006).
CHAPTER 3
LITERATURE REVIEW
On the basis of the general objective of this thesis, the literature review is divided in five parts; internal heat recovery, water reutilization, energy and water, exergy analysis and, energy conversion and upgrading. The conclusions of this chapter are the specific objectives of the thesis.
3.1 Internal heat recovery
Pinch Analysis is the standard tool to increase internal heat recovery. It was developed at the beginning of the 80’s (Linnhoff et al., 1994a; Linnhoff et al., 1994b) and has been proven to achieve energy reductions between 25 to 35% (Linnhoff, 1994b). It is a structured approach used to maximize internal heat recovery within a process and to minimize its need for hot and cold energy supplied by utilities. It is well known that in order to ensure real net energy savings Pinch Analysis must be applied to a whole process or even to a complete site.
MCR MHR Pinch (Hot) Pinch (Cold) ∆Tm in T H Maximum Internal Heat
Recovery
The basis of Pinch Analysis is the display in a temperature vs enthalpy diagram of all possible heat transfers within the process (Figure 3-1). It consists of the hot and cold composite curves which respectively represent the heat availability and demand in the process and define the minimum energy requirement (MER) and the pinch point.
3.1.1 Applications of Pinch Analysis
The main objectives of applying Pinch Analysis have been to reduce the fossil fuel consumption, the atmospheric emissions and to set the basis for a continuous optimization (Linnhoff, 1994a). The resulting measures vary from individual projects to the total site integration. It has been widely applied in the petrochemical industry, as well as in the pulp and paper industry (Algehed, 2002; Algehed et al., 2000; Axelsson and Berntsson, 2005; Eastwood, 1988; Kemp, 2005; Rouzinou et al., 2003; Towers, 2003).
In pulp and paper processes the heat recovery loops of old mills were installed without considering the pinch point. Therefore economically attractive energy savings can be found just by respecting the principles of Pinch Analysis (Towers, 2003). The analysis has also been applied as a decision tool when looking to solve specific problems. For instance, the reduction of the effluent temperatures to improve the efficiency of their treatment (Noel and Boisvert, 1998) or the installation of new equipment (Berglin and Berntsson, 1998; Rouzinou et al., 2003).
The retrofit of the overall heat exchanger network has also been proposed for an operating Kraft process (Lutz, 2008) and for a model mill (Axelsson et al., 2006).
The grand composite curve (GCC), which is a diagram representing the net heat flows in the process, has been used to identify the excess utilization of hot utility or the availability of the heat contained in hot effluents (Axelsson and Berntsson, 2005). The combination of the GCC with optimization algorithms has been applied to define the optimum heat exchange network and to choose the best utility technology so as to develop an optimal utility system (Marechal and Kalitventzeff, 1998b). The adjustment of the steam pressure levels is also one of the GCC main applications (Marechal and Kalitventzeff, 1997). The GCC for the process and for the corresponding utility systems have also been compared so as to find opportunities for cogeneration (Dhole and Linnhoff, 1993; Marechal and Kalitventzeff, 1996b; 1998a).
The analysis of the process needs by means of the composite curves is, typically, the initial step of the energy studies. However, Rutkowski and Karp (2001) proposed an analysis of the utilities systems prior to the application of Pinch Analysis. Therefore, aspects such as the fuel utilization in the boilers, localization of all steam consumers, and the condensate return rate are the initial targets of the energy programs. The aim is to increase the economic attractiveness of the projects. Pinch Analysis is mostly applied in retrofit situations. The chemical processes that were installed 30 years ago are not optimally integrated. However, the complete redesign of the corresponding utility systems or HEN would not be profitable. This is the case in the P&P industry. Therefore, in retrofit situations the capital cost trade-offs vs operating costs have always to be considered when applying Pinch Analysis (Linnhoff and Witherell, 1986).
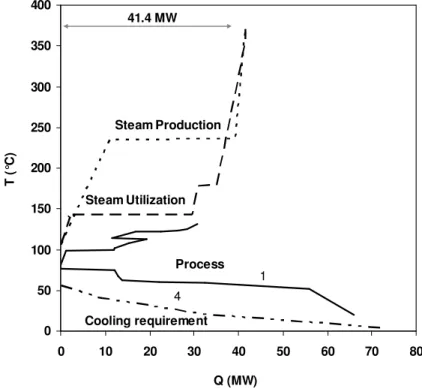
In a typical retrofit situation the Pinch Analysis should also take into account constraints such as the physical distance between the streams, material, type of heat exchangers, auxiliary equipment, space requirements, maintenance cost and fouling (Carlsson et al., 1993). New curves have been proposed for retrofit projects so as to obtain information which is not given by the typical GCC (Nordman and Berntsson, 2001). There are four curves defined above the pinch point (Figure 3-2): one for the utility streams used in heaters (HUC), one for the process streams associated with the heaters (AHLC), other assuming that all needs will be satisfied by the highest temperature utility (EHLC), and another which represents the minimum ∆T to which a heat exchange can take place (THLC). The same curves are defined below the pinch point. The main objective of these curves is to graphically identify options for retrofit HEN while including technical factors. However, these aspects are taken into account in the design of the HEN, and optimization algorithms (MILP, MINLP) are usually employed for this purpose. These curves have been applied in the P&P industry to integrate usable excess heat in mills with low water consumption. The temperature of the associated hot streams must be high, typically above 80°C but still below the pinch point (Wising, 2003), such as the pre-evaporation of effluents (Bengtsson et al., 2002b). A combination with an optimization algorithm (based in MILP) has also been done to include all the economic, technical and practical constraints that the pinch analysis does not tackle (Bengtsson et al., 2002a).
Figure 3-2 Advanced composite curves (Nordman and Berntsson, 2009) 0 50 100 150 200 250 300 350 400 0 10 20 30 40 50 60 70 80 Q (MW) T ( °C ) 1 Steam Utilization Steam Production 4 41.4 MW Process Cooling requirement
Figure 3-3 Combined process and utilities analysis by Mateos-Espejel et al (2007).
A similar approach has been proposed by Brown et al (2005), Mateos-Espejel et al (2007) and Perin-Levasseur et al (2008). The GCC for the process and the utility systems are constructed and