HAL Id: hal-00300182
https://hal.archives-ouvertes.fr/hal-00300182
Submitted on 17 Jul 2008
HAL is a multi-disciplinary open access
archive for the deposit and dissemination of
sci-entific research documents, whether they are
pub-lished or not. The documents may come from
teaching and research institutions in France or
abroad, or from public or private research centers.
L’archive ouverte pluridisciplinaire HAL, est
destinée au dépôt et à la diffusion de documents
scientifiques de niveau recherche, publiés ou non,
émanant des établissements d’enseignement et de
recherche français ou étrangers, des laboratoires
publics ou privés.
Suitable methodology in subjective video quality
assessment: a resolution dependent paradigm
Stéphane Péchard, Romuald Pépion, Patrick Le Callet
To cite this version:
Stéphane Péchard, Romuald Pépion, Patrick Le Callet. Suitable methodology in subjective video
qual-ity assessment: a resolution dependent paradigm. International Workshop on Image Media Qualqual-ity
and its Applications, IMQA2008, Sep 2008, Kyoto, Japan. pp.6. �hal-00300182�
SUITABLE METHODOLOGY IN SUBJECTIVE VIDEO QUALITY ASSESSMENT:
A RESOLUTION DEPENDENT PARADIGM
Stéphane Péchard, Romuald Pépion, Patrick Le Callet
Université de Nantes – IRCCyN laboratory – IVC team
Polytech’Nantes, rue Christian Pauc, 44306 Nantes, France
[email protected]
ABSTRACT
Subjective video quality assessment provides a reliable and useful ground truth for the conception of objective quality metrics. This is a mature field with several standardized methodologies. Laboratories use these methodologies but rarely more than one. Selecting the methodology fitting ex-perimental requirements and constraints is a difficult task. In this paper, two popular video quality assessment method-ologies are compared. The authors used them for the qual-ity assessment of HDTV, VGA and QVGA sequences. We show that the relation between both methodologies depends on the resolution. This result conducted to consider the pre-cision of the results depending on the number of observers involved. We indicate how many observers are required to obtain the same precision with both methodologies.
1. INTRODUCTION
Subjective video quality assessment is an efficient way of obtaining reliable video quality measurements. These are then used to confront designed objective metrics to real-ity. Several methodologies are available, depending on the quantity to evaluate, the test conditions or the required pre-cision [1, 2]. Such methodologies are time-consuming, long and expensive. It is essential to optimize the quantity and the precision of the obtained data for a given number of ob-servers. We investigate the impact of the resolution on two assessment methodologies scores sets. The result conducted us to evaluate the methodologies precision depending on the number of observers used.
These days, two assessment methodologies are particu-larly popular in the industry. The first one is the Absolute Category Rating (ACR) methodology [3], notably used by the Video Quality Experts Group [4]. This is a category judgment where the test sequences are presented one at a time and are rated independently on a category scale. Af-ter each presentation, observers are asked to evaluate the quality of the sequence. The order of the test sequences is randomized such that each observer views the video clips
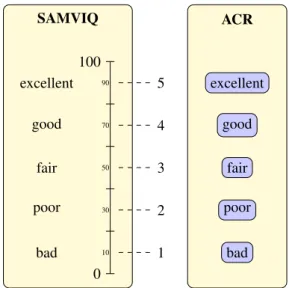
in a different order. Voting is not time-limited. The qual-ity scale is made of five items, as depicted on the right side of Figure 1. Reference sequences are usually included in a test session, but are not identified by the observers. This methodology, well-known for its simplicity and efficiency, allows the assessment of a great number of sequences in a session. For example, in the context of VQEG’s work [4], 166 8-second-long sequences are assessed in an around 35-minute-long session. This efficiency is balanced by the pre-cision, as ACR requires more observers than other method-ologies. VQEG recommends to use groups of at least 24 observers.
The second methodology is the Subjective Assessment Methodology for Video Quality (SAMVIQ) [2]. This is a multiple stimuli assessment methodology using a continu-ous quality scale shown on the left side of Figure 1. Two reference sequences are used in a session. The first one is explicit, defined as the high quality anchor for the rest of the current presentation. The second one is hidden, randomly included amongst processed sequences. The observer is al-lowed to choose the viewing order of the sequences. He/she can modify notes and repeat viewings as he/she wants, but every sequence has to be assessed. Several contents, each processed several times, are assessed in a session. SAMVIQ is only able to assess 48 sequences in an around 35-minute-long session. However, the possibility to refine the judg-ment with multi-viewing allows to increase the measure pre-cision and to decrease the number of observers. Thus, the EBU recommends to use at least 15 observers.
Three major differences between ACR and SAMVIQ have been identified. The first one is the type of scale. ACR uses a discrete scale while SAMVIQ uses a continu-ous scale. Corriveau [5] shown that this may imply a differ-ence in the used quality ranges. Results from ACR are more likely to reach the scale limits. Corriveau explains this by the fact that in a categorical scale, there is no possible vari-ations around best and worst qualities, while observers tend not to use the extreme scores of a continuous scale. The sec-ond difference is the number of viewing of each sequence. Sequences are viewed once in ACR, but as many times as
the observers want in SAMVIQ. The last difference is the eventual presence of the explicit reference. It is present in SAMVIQ but not in ACR. It modifies the task asked to the observer, as he/she has to construct his/her judgment against the explicit reference if it is available. It is a fidelity task. In ACR, the assessment is absolute. It is a quality task.
In this paper, we investigate the use of both ACR and SAMVIQ methodologies on HDTV, VGA and QVGA se-quences. Results from both methodologies are compared and the impact of the resolution is evaluated. The second part of the paper is dedicated to the impact of the number of observers on the precision of the measure.
2. COMPARISON OF SUBJECTIVE SCORES
The HDTV set is made of 24 contents coded at 8 H.264 bi-trates. 4 QVGA and 4 VGA contents have been coded at 4 H.264 bitrates and 2 SVC coding scenarios with different framerate and bitrate. These three sets were assessed with both ACR and SAMVIQ. Instructions of each test are min-imal. They just inform observers about their task and the way they have to perform it.
2.1. Quality scale adjustment
In order to ease comparison between ACR and SAMVIQ data, the ACR scores were linearly mapped from 1-5 to SAMVIQ 0-100 scale. An original ACR score n is trans-formed in n′by:
n′= (n − 1) × 20 + 10. (1)
Therefore, 1 corresponds to 10 and 5 to 90. Effectively, on the SAMVIQ scale [2], the semantic terms are placed in the middle of the intervals as depicted on Figure 1. As a consequence, ACR has a shorter scale than SAMVIQ, with only 80% covered.
2.2. Comparison of ACR and SAMVIQ scores
Figure 2 shows ACR Mean Opinion Scores (MOS) as a function of SAMVIQ MOS for the HDTV sequences. MOS were computed from at least 24 validated observers for ACR and 15 for SAMVIQ. The linear correlation coefficient (CC) between both population is 0.8993, while the root mean square error is 14.06.
The linear correlation coefficient is not as much as we could anticipate. It is significantly lower to what has been observed at smaller resolutions [6, 7]. Brotherton [7] com-pared ACR and SAMVIQ methodologies on Common In-termediate Format (352×288) sequences. The CC between both sets of results equals 0.94. In this case, methodologies provide well related evaluations. In our case, both method-ologies produce two data sets without a strong relation. No
SAMVIQ excellent good fair poor bad 100 0 ACR 5 4 3 2 1 excellent good fair poor bad 90 70 50 30 10
Fig. 1: Relation between ACR and SAMVIQ scales.
0 10 20 30 40 50 60 70 80 90 0 10 20 30 40 50 60 70 80 90 ACR SAMVIQ coded sequences reference sequences
Fig. 2: ACR MOS as a function of SAMVIQ MOS for HDTV.
reliable model can be found to transform MOS from one methodology to the other. Even with the same purpose, these two methodologies do not provide superposable re-sults.
The plot shows that ACR scores after transformation are greater to SAMVIQ scores, except at the extremities of the scale. ACR is then less critical than SAMVIQ, be-cause distortions are better perceived with the latter. On the other hand, the inverse phenomenon is observed for ref-erence scores, shown with circles. In this case, SAMVIQ scores are greater. What differences between methodolo-gies can explain this?
First, the scale difference implies that ACR scores are limited to [10;90]. The results we obtained confirm Cor-riveau’s trend [5]. With values between 10 and 87.04, ACR
uses 96.3% of the available range, while SAMVIQ uses only 82% with values from 6.27 and 88.33. However, ref-erence sequences scores are far from upper limit in ACR. They are between 68.52 et 87.04, with a mean of 77.44. With a tendency to use the whole scale, this does not ex-plain the observed phenomenon.
SAMVIQ allows an unlimited number of viewing. Ob-servers can detect every distortions. Therefore, he/she tends to give a more precise score. In the case of a distorted quence, this score is likely to be lower. On a reference se-quence, several viewing do not help him to detect more dis-tortions. Then, upper scores are used with SAMVIQ.
It is more difficult to draw a conclusion about the impact of the presence of the explicit reference. In SAMVIQ, the observer can not objectively see differences between both references. However, in a distortion context, he/she would not attribute a higher score than the explicit reference one. While comparing them, he/she only may assess them iden-tically. Moreover, observers are not in the same psychologi-cal conditions while watching both references. The explicit one is clearly identified and is assessed as is. The hidden reference is a sequence as another and is assessed in com-parison to the explicit one. It is then not obvious to attribute any impact to the presence of the explicit reference. 2.3. Impact of the resolution
Brotherton [7] shown that ACR and SAMVIQ provide cor-related results for CIF sequences. It is not the case for the HDTV sequences we used. In order to confirm this trend, we conducted similar experiments with QVGA and VGA sequences. Table 1 sums up results obtained at several reso-lutions with the corresponding observation distance d, given as a multiple of the screen height H, and the visual field f , expressed in °.
Format Resolution d f CC RMSE QVGA 320×240 6H 13 0,969 6.73
CIF 352×288 6H 12 0,94 × VGA 640×480 4H 19 0,942 9.31 TVHD 1920×1080 3H 33 0,899 14.06
Table 1: Correlation coefficients and RMSE between ACR and SAMVIQ scores for several resolutions. CIF values are from [7]. The symbol × indicates that the value is not given by the author. f is expressed in °.
The bigger the image, the lower the correlaton coeffi-cient and the bigger the RMSE. Obviously, it is easier to obtain a higher correlation coefficient with fewer values and the HDTV correlaton coefficient is computed from 192 val-ues, while the VGA and QVGA one only with 28. However, the trend allows to think that the resolution, and therefore
the visual field which takes in account the observation dis-tance, would have a significant influence on CC between ACR and SAMVIQ MOS.
Here, the type of scale and the explicit reference pres-ence have no influpres-ence. Only the number of viewing may imply such an impact. Effectively, with one or many view-ing, a small image will still be assessed the same way. Re-viewing it do not provide more information on its quality. On the other hand, a big image needs to be reviewed. The first visualisation is not sufficient to detect and assess all distortions. With SAMVIQ, the multiple viewing of a se-quence allows to precise observer’s judgement. Therefore, we can conclude that ACR and SAMVIQ are equivalent un-til a certain resolution. Beyond a certain threshold, both have unsimilar behaviors. It is an important piece of in-formation for laboratories which want to implement such methodologies.
3. IMPACT OF THE NUMBER OF OBSERVERS ON ASSESSMENT PRECISION
Yet, we are not able to select the most suitable methodology between ACR and SAMVIQ only with the resolution of the image. Let’s now discriminate both methodologies with the tradeoff between precision and number of observers. The precision of a MOS is measured by its 95% confidence in-terval. It depends on the number of observers involved in the computation of the MOS. ACR is known for its high number of observers and SAMVIQ for its precision. 3.1. Analysis method
We want to evaluate the impact of the number of observers on precision and how many observers are required in ACR to obtain the same precision as with SAMVIQ. However, each methodology uses its own rejection algorithm. This algorithm is destined to remove unconsistent observers’ re-sults. ACR uses ITU criterion, whereas SAMVIQ uses its own. Therefore, three modes of rejection are used :
1. without rejection ;
2. with ACR rejection (from ITU [1]) ; 3. with SAMVIQ rejection [2].
Table 2 presents the number of validated observers for each rejection mode and both methodologies. In the case of SAMVIQ, the first number indicates the maximal number of observers where all sequences are available. The second number indicates the maximal number of observers with available sequences.
The HDTV sequences database was assessed by 28 ob-servers using ACR. SAMVIQ was used in three different sessions, therefore the number of observer is not the same in
methodology mode 1 mode 2 mode 3
ACR 28 27 23
SAMVIQ 18-25 15-25 15-22 Table 2: Number of validated observers for each rejection mode and both methodologies. In the case of SAMVIQ, the first number indicates the maximal number of observers where all sequences are available. The second number in-dicates the maximal number of observers with available se-quences.
each session. The analysis consists to compute confidence intervals for several number of observers NP
. For exem-ple, ACR confidence intervals are computed for NP
ACR ∈
{28, 25, 22, 20, 18, 15, 12, 10, 8}. For each value of NP
ACR, the C
NP
ACR
NACRpossible combinations are computed and
we call mean confidence interval (MCI) for a given number of observers the mean of all these intervals. In our case, NP
ACR= 28. For example :
IC8ACR= 1 C8NACR C8 NACR X k=1 ICACR(k). (2) with NP
ACR = 8. In the case of SAMVIQ, as the number
of observers varies from a session to another, some means are computed with few observers. This increases the con-tent dependancy. Only means with at least 64 values are considered.
3.2. Mean confidence intervals as a function of number of observers
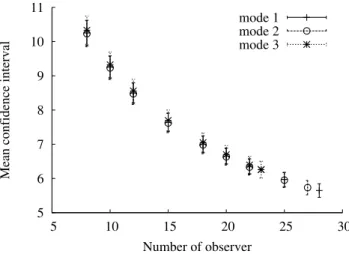
Figures 3 and 4 depict the mean confidence interval as a function of the number of observers involved in ACR and SAMVIQ tests respectively. Confidence intervals of the val-ues are plotted as well. As expected, the MCI decreases as the number of observers increases. Differences between the three modes are unsignificant. It means that the rejection criterion used has a very weak impact on the evaluation pre-cision. Moreover, as ACR precision follows a very stable function, it is not the case for SAMVIQ with more than 15 observers. This is explained by the fact that the mean con-fidence interval is computed on a smaller number of video contents.
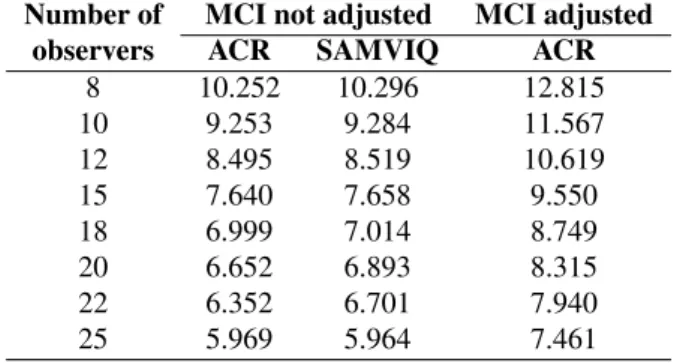
Obtained values seem to be very close between ACR and SAMVIQ. However, it does not take in account the fact that the ACR usable scale is shorter, as shown previously. It only represents 80% of SAMVIQ’s scale. Nevertheless, a confidence interval equal to 10 on a 0-100 scale is more precise than the same on a 0-80 scale. In order to compare both sets of values, we adjusted intervals obtained by ACR to compensate scale differences. A factor of 1.25 is apply on ACR MCI. 5 6 7 8 9 10 11 5 10 15 20 25 30
Mean confidence interval
Number of observer mode 1 mode 2 mode 3
Fig. 3: Mean confidence interval as a function of the number of observers involved in ACR tests for the three rejection modes. 6 7 8 9 10 5 10 15 20 25 30
Mean confidence interval
Number of observer mode 1 mode 2 mode 3
Fig. 4: Mean confidence interval as a function of the num-ber of observers involved in SAMVIQ tests for the three rejection modes.
Table 3 presents the mean confidence intervals obtained from ACR and SAMVIQ methodologies without any rejec-tion algorithm. Both adjusted and not adjusted values are shown for ACR. As SAMVIQ values are not adjusted, only original values are in the table. The corresponding numbers of observers are in the table as well. We notice that after adjustment, all MCI from ACR are greater to SAMVIQ’s. Moreover, the required number of observers for SAMVIQ is 15. At least 22 observers are required to obtain the same precision using the ACR methodology. This result indi-cates that with the same precision, SAMVIQ requires less observers. In compensation, each observer may assess a se-quence several times.
Number of MCI not adjusted MCI adjusted observers ACR SAMVIQ ACR
8 10.252 10.296 12.815 10 9.253 9.284 11.567 12 8.495 8.519 10.619 15 7.640 7.658 9.550 18 6.999 7.014 8.749 20 6.652 6.893 8.315 22 6.352 6.701 7.940 25 5.969 5.964 7.461
Table 3: Mean confidence intervals (MCI) and corre-sponding number of observers for both ACR and SAMVIQ methodologies without rejection. Both adjusted and not ad-justed values are shown for ACR.
3.3. Confidence interval of the mean confidence inter-vals
Tables 4 and 5 present the confidence intervals computed on the mean confidence intervals presented in the previ-ous section. They globally decrease as a function of the number of observers. This trend is not verified in the case of the SAMVIQ methodology for more than 15 observers. This is explained by the fact that these values are computed with a lower number of sequences. The observed decrease shows that the precicion on the mean confidence interval increases with the number of observers. This is simply be-cause the dispersion between observers is more important with a lower number of observers.
The mode without rejection always provides confidence intervals lower than those provided with the two other re-jection modes. Effectively, the total number of observers available for this computation is greater without rejection. Therefore with the same number of observers, the mean is computed with more confidence intervals than with the use of a rejection algorithm. The confidence interval on this mean is then lower. Nevertheless, differences between these
number of observers mode 1 mode 2 mode 3 8 0,369 0,380 0,413 10 0,330 0,341 0,371 12 0,302 0,312 0,339 15 0,270 0,280 0,304 18 0,247 0,256 0,278 20 0,234 0,243 0,264 22 0,224 0,232 0,252 Table 4: Confidence intervals of mean confidence intervals from the ACR methodology for the three rejection modes.
number of observers mode 1 mode 2 mode 3 8 0,377 0,380 0,389 10 0,339 0,341 0,351 12 0,310 0,313 0,321 15 0,278 0,280 0,289 18 0,254 0,275 0,321 20 0,259 0,261 0,393 22 0,369 0,372 0,518 Table 5: Confidence intervals of mean confidence inter-vals from the SAMVIQ methodology for the three rejection modes.
confidence intervals are not important.
In the same manner, confidence intervals given by the SAMVIQ rejection algorithm are greater than those given by the ACR rejection algorithm. The reason is the same, as the number of validated observers in SAMVIQ is lower than the number of validated observers in ACR as shown in Table 2.
4. CONCLUSION
This paper compared ACR and SAMVIQ subjective quality assessment methodologies. We first show that they have dif-ferent behaviours, and that the relation between their results is weaker when the resolution increases. The resolution has an impact on this relation, as a bigger visual field repre-sents more information to process. With its multi-viewing option, SAMVIQ is more accurate in considering such a quantity of information, while the unique view is not suffi-cient in ACR. We also stated that with a given number of observers, SAMVIQ is more precise than ACR. This latter requires more than 22 observers to get the same precision than SAMVIQ with only 15 observers. This result is very informative for assessment laboratories, in order to select the best methodology depending on the conditions of the tests they implement.
In the second part of the paper, we shown that the pre-cision on methodologies prepre-cision measures also depends
on the number of observers involved. The more observers, the more precise are the confidence intervals. This result is consistent with the fact that using rejection algorithms im-ply a lost of precision, because less observers are involved. The same conclusion appears between ACR and SAMVIQ rejection algorithms, while ACR rejects less observers than SAMVIQ.
5. ACKNOWLEDGEMENT
This work is supported by the Pays de la Loire region within the scope of Scalimages project from the “Media and Net-works” competitiveness cluster.
6. REFERENCES
[1] ITU, “ITU-R BT.500-11 Methodology for the subjec-tive assessment of the quality of television pictures,” Tech. Rep., International Telecommunication Union, 2002.
[2] EBU, “SAMVIQ - Subjective Assessment Methodol-ogy for Video Quality,” Tech. Rep. BPN 056, European Broadcasting Union, 2003.
[3] ITU, “ITU-T P.910 Subjective video quality assessment methods for multimedia applications,” Tech. Rep., In-ternational Telecommunication Union, 2006.
[4] VQEG, Multimedia Test Plan 1.19, 2007.
[5] Philip Corriveau, Christina Gojmerac, Bronwen Hughes, and Lew Stelmach, “All subjective scales are not created equal: the effects of context on different scales,” Signal Processing, vol. 77, no. 1, pp. 1–9, 1999.
[6] Quan Huynh-Thu and Mohammed Ghanbari, “A com-parison of subjective video quality assessment methods for low-bit rate and low-resolution video,” in Proceed-ings of Signal and Image Processing, M.W. Marcellin, Ed., Honolulu, Hawaii, USA, 2005, vol. 479.
[7] Matthew D. Brotherton, Quan Huynh-Thu, David S. Hands, and Kjell Brunnström, “Subjective multimedia quality assessment,” IEICE Trans. Fundam. Electron. Commun. Comput. Sci., vol. E89-A, no. 11, pp. 2920– 2932, 2006.