HAL Id: hal-02986926
https://hal-mines-paristech.archives-ouvertes.fr/hal-02986926
Submitted on 6 Nov 2020
HAL is a multi-disciplinary open access archive for the deposit and dissemination of sci-entific research documents, whether they are pub-lished or not. The documents may come from teaching and research institutions in France or abroad, or from public or private research centers.
L’archive ouverte pluridisciplinaire HAL, est destinée au dépôt et à la diffusion de documents scientifiques de niveau recherche, publiés ou non, émanant des établissements d’enseignement et de recherche français ou étrangers, des laboratoires publics ou privés.
Effect of processing parameters during the laser beam
melting of Inconel 738: Comparison between simulated
and experimental melt pool shape
D Grange, A Queva, G Guillemot, Michel Bellet, J-D Bartout, Christophe
Colin
To cite this version:
D Grange, A Queva, G Guillemot, Michel Bellet, J-D Bartout, et al.. Effect of processing parame-ters during the laser beam melting of Inconel 738: Comparison between simulated and experimen-tal melt pool shape. Journal of Materials Processing Technology, Elsevier, 2021, 289, pp.116897. �10.1016/j.jmatprotec.2020.116897�. �hal-02986926�
1
Effect of processing parameters during the laser beam melting of Inconel 738:
comparison between simulated and experimental
melt pool shape
D. Grangea,c, A. Quevab,c, G. Guillemot b, M. Bellet b, J-D. Bartouta, C. Colina
a
MINES ParisTech, PSL Research University, MAT – Centre des matériaux, CNRS UMR 7633, BP 87 91003 Evry, France
b
MINES ParisTech, PSL Research University, CEMEF – Centre de Mise en Forme des Matériaux, CNRS UMR 7635, CS10207 rue Claude Daunesse, 06904 Sophia Antipolis Cedex, France
c
Safran Additive Manufacturing, a technology platform of Safran Tech, Rue des Jeunes Bois, Châteaufort, 78114 Magny-Les-Hameaux, France
Abstract
Numerical simulation is a powerful tool to understand the link between processing parameters and solidification conditions during the Laser Beam Melting (LBM) process. To be able to use this tool for microstructural control, numerical models need to be validated on a large set of experimental conditions, to ensure that the model describes the predominant physical phenomena. In this study, an experimental set of twenty tracks was produced in an Inconel 738 alloy, with a wide range of energy input and scanning speed. Experimental melt pool shapes were compared to the predictions of a multiphysics numerical model. In this model, the powder bed is considered as a continuum. The laser source is modeled with a Beer-Lambert absorption law, and surface tension, Marangoni force and recoil pressure are the driving forces for melt pool dynamics. This kind of model offers an efficient
computational time, but requires a calibration of the absorption coefficient and a
representative description of laser-matter interaction. In order to represent correctly heat and mass transfer during laser-matter interaction, the model needs to account for the loss of matter caused by the ejection of powder particles and spatters. A novel calibration method was
2
proposed to calculate the absorption coefficient. This method uses the experimental cross sections of the melt pools and a simplified analytical expression of energy balance. The use of this calibration method enabled a good agreement between experiments and calculations on a large process window. The values obtained by the calibrations resulted in a phenomenological expression of absorptivity coefficient with process parameters. Based on this expression, a comparison was made with another numerical model from literature using a time-consuming ray-tracing method in order to calculate the absorptivity coefficient. Similar results have been obtained, demonstrating the potential of the proposed approach to predict the melt pool shape and thus better understand the combined effect of laser-matter interaction and solidification in LBM process.
Keywords: laser beam melting, melt pool shape, finite element simulation, convection,
Nickel-based alloy
1. Introduction
Inconel 738 (IN738 LC) is a Nickel-based superalloy of great interest in aerospace industry, because of its excellent mechanical properties in high temperature environment, such as in aircraft engines, where parts undergo service temperatures higher than 900°C. As a consequence, the mastering of additive manufacturing (AM) of Inconel 738 parts by laser beam melting (LBM) is a real challenge. Indeed, the high sensitivity of Inconel 738 to solidification cracking as known from the welding community makes its manufacturing by LBM process critical. This alloy is difficult to weld, and hence it is also difficult to process additively. The challenge is then to identify appropriate LBM "process window" (set of process parameters) adapted to a fabrication without any defect.
3
In the context of AM-LBM, solidification cracking of Inconel 738 has been experimentally investigated in several studies, some of which focus on the influence of processing parameters. Cloots et al. (2016) have shown that the number of microcracks tends to decrease when the scanning velocity is increased while the beam power is maintained constant. Grange et al. (2020) have shown that the cracking is minimal when the material is processed with small melt pools with a strong overlap. They mentioned four contributing factors for solidification cracking: the extent of the mushy zone, the intensity of stresses in the mushy zone, a positive role of a fine grain structure and a positive effect of material remelting to avoid crack propagation.
Beside experiments, numerical simulation is a powerful tool to understand and control materials processing. The development of numerical simulation, assessed and validated by experimental observations and measurements, allows engineers to develop strategies to identify adequate process windows. However, it should be observed in LBM context that a very complex physics is at stake. Therefore, addressing directly the prediction of solidification cracking through numerical simulation might be a too ambitious objective, as this would require predictive models in laser/metal interaction, fluid flow, solidification, formation of microstructure, and thermo-mechanics in the semi-solid state. It appears then that a more progressive approach in numerical simulation development should be preferred, with a first assigned objective: a thermo-fluid numerical model capable of calculating a reliable description of LBM solidification conditions. Indeed, predicting the melt pool shape, the extension of the mushy zone, as well as the temperature gradients and cooling rates locally in the vicinity of the melt pool and in the mushy zone, is an obvious prerequisite before addressing thermo-mechanics. This is precisely the objective of the present paper: the evaluation of a multiphysics thermo-fluid simulation model by reference to experimental measurements, for LBM of Inconel 738.
4
Numerous experimental studies highlighted the complexity and the multiplicity of the physical phenomena at stake and show which ones are essential to consider in numerical models. Experimentally, Yadroitsev and Smurov (2010) demonstrated the influence of process parameters such as scanning speed and laser power on single track formation for different alloys, including IN625. They demonstrated that melt pool penetration into the substrate is required to stabilize the track building and avoid track irregularities of balling. Furthermore, the tracks shape and dimensions are largely influenced by surface tension and Marangoni forces. Bidare et al. (2018) used fast camera equipment to develop observations of tracks development and vaporization stage during LBM process for stainless steel. They demonstrated that this latter phenomenon highly influences the melt pool and particles dynamics. Wang et al. (2017) suggested that the observed liquid spattering is a consequence of the recoil pressure induced by vaporization combined with Marangoni effect using CoCr powder. Furthermore, as shown by Matthews et al. (2016), the recoil pressure is also partly responsible for the denudation on track sides. From this short literature review, it appears that a predictive numerical model should at least take into account the following physical phenomena: heat transfer, fluid flow, surface tension including Marangoni effect, and laser/matter interaction including vaporization effect.
The numerical simulation community has worked for several years to develop computational codes matching the previous requirements. Complex models have been developed to predict the melt pool and final track shape. Most of them consider the scale of powder particles, with an explicit description of every particle of the powder bed. Khairallah
et al. (2016) presented an arbitrary Lagrangian–Eulerian (ALE) multiphysics code to simulate
laser-matter interaction and fluid flow with an application to Ti-6Al-4V. The Marangoni effect and the recoil pressure are considered in order to predict denudation during the heating stage. Martin et al. (2019) used this model to provide better understanding of the occurrence
5
of porosities during the transition from a track to another one. Bayat et al. (2019) developed a similar multiphysics model and applied it to Ti-6Al-4V. They were able to get an accurate prediction of the melted zone dimensions compared to experimental observations. Aggarwal
et al. (2019) used a similar model on 316L stainless steel. They used the simulation to
understand the influence of the distance between the powder bed position and the focal plane of the laser beam on the resulting melting mode (conduction or keyhole). However, being based on an explicit discretization of the powder bed particles, and possibly ray-tracing for laser/metal interaction, all these approaches are still excessively time consuming to model track evolution. This limits length of simulation domains even more when the formation of multiple tracks and layers is considered, as in effective AM. In view of an efficient search for process windows, a reasonable computational time is required as well as the development of a reliable model. Consequently, the simulation model previously proposed in Queva et al. (2020) is considered in the present study. In this approach the powder bed is modelled as a continuum and a Beer-Lambert absorption law is assumed to consider the progressive absorption of laser energy in matter, which generates lower computational time than previous ones. Queva et al. (2020) reported that the CPU time required to simulate a single track is approximately 3.5 times smaller than with other approaches. However, as a counterpart, the laser absorptivity is a variable parameter which has to be calibrated. In this article, a novel method was proposed to calibrate the absorptivity coefficient, with a combination of semi-analytical reasoning and numerical simulations in order to investigate the effect of processing parameters on experimental melt pool cross sections.
The study reported here was structured as follows.
The evolution of the melt pool shape of IN738 was studied, for a wide range of LBM processing parameters. A set of twenty experiments was carried out under different laser power and scanning speed to provide a process window delimiting
6
parameters where the track is stable from those associated to keyhole or capillary instabilities. A study of mass transfer during the interaction between the laser beam and the powder bed was conducted, based on optical profilometry measurements, and revealed the necessity to account for metal ejections. This is reported in Section 2.
Experimental observations were compared with the predictions of the numerical model developed by Queva et al. (2020). A novel calibration method for the absorptivity coefficient of the numerical simulation was proposed, based on the experimental cross sections of the melt pool and a simplified analytical expression of energy conservation. This is reported in Section 3.
After calibration, numerical simulation results and experimental observations were compared for the whole process window, demonstrating the capabilities of the present numerical approach to provide an efficient prediction of the melted zone dimensions, in a wide range of process parameters, and with an efficient computational time. The transition from very low keyhole melt pool morphology to deep keyhole is presented. An investigation of the absorptivity coefficient evolution with processing parameters is proposed and compared with in-situ measurements from literature, showing a good agreement. This is reported in Section 4.
2. Experiments
2.1. Experimental protocol
All the experiments reported here were undertaken with a gas atomized powder of Inconel 738 LC, and a Concept Laser M2 machine. The particle size distribution is Gaussian, with diameter percentiles µm, µm and µm. The substrate is a
7
cylinder of mm diameter and mm height, previously fabricated with the same printer and the same material. The upper surface was then polished with 1200-grit paper and sandblasted to prevent the powder from sliding on the substrate. A powder layer was deposited with a rigid coater. The laser beam had a Gaussian power distribution, with a diameter set to µm while the laser power and the scanning speed varied respectively in the range W and mm.s-1
. Twenty tracks were built with a length of mm and a gap of mm between the centers of two adjacent tracks. The 1 mm gap guarantees that the melting of the different tracks are thermally independent, with no waiting time between the melting of two adjacent tracks. The process parameters are indicated in Table 1.
After irradiation, the substrate was scanned with an optical profilometer AltiSurf 500, before and after removal of the powder bed. The substrate was carefully moved from the building plate to the plate of the profilometer, to prevent any movement in the powder bed. A first scanning of the surface was done with the powder bed. Then, the powder bed was removed with a fine brush, before a second scanning. Measurements assessed a good
uniformity of the powder bed thickness, with a height of powder between and
µm. To measure the dimensions of the single tracks, the substrate was cut transversally to the scanning direction. Four cuts were distributed regularly along the track length, excluding mm at both extremities to avoid the initial and final transient regime of the melt pool. After a polishing down to µm, the shape of the melt pools was revealed with a glyceregia etching ( ml HCl + ml glycerol + ml HNO3, s by swabbing) and observed with an
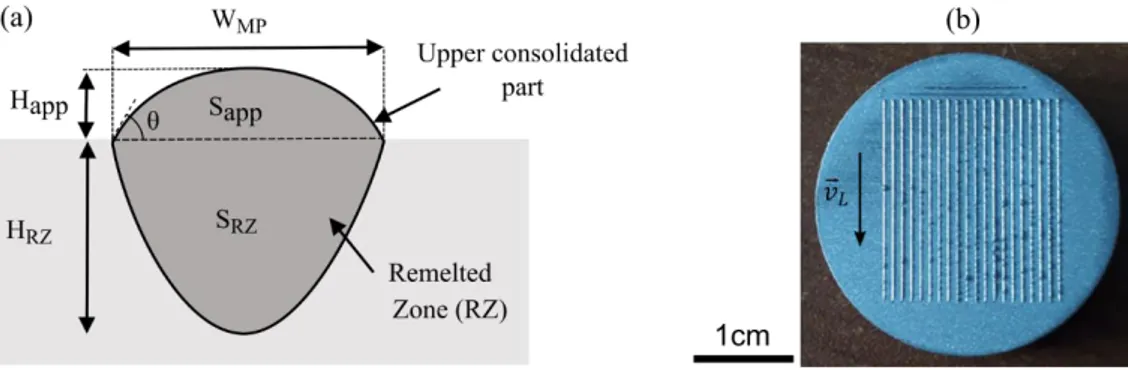
optical microscope. The following geometrical features are measured (Fig. 1): the melt pool width , the height of the remelted zone , the height of the upper (or apparent) part of the track , the total melt pool height and the areas of the upper part
8
Fig. 1. (a) Geometrical features of the tracks ; (b) Top view of the tracks on the substrate
after powder removal.
Table 1 - Process parameters investigated in present study. Cases are ordered by increasing linear energy.
# [mm.s-1] [W] [J.mm-1] # [mm.s-1] [W] [J.mm-1] 1 1350 280 0.21 11 315 115 0.37 2 570 120 0.21 12 1000 370 0.37 3 380 85 0.22 13 225 96 0.43 4 960 230 0.24 14 730 340 0.47 5 750 180 0.24 15 300 140 0.47 6 1075 275 0.26 16 500 310 0.62 7 1100 320 0.29 17 360 230 0.64 8 430 125 0.29 18 385 265 0.69 9 685 210 0.31 19 455 385 0.85 10 800 260 0.33 20 245 215 0.88
2.2. Melt pool shapes and process windows
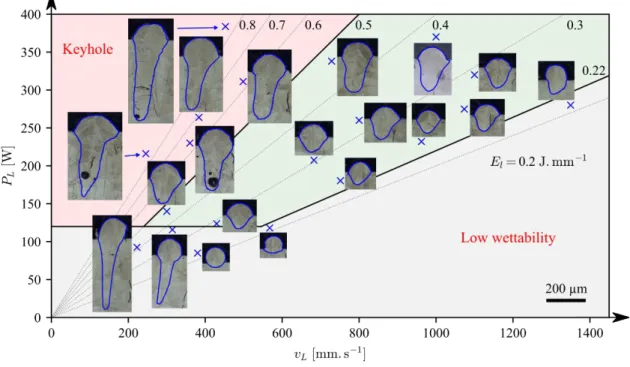
A transversal cut of every track is displayed on a ( ) diagram in Fig. 2. Firstly, a small angle of about 6° exists between the centerline of the tracks and the vertical. This is due to the inclination between the laser beam and the vertical, linked to the position of the
9
melt pools and in the substrate. This is actually not surprising, as Inconel 738 LC is known to be prone to solidification cracking (Cloots et al., 2016). Most importantly, a variety of melt pool morphologies are visible on the diagram. These morphologies can be firstly described as a function of the incident linear energy (in J.mm-1), whose isovalues are
represented with oblique dotted lines.
Fig. 2. Process window defined with the results obtained on a representative cross section for each processing
parameters investigated.
For intermediate linear energies ( J.mm-1
), the tracks have a reasonable penetration in the substrate, showing a ratio between 1 and 3. A
sufficient remelting is indeed important to avoid a lack of fusion and for the repair of defects. For high linear energies ( J.mm-1
), the tracks have a keyhole shape and a deep penetration with a ratio . As visible on the figure, pores are particularly
frequent in that domain, making it inadequate for fabrication. At low linear energies, when J.mm-1
, the tracks have a low penetration in the substrate and a high wetting angle ( °). Due to the surface tension, single tracks with a high wetting angle can be
10
subjected to instabilities and therefore show an increased variability of their dimensions along their length. An estimation of the variability of the dimensions with several cuts is particularly necessary in that domain. Note that at a low laser power ( W), a region is observed where the tracks both have a low wettability and a keyhole shape. This region was arbitrarily included in the domain of low wettability, in grey.
The mean dimensions of the melt pools are presented in Fig. 3(a), whereas their dispersion, defined as the ratio of the standard deviation to the mean, are displayed in Fig. 3(b). As expected, the dispersion is the highest in the low wettability domain. Both the
apparent part and the remelting zones have highly varying shapes, with a dispersion of up to 30% and a dispersion of sometimes over 60% (around 45% for
). On the contrary, the melt pool width remains quite stable in that region, with a
dispersion under 15%. Qualitatively, all dimensions increase with the incident linear energy , although the increase is limited for . The limits of the domain
defined above are reported on the graphs with dotted lines. It can be seen that the green domain of Fig. 2 corresponds to the region with a good stability of the melt pool and still a limited penetration.
11
Fig. 3. (a) Melt pool dimensions and (b) their variability as a function of processing parameters (cubic
12
The objective of the article is to discuss the effect of the processing parameters on the melt pool shape. First, experimental data were investigated using approximate analytical models, enabling a first evidence of prevailing phenomena and a discussion on energy and mass conservation. Second, relevant multiphysics numerical simulation was used to provide a quantitative prediction of the melt pool shapes. This second part focuses particularly on the green region in Fig. 2.
Several analytical models – actually applied to dense material – aim to represent the melt pool dimensions. Hann et al. (2011) demonstrated that the melt pool depth with different materials and processing parameters collapse to one curve when plotted as a function of a normalized enthalpy:
√ (1)
The specific enthalpy at melting (solidus) temperature is noted ) and corresponds to the absorbed energy divided by the mass of the characteristic diffusion volume, where is the absorptivity and the thermal diffusivity. A description of the melt pool depth with this model may seem surprising at first sight, because it only considers
conductive thermal transfers, whereas the melt pool depth is known to depend significantly on other phenomena, as recoil pressure. In a study by King et al. (2014), the depth of melt pools produced by LBM was also found to be a function of the normalized enthalpy. Normalized enthalpy was also successful in describing keyhole transition, which highly depends on recoil pressure. They showed with an analytical thermal model that the normalized enthalpy was proportional to the peak temperature at the center of the beam:
13
For that reason, the effect of saturated vapor pressure on the melt pool shape becomes significant when the peak temperature exceeds the boiling temperature, i.e. when the
normalized enthalpy exceeds a certain value. In our experiments, only and are variable, the melt pool depth should be then, according to Eq. (1), a function of √ . On the
contrary, Moniz et al. (2019), in a study of LBM process applied to ceramic materials, proposed a model in which the melt pool dimensions do not depend on the peak temperature, but rather on the linear density of energy absorbed by the material, . However, it should be noted for ceramic material that the incident energy of the laser beam accumulates in the material due to low thermal diffusion. The melt pool corresponds to the area where the local energy absorbed reaches the melting enthalpy. According to that model, melt pool dimensions should not depend on √ , but rather on .
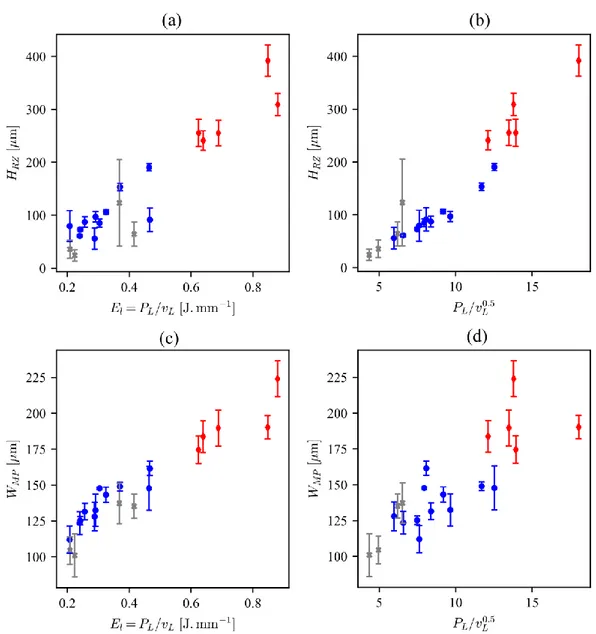
Considering the present experimental results, the width of the melt pool and the height of the remelted zone are plotted both as a function of and √ (Fig. 4). Different marker colors and types are used for the melt pool, depending on the domain presented in Fig. 2. As in the studies previously cited, the values of globally collapse to one curve when plotted as a function of √ , whereas they are much dispersed when plotted as a function of the incident linear energy. This could imply that due to the recoil pressure, the melt pool depth is much more affected by the peak temperature of the melt pool than by the total amount of incident energy. The impact of the recoil pressure on the melt pool shape will be further investigated in section 3. Due to an evolution as a function of √ ,
increases with an increase of the scanning velocity while the linear energy is kept
constant, see for example the melt pools with J.mm-1
on Fig. 2. On the contrary, the melt pool width does not seem to evolve as a function of √ but is better described by the
14
incident linear energy . This dimension seems to be less linked to the peak temperature than to the amount of incident energy.
Fig. 4. Evolution of a-b) the height of the remelted zone and c-d) the melt pool width as a function
of the incident linear energy and of . Red dots belong to the keyhole domain and grey dots to
the low wettability domain. Blue dots are associated to the stability domain The error bars correspond to the standard deviation.
15
2.3. Energy and mass transfer
The two characteristic sections and are related to energy and mass
transfer and their conservation during the laser beam interaction. Indeed, is the volume of
molten metal per unit length of the single track and is therefore a consequence of the amount of energy absorbed by the melt pool. The section is the volume of consolidated powder
per unit length of the track. A good understanding of the energy and mass transfers during the irradiation is necessary to model accurately the process. In the following section, we discuss the experimental values of and and the consequences regarding process numerical
simulation.
Energy conservation
Let us consider a melt pool with a section that reaches a mean temperature . The enthalpy increase per unit of track length is then ( ), where is the specific enthalpy and the room temperature. Under the approximation that most of the beam energy is absorbed by the melt pool, the energy balance can be written:
( ) ( ) (3)
where is the minimal linear energy to create a melt pool. Such a first order relationship
can be assessed by plotting (experimental values) as a function of in Fig. 5(a). It is
visible that is close to J.mm-1
. However, the alignment of the dots is not perfect and a significant difference of melt pool transverse section is observed for tracks having similar values of incident linear energy. A possible explanation is that the absorptivity varies significantly with the processing parameters, as it was observed for example by
Cunningham et al. (2019). As absorptivity increases with the laser beam power and decreases with scanning velocity and considering the evolution measured by Trapp et al. (2017), we
16
propose the following expression in the range of processing parameters: (
) . Moreover, we propose a further approximation that the mean temperature of the melt is constant in first order. Under these assumptions, should be proportional to (
) ( ). Interestingly, Fig. 5(b) shows that with , ,
and J.mm-1
, the points obtained for very different regimes almost perfectly align. The evolution of absorptivity suggested here will be discussed later in the article, thanks to numerical simulation.
Fig. 5. Melt pool transverse area vs two functions of process parameters, for the whole experimental tests.
Mass conservation
During the interaction between the laser beam and the powder bed, particle dynamics is complex. Bidare et al. (2018) employed high speed imaging to observe the vapor plume, the argon gas flow and their effect on powder particles movements. They highlighted that numerous particles are entrained by the gas flow, some of which are drawn in towards the melt pool, while others are blown away. Moreover, some metal is ejected during fusion, as spatters. As the objective is to predict the dimensions of the consolidated tracks, experimental
17
evidence of the extent of such mass transfers is required. Particularly, ejections of matter affect the amount of metal consolidated in the track.
We based an analysis detailed hereafter on profilometry measurements on a single track, with W and W (referred as ). The surroundings of the track are scanned before and after removal of the powder. Fig. 6(a) displays the transverse profile of material height at four different locations along the track, before and after removal of powder. For each location, the profile was averaged on a length of 3 mm in the scanning direction, to reduce dispersion.
It is visible that the original powder bed thickness of µm was modified during the interaction with the beam, as a result of powder consolidation by melting and ejections. No complete denudation is observed on both sides of the track as this latter is still covered with powder. This is in line with the observations of Bidare et al. (2018). They noted that
denudation decreases with an increase of the powder bed height. For a powder bed thickness around µm, they noticed that powder particles roll towards the track without leaving a completely denudated area. In the present case, the powder has a good ability to flow and the powder bed thickness is significantly higher than the track height. Consequently, the single track is covered with powder after the interaction with the beam.
The area of powder bed left empty after the beam interaction is called (Fig. 6(b)). We propose to discuss the significance of material ejection with a comparison between
and . The mean values measured on the four transverse profiles are µm² and µm². Let us suppose first that there is no material ejection (i.e. no ejected
powder particles and no spatters). In permanent regime, these two sections are linked by the porosity of the powder bed (cf. Eq. (6) in development below). This leads to a porosity of , which is not possible, as this value is significantly
18
higher than the porosity of poured powder ( ). As consequence, there is obviously a significant matter loss. To estimate the loss of matter, a powder bed porosity of was assumed. In fact, it should be noted that the density is difficult to estimate as it depends on several parameters as the coater or the fluidity of the powder, etc. Nevertheless, the reasoning is still valid with a value of the porosity value and and the sensitivity of the result to that parameter will be calculated. Fig. 7(a) represents the volume of
interaction , defined as the volume in which powder particles are likely to be ejected or molten. The volumes of ejected and molten powder are respectively noted as and as shown on Fig. 7(a). The consolidation transforms the porous
volume of powder into a volume of dense matter , which is either
blown away as spatters ( or participates in the creation of the apparent part of the track ( ): . After scanning by the laser beam, a volume
of the powder bed is left empty. The rearrangement of the powder bed by rolling of
particles is considered isovolumic without modification of , as shown in Fig. 7(b). The expression of is then:
(4)
The fraction of useful material can then be calculated. This parameter is defined as the
ratio of the quantity of matter which is consolidated, , per the quantity of matter which is
either consolidated or lost as powder ejections, , or lost as spatter :
(5)
The value of is comprised between zero and one: zero corresponds to a situation where
no track forms and one to a situation with no matter loss by particle ejections or spatters. Using (4), we obtain:
19
( )
(6)
A porosity of powder bed gives a fraction of useful material . The
fraction of metal consolidated in the track after interacting with the laser beam is rather small. Moreover, this conclusion is not affected by the uncertainties about , as values of the
porosity and give respectively and . For this track, a significant amount of metal is either ejected as powder particles or as spatters. This result is not surprising, considering the extent of ejected material observed by Bidare et al. (2018).
Fig. 6. Height of material around the track before and after removal of the powder: (a) transverse
profiles at four different locations on the track, (b) identification of the transverse sections and on the
mean profile.
(a) (b)
Fig. 7. Schematic representation of mass transfers: (a) during the interaction between the laser beam and the
20
The analytical models demonstrate their interest to interpret the experimental result and understand some of the physical phenomena at stake. Nevertheless, these models are not fully satisfactory to describe the melt pool dimensions in the whole domain. Indeed, both the complete melt pool shape evolution and the thermal gradients responsible for the occurrence of defects such as hot cracking cannot be predicted with analytical models. Consequently, in the following section, a multi-physical model was used to predict quantitatively the
dimensions of the melt pools.
3. Simulation of the melt pool shapes: numerical model and calibration method
3.1. Numerical model
A continuous-mesoscale finite element model thereafter applied to simulate the development of the set of single tracks was previously proposed for the investigation of melt pool development on metallic alloys during LBM process (Queva et al., 2020). This model relies on a level set (LS) formulation of conservation equations. Basically, the simulation domain is shared into two parts associated with the metallic material and the protective atmosphere. The metallic material includes the substrate, the powder bed, the melt pool and the solidified bead. The use of a continuous-mesoscale approach aims at considering the powder bed as a continuum with homogenized properties in order to limit high computation costs (Chen et al., 2017).
The LS method is relevant to follow the spatial and temporal evolution of the metal/gas interface caused by the fusion/solidification steps endured by metallic material during building, also considering capillary and vaporization effects along the melt pool surface. Since the powder bed is assumed as continuous, the apparent density, thermal conductivity and dynamic viscosity have to be evaluated depending from local temperature and material state. This approach aims at simulating the thermo-mechanical evolution of material during process to follow track development. Heat transfer and fluid flow are
21
consequently computed in the entire domain. For the present paper, only the relevant features are mentioned and described hereunder. More details are provided in Queva et al. (2020) for interested readers.
Thermal evolution
Heat transfer is obtained as the solution of the non-steady equation for energy conservation:
𝜕{ }
𝜕𝑡 ∇ ∙ { }𝒖 ∇ ∙ {𝜆}∇ 𝑞̇ 𝑞̇𝑣 (7)
where is the density, is the specific enthalpy, 𝒖 is the velocity field obtained after the resolution of Navier-Stokes equations. 𝜆 is the thermal conductivity and is the temperature field. The right hand side terms 𝑞̇ and 𝑞̇𝑣 represent respectively the heat source input induced
by the laser and the heat loss due to vaporization. The brackets correspond to the mixture of quantities associated to metal and gas domains as developed in a LS approach. Both fusion and solidification phase changes are coupled with the resolution of this non-linear equation. The accurate modelling of the laser power input 𝑞̇ , is crucial to compute relevant melt pool evolution and final shape since phenomena such as capillary effect and recoil pressure, which are highly temperature dependent, govern melt pool dynamics. However, laser interaction should be distinguished between surfaces associated to powder material and liquid metal. For the laser/powder interaction, multiple reflections occur due to the interactions between
powder particles and radiation when the laser beam penetrates the powder bed. Consequently, a volume heat source following the Beer-Lambert law was used to model the volume source:
𝑞̇ 𝑟 exp ( 𝑟 𝑟 ) 𝛼 exp ( ∫ 𝛼 𝑑𝑙 𝑧 ) (8)
22
where and 𝛼 are respectively the absorptivity and the local absorption coefficient, and 𝑧 is the distance below the gas/metal interface. For the laser/liquid metal interaction, high and local absorption of laser energy should impose to use an expression restricted to the metal surface. However, in practice, Eq. (8) may be used with a high value of absorption coefficient for the liquid phase 𝛼 to ensure consistency with the surface expression provided in
literature.
Hydrodynamic evolution
The melt pool dynamics is modeled by the momentum conservation equation (Navier-Stokes equation):
{ } (𝜕𝒖
𝜕𝑡 𝒖 ⋅ ∇ 𝒖) ∇ ⋅ {𝝈} 𝒇𝑣 (9)
where 𝝈 is the stress tensor and 𝒇𝒗 is the total volumetric force, including surface tension, Marangoni force, recoil pressure and gravity. The stress tensor is directly related to the strain-rate tensor and consequently to the velocity field 𝒖 by a Newtonian behavior law with the dynamic viscosity 𝜇. Eq. (3) is coupled with the mass conservation equation:
∇ ⋅ 𝒖 ̇ (10)
where ̇ represents the negative volume expansion rate associated with the transition from powder to dense material, which is supposed to occur in a certain temperature range. The velocity 𝒖 is evaluated to follow the gas/metal interface when updating the LS function, by solving the transport equation:
𝜕𝜓
23
However, after the transportation stage, the eikonal property (||𝜓||=1) is not respected anymore. A geometric reinitialization method is used (Shakoor et al., 2015) to recalculate the distance function with respect to the position 𝜓 obtained after the resolution of Eq. (5). Furthermore, the LS method involves mass conservation issues. Therefore, a method reported in literature (Zhang et al., 2019) has been applied presently to overcome this drawback. Anisotropic mesh adaptation techniques, based on error estimation, are used to optimize the CPU time cost.
3.2. Material properties
The material properties of IN738LC and the gas are described in Table 2. The properties related to enthalpy evolution and phase changes are evaluated with Thermocalc software and NI25 database (Thermo-Calc, 2020). Thermal conductivity of the bulk material is calculated with JMatPro® (JMatPro, 2020) software and properties of the material in liquid state are taken from experimental studies. To evaluate the thermal conductivity of the powder bed 𝜆 , the model developed by Zehner and Schlünder (1970) is used which considers the thermal conductivity of bulk and gas, thermal contacts and radiations:
𝜆 𝜆𝑔 √ √ 𝛽𝐵 [ 𝛽 𝐵 𝛽𝐵 ln (𝛽𝐵) 𝐵 𝐵 𝛽𝐵] (12) where 𝛽 𝜆𝑔 𝜆 and 𝐵 10/9.
As illustrated in the study of Queva et al. (2020), below solidus temperature, the dynamic viscosity for powder and dense phase is assumed constant (10 Pa.s and 1000 Pa.s respectively). During the phase change, the dynamic viscosity decreases exponentially with temperature. Finally, when the temperature exceeds the liquidus temperature, the dynamic viscosity remains constant at ⋅ − Pa.s.
24 Table 2
Material properties for IN738LC and gas.
Property Symbol Value Unit Reference
IN7
38
LC
Solidus, liquidus, boiling temperature , , 𝑣 °C Thermo-Calc, 2020 - lever rule rule)
Absorption coefficient of powder, liquid
𝛼 𝛼 25, 100 mm-1
-
Density solid/liquid , 7659, 7118 kg.m-3 Thermo-Calc, 2020 Heat capacity of solid/liquid phase , , J.kg-1.K-1 Thermo-Calc, 2020 Latent heat of fusion 𝐿 ⋅ 6 J.kg-1.K-1 Thermo-Calc, 2020 Latent heat of vaporization 𝐿𝑣 ⋅ 6 J.kg-1 Thermo-Calc, 2020 Thermal conductivity of bulk 𝜆 ⋅ [0, ] W.m-1.K-1 JMatPro , 2020
⋅ [ ]
Surface tension coefficient at melting 𝛾 N.m-1 Quested et al., 2009 Marangoni coefficient 𝜕𝛾 𝜕 ⋅ −4 N.m-1.K-1
Liquid dynamic viscosity 𝜇 ⋅ − Pa.s Mills et al., 2006
Ga
s
Density 𝑔 kg.m-3 Dry air properties, 2020
Heat capacity 𝑔 J.kg-1
Thermal conductivity 𝜆𝑔 W.m-1.K-1
Dynamic viscosity 𝜇𝑔 ⋅ −4 Pa.s
The absorption coefficient 𝛼 of the powder bed has little influence in steady state, as most of the incident energy then irradiates the liquid surface of the melt pool. However, this absorption coefficient has an importance when the laser beam starts to irradiate the powder bed, at the very beginning of scanning. The value of 𝛼 is chosen so that a significant proportion of the energy reaches the substrate. The absorption coefficient in the liquid corresponds to a very low characteristic distance of energy penetration ( 𝛼 µm). The interaction is indeed close to a surface interaction, as the dense material is opaque at the wavelength of the laser beam.
25
3.3. Simulation of case
The scope of this paper is to validate simulation on processing parameters interesting for fabrication. For that reason, the comparison is focused on cases with a good track stability and without a deep keyhole shape (selection of cases located in the green region on Fig. 2). The laser parameters are resumed in Table 3.
Table 3
Laser parameters ( , ) in the process window delimited in Fig. 2 providing track stability as shown in Fig. 3.b and chosen for comparisons between numerical simulations and experiments.
Case number # 4 5 6 7 9 10 12 14 (mm.s-1) 960 750 1075 1100 685 800 1000 730
(W) 230 180 275 320 210 260 370 340 (J.mm-1) 0.24 0.24 0.26 0.29 0.31 0.325 0.37 0.47
The configuration case #4 was firstly investigated with W and mm.s-1 noted . The whole simulated domain is shown in Fig. 8 with overall
dimensions 2 0.5 1.1 mm3. The previous section highlighted the significance of ejections during laser beam interaction. The present model treats the powder bed as a uniform medium and thus does not account for entrained particles due to gas flow. Therefore, the chosen value of the powder bed thickness is significantly lower than the experimental one, to account for the metal ejections outside the simulated domain. A layer of powder with thickness of 55 µm and porosity of 50 % is deposited on the substrate. The laser beam develops linear scanning with constant velocity. The trajectory evolves from initial position 𝑥 𝑦 mm to final position mm.
26
Fig. 8. Simulation domain with temperature field and melt pool shape obtained for .
The initial temperature is set to 20°C. For the thermal resolution, adiabatic boundary conditions are applied on each face of the total domain. For the resolution of melt pool dynamics, a pure sliding condition is considered along the four lateral faces; a sticking condition is imposed along the lower face; and the upper face is free, allowing gas input or output. The total number of elements evolves from 1 750 000 at the start to 2 000 000 at the end of the simulation in order to keep a good track morphology representation.
Regarding data reported in previous studies (Mayi et al., 2020), a first value of absorptivity is set at 0.3. The comparison between the numerical simulation and the experiments is shown in Fig. 11(a) and Table 4.
27 Table 4
Differences on the melted zone morphology between experimental and numerical results before calibration for case #4 ( ). DIFF= (NUM-EXP)/EXP represents the relative error between experiments and
simulation in percent.
Case #4 Unit EXP NUM DIFF (%)
µm 45 43.7 -2.9 µm 70 8.9 -87.3 µm 115 52.6 -54.3 µm 125 88.6 -29.1 µm2 9252 3772 -59.2
Significant differences in the melted zone shape are observed between simulation and experiment. Indeed, the various dimensions predicted by the numerical simulation
underestimate results experimentally achieved.The heat input is clearly insufficient to melt enough matter to reach the expected dimensions. Furthermore, the deviations are too large to assume that differences are related to an error in estimation of material properties.
3.4. Calibration of absorptivity coefficient
The absorptivity value of 0.3 previously proposed corresponds to the case of a laser interacting perpendicularly with a perfectly plane metal surface (Trapp et al. 2017). As illustrated in Fig. 9(a), this case is encountered in conduction mode, where vaporization weakly occurs or is negligible. Due to surface tension forces, the melt pool shape is globally smooth and consequently, as shown in Fig. 9(a), the laser energy is reflected after striking the melt pool back to the gas. However, vaporization phenomenon is usually observed in SLM process, as reported in the introduction. Consequently, the recoil pressure induced by vaporization generates a keyhole where the laser beam penetrates deeply the melt pool.
28
Fig. 9. Schematic of laser multiple reflections for (a) conduction mode and (b) keyhole mode leading to an
enhancement of laser matter interaction.
Consequently, its morphology cannot anymore be assumed as planar. Considering the melt pool morphology as shown in Fig. 9 (b), multiple reflections take place in the capillary. Therefore, the fraction of laser energy reflected back to the gas and definitely lost in
conduction mode, returns to the melt pool in keyhole mode and increases the amount of absorbed energy. Consequently, the apparent absorptivity of the material is increased. Furthermore, Trapp et al. (2017) have measured for stainless steel 316L the evolution of absorptivity with respect to laser power for a fixed laser scan velocity. They demonstrated that the capillary topology is responsible for an increase of the apparent absorptivity, associated with increasing laser power energy absorption.
Different approaches have been proposed in the literature to model and simulate multiple reflections of laser wave. Generally, the ray-tracing method is used to provide a precise repartition of the energy introduced into the material (Khairallah et al. 2016). This method uses Fresnel’s laws to deduce the light ray paths also considering the transmittance and the absorbance of the material depending on the light ray incidence angle. However, this method is generally costly in a 3D simulation context. In the present paper, a calibration methodology is used to provide an estimation of the absorptivity coefficient and efficiently compare experimental measurements and numerical simulation. An increase in the
29
absorptivity value leads to a larger amount of energy delivered to the material. Consequently, the melted zone enlarges. Moreover, as shown inFig. 10, an affine relationship is observed in the study range between the transverse area of the melt pool ( , perpendicular to the laser
scan direction) obtained in numerical simulation and the absorptivity input value. This affine relationship is also consistent with the simplified energy conservation model, discussed in section 3 (cf. Eq. (4)). For the present configuration, this leads to a proposed value of 0.72 for the absorptivity, to match the experimental value of .
Fig. 10. Influence of absorptivity on the predicted melted area for .
Consequently, according to this linear dependence, two numerical simulations with different values of the absorptivity coefficient are sufficient to determine the absorptivity coefficient providing relevant comparisons with experimental observations.
3.5. Comparison of the experimental / simulated melt pool shape
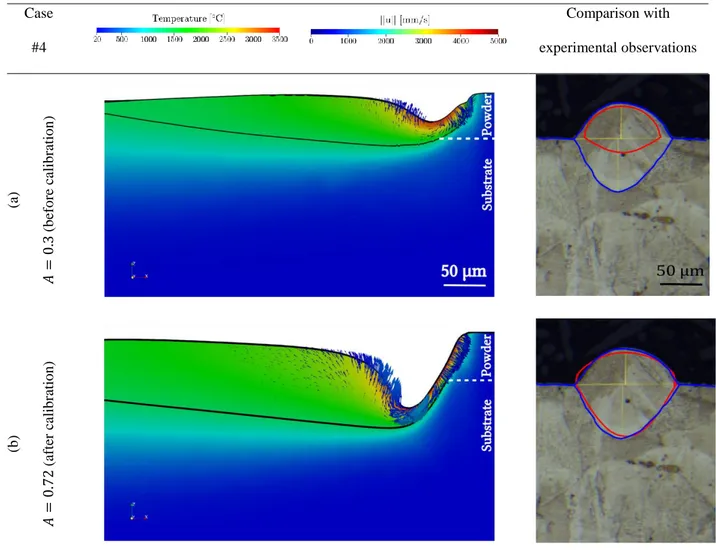
After calibration of absorptivity as described above, Fig. 11(b) and Table 5 illustrate the comparison of the predicted melt pool shape and the experimental observation with a calibrated value for absorptivity of 0.72.
30
Contrary to the previous simulation (for which ), the model predicts more accurately both the track shape and the associated dimensions. Indeed, an increase in input energy is observed when increasing absorptivity coefficient. More energy is available to melt matter and larger dimensions in melted domain are achieved. In addition, since more energy is provided, higher temperatures are observed in the melt pool.
As a result, the recoil pressure induced by vaporization is more intense, leading also to an increase of the melt pool depth and the global track dimension as explained previously by
Queva et al. (2020). This result demonstrates the importance of accounting for the multiple reflections phenomena into the keyhole to obtain a good agreement with experimental observations. Consequently, the calibration of absorptivity was repeated for every simulated case in Table 3, leading to different values of absorptivity.
Table 5
Differences on the melted zone morphology between experimental and numerical results before and after calibration for case #4 ( ).
Case #4 Unit EXP NUM (after calibration) DIFF (%) µm 45 43.6 -3.1 µm 70 67 -4.3 µm 115 110.6 -3.8 µm 125 116 -7.2 µm² 9252 9038 -2.3
31 Case #4 Comparison with experimental observations (a) (b ef o re ca lib ratio n ) (b ) (af ter ca lib ratio n )
Fig. 11. Comparison between numerical results (red) and experimental observations on optical micrograph on
cross-sectional view (blue) for case #4 (a) before and (b) after calibration. The scale bar is common for each image.
3.6. Application to the whole experimental plan: comparison with observations
Fig. 12 compares on cross-section views the results given by the numerical simulation with the experimental observations in the process window. A good agreement is obtained between numerical and experimental results in the whole process window. Indeed, from a configuration with a low linear energy (0.24 J/mm) to a configuration considering a significant linear energy value (0.47 J/mm), the model is able to predict both the melt pool dimensions and morphology. Fig. 13 presents quantitatively the comparison of the results obtained by the present model with experiment. As shown in Table 6, a good agreement is obtained between numerical simulation and experiments for 𝑯𝒂𝒑𝒑, 𝑯𝑹𝒁, 𝑾𝑴𝑷 and 𝑺𝑴𝑷.
32
Indeed, for 𝑯𝑹𝒁, 𝑾𝑴𝑷 and 𝑺𝑴𝑷 the maximum of deviation between numerical and
experimental results are lower than 8%. Moreover, the mean value of the deviation of each dimension does not exceed 6.6%. It has to be noted for case #14 that the powder bed height has been raised from 55 to 70 µm. This will be discussed in the next section.
Fig. 12. Comparison between numerical and experimental results in the process window. The blue and red
contours represent respectively the boundary of the experimental and simulated melted zones in a cross section of the track, after solidification.
Table 6
Differences on the melted zone morphology between experimental (average of the different measures, noted M(EXP)) and numerical results for cases from Table 3. DIFF is still calculated in percent.
Case
𝑯𝒂𝒑𝒑 [µm] 𝑯𝑹𝒁 [µm] 𝑾𝑴𝑷 [µm] 𝑺𝑴𝑷 [µm2]
M(EXP) NUM DIFF M(EXP) NUM DIFF M(EXP) NUM DIFF M(EXP) NUM DIFF #4 53.75 43.6 -18.8 70 67 -4.3 125.3 116 -7.7 10530 9038 -14.2 #5 57 44.2 -13.7 61 57 -6.6 123.5 115 -6.9 9791 11290 5.1 #6 55 49.5 -10 87 82 -5.7 132 121.5 -8.0 12218 10676 -12.6 #7 60 50.3 -16.2 97 100 3.1 133 132 -0.8 14277 12956 -9.3 #9 61.25 51.2 -16.4 85 80 -5.9 147.8 150 1.5 14501 14698 1.4 #10 59.75 50.7 -15.1 106 108 1.9 143.3 144 0.5 15477 15435 -0.3 #12 60 52.6 -12.3 153 149 -2.6 149 151 1.3 21318 20027 -6.1 #14 77 74.7 -3.0 191 184 -3.7 148 150 1.4 25867 23768 -8.1
33
(a) (b)
(c) (d)
Fig. 13. Evolution of (a) the apparent height , (b) the melt pool depth , (c) the apparent width and
(d) the melted melt pool area as a function of the linear energy ).
Comparisons are obtained between experimental observations and numerical results on cross-section views on the left side in Fig. 14.On the right side of the same figure,the keyhole mode transition as linear energy increases is illustrated in longitudinal section snapshots. These comparisons are obtained for cases of interest from Table 3. The model demonstrates the capacity to simulate melt pool dynamics from low keyhole geometry to deep ones. As explained in the last part, stronger recoil force is applied to the gas/melt pool
interface due to higher temperatures encountered as linear energy increases. Furthermore, it can be observed that the velocity magnitude reaches 5 m.s-1, which is consistent with the
34
maximum values reported by Ly et al. (2017) for Ti-6Al-4V. It is also consistent with the values found by Bayat et al. (2019) for IN718.
Case
Comparison with experimental observations #4 – #5 – #6 –
35 #7 – Case
Comparison with experimental observations #9 – # 10 – # 12 –
36 # 14 –
Fig. 14. Comparison between numerical simulation and experiments on cross-sections and snapshots of the melt
pool morphology transition as linear energy increases. The red and blue contours represent respectively numerical and experimental results. The black contour represents the melt pool shape.The scale bar is the same
for each comparison case.
4. Discussion
4.1. Melt pool dimensions
Even if the present model is able to predict correctly the melt pool dimension, it tends to slightly underestimate the apparent height . One of the possible explanations is that some particles are drawn from both sides of the track toward the melt pool, as observed by
Bidare et al. (2018). Here, because the powder bed is modelled as a continuum, this effect is not considered in the simulation, leading to an underestimation of . Particles dynamics with movements towards the melt pool and away from the melt pool could be an impacting phenomenon and should be consider to provide accurate estimation of on the whole
process window.
Moreover, for the numerical case with the highest linear energy (case #14 ), as explained in the previous section, since the apparent height measured experimentally is much higher than the other cases investigated in the process window, a slight modification has been brought to the model by modifying the powder bed thickness for the simulation (55 µm to 70 µm) to enhance the calibration of the numerical simulation. Some assumptions can be advanced in order to discuss this observation and explain this choice.
37
Matthews et al.(2016) consider that the denudation zone enlarges as laser power increases. Consequently, the proportion of ejected powder due to depression, of spatters generated from the melt pool and of powder entrained into the melt pool may evolve as laser power increases. However, despite that consideration, the constant powder bed thickness (55 µm) allows to predict accurately the melt pool dimensions of most cases.
The present model helps in understanding the influence of the laser power or the laser scan speed on laser-matter interaction, melt pool dynamics and finally the final bead shape obtained. For instance, for couples with similar linear energy (0.24 J.mm-1 for cases #{1,2} and 0.46 J.mm-1 for case #{14,15}) a larger melted area and a higher melt pool depth are obtained. Indeed, for the case with the higher value of laser power and more importantly velocity, the keyhole wall angle tends to increase and modify the keyhole morphology as demonstrated by Cunningham et al. (2019). Therefore, it enhances the laser rays due to multiple reflections to merge to the center of the keyhole, increasing the global absorptivity of laser energy and finally the melt pool depth as explained in the last paragraph.
4.2. Evolution of absorptivity coefficient
Fig. 15 illustrates the absorptivity values used after calibration compared to
experimental measurements obtained by Trapp et al. (2017) with a 316L steel. It is important to note that for all the measurements reported by Trapp et al., the laser scan speed was fixed at 1500 mm/s. A first comparison is done in Fig. 15(a), consisting in simply plotting as a
function of , despite the fact that the eight calibrated values of the present study are obtained for different scan velocities. It can be seen on this first chart that the present calibrated values are somewhat higher than the experimental ones. However, when plotting now as a function of the linear energy , in Fig. 15(b), we observe a better coherence between the different values: the values of the present study – generally obtained for higher
38
(a) (b)
(c)
Fig. 15. Comparison between numerical absorptivity coefficient obtained after calibration by the present
numerical simulation, and experimental measurements made by Trapp et al. (2017).
Nevertheless, dots are not well aligned on Fig. 15(b), showing that absorptivity is probably not a function of the linear energy, but of more complex function of and . In section 2.3, it is shown that a good description of the evolution of is achieved with an absorptivity having the following expression: ( ) . Therefore, Fig. 15(c)
shows a chart in which is plotted against with and , for both Trapp
et al. and present calibrated values. It is remarkable that, excepting the domain of lower
energy, for which keyhole does not appear, the whole set of values is now almost perfectly aligned, demonstrating the relevance of proposed expression for :
( ) (13)
This suggests that the laser power has probably a stronger effect on the absorptivity than the scanning velocity. This is consistent with the fact that absorptivity is affected by the recoil pressure and thus by the peak temperature.
39
4.3. Comparison with another numerical simulation
The configuration investigated by Bayat et al. (2019) was considered. The process parameters used by Bayat et al. such as laser power (285 W), velocity scan (960 mm.s-1) or deposited powder height (40 µm) are used also for this comparison. It is first underlined that this configuration is addressed by numerical simulation for the alloy IN718, and not IN738LC as in the present study. However, the thermophysical properties of the two alloys are
sufficiently close to make this comparison relevant. An interesting point is that the approach of Bayat et al. differs from the present one essentially by two points: i) an explicit description of the particles of the powder bed, and ii) a ray-tracing approach to model the
multi-reflections of the laser beam.
Fig. 16(a) illustrates the results of Bayat et al., as extracted from their article: melt pool shape at time 0.7 ms and three cross-section views showing the formation of the track.
Fig. 16(b) shows the results from the present model. A good agreement was obtained both on the temperature distribution in the melt pool and on its dimensions in the different cross-sections. First, from the capillary front to the tail of the melt pool, the temperature distribution between the two simulations is substantially the same, with temperature exceeding 3000 °C where the laser is heating. Second, on the different cross-section views, more precisely at = [300, 400, 500] µm from the beginning of the track as shown in the right part of Fig. 16, the maximum of relative deviation between the two models for the total melt pool height is 12.1%. For the melt pool width (considering Bayat et al. notations), the maximum of deviation is 4.9%.
However, there are some differences, first in the diffusion of heat through the powder bed around the melt pool. Diffusion is more rapid in the simulation of Bayat et al. than with the present approach. Looking at the right part of Fig. 16, it can be noticed that the powder bed generated by the DEM method in Bayat et al. seems to show an average porosity larger
40
than the value used in the simulation with the present approach (50%). Note that a higher porosity should favor a slower diffusion, instead of a faster one. The reason for a faster diffusion could be found in possible differences regarding the model for the homogenized conductivity of the powder bed. Finally, another difference lies in the effect of surface tension, which seems somewhat different in the two simulations, the trend to spheroidization being more marked in the present simulation.
Finally,an interesting point to underline is that the absorptivity coefficient (0.76) has been obtained by using Fig. 15(a) where a quasi-linear relationship is obtained between the laser power and the absorptivity for the laser power range investigated. This absorptivity coefficient also matches with the phenomenological expression given by Eq. (13). In other terms, this means that no calibration is necessary to get a good agreement with another numerical result considering a more accurate absorptivity calculation. Consequently, this demonstrates that numerical simulation can help also to provide averaged absorptivity estimation evolution maps according to different parameters such as laser power, scan speed or linear energy. These numerical evolution maps are interesting, because the experimental estimation of absorptivity is time and energy consuming.
41 B aya t et a l. (2019) a) P re se nt m ode l b)
Fig. 16. Comparison between numerical results obtained by a) Bayat et al. (2019), and b) the present numerical model. Part a) of the Figure is directly replicated from the article of Bayat et al. (2019). Color coding for
42 Conclusion
In this study, a set of tracks were fabricated in an Inconel 738 LC nickel-base superalloy using LBM process with a large set of processing parameters. The dimensions of tracks were precisely measured and cross sections of melted domains observed. Processing parameters with a linear incident energy between and − lead to tracks with stable
dimensions and a penetration ratio between 1 and 3. The use of analytical models allowed to describe the melt pool cross section, but was found insufficient to estimate
quantitatively the different melt pool dimensions. For quantitative prediction, an advanced thermo-fluid finite element model was used. A novel method was proposed to calibrate the model, which then successfully predicted the melt pools dimensions on a large processing window. The calibration required first to take into consideration the significant amount of particle ejection during the interaction between the laser beam and the powder bed. This was done by a precise analysis of track and powder bed topography measurements. Because in the present model such ejections are not explicitly modeled, it was necessary to reduce the
powder bed thickness in the simulation. This adjustment being done, the main results of the study are the followings.
1) It was demonstrated that this numerical model, which considers the powder bed as a continuum, has an excellent capability to describe the melt pool shapes on the whole process window, from low energy conditions up to the keyhole mode and from low to high scanning velocities.
2) The study proved the importance to consider absorptivity as a variable parameter. A novel method was proposed to determine the value of absorptivity, with a combination of semi-analytical reasoning and numerical simulation. This method allowed expressing
43
such a correlation is fully consistent with separate in-situ measurements from the literature.
3) Using this phenomenological expression of absorptivity, the predictive character of the simulation code was successfully tested by comparison with another simulation code from the literature, which – at the cost of higher computational times - addresses more directly the physics (ray tracing, particle motion).
This work also allows defining some progress orientations:
1) The above-mentioned correlation and validation with respect to experimental observations essentially lies on the measurement of transverse sections of tracks and remelted zones. It would be highly appreciated to consolidate this with an advanced instrumentation. Two axes can be mentioned: thermal imaging to measure surface temperature fields, and high-speed imaging to observe and quantify ejection and denudation phenomena.
2) Nonetheless, considering the numerical model as it is, its capability to describe track formation on a wide process window is very promising for its future use to control the microstructure of nickel based superalloys processed by LBM, and more particularly solidification defects, such as hot cracking. This could be done first by a direct use of this thermo-fluid code, providing then critical quantities at the rear of the melt pool, such as temperature gradients and temperature rates, from which it is known that relevant cracking indicators can be produced. This could also be done by adding a solid mechanics solver to the code in order to predict stress and strain-rates, and possibly directly simulate cracking.
Acknowledgements
Safran Tech (Châteaufort, France) funded this study. The authors would like to thank Clara Moriconi and Bruno Macquaire for their constructive remarks.
44 References
Aggarwal, A., Patel, S., Kumar, A., 2019. Selective Laser Melting of 316L Stainless Steel: Physics of Melting Mode Transition and Its Influence on Microstructural and
Mechanical Behavior. JOM 71, 1105–1116. https://doi.org/10.1007/s11837-018-3271-8
Bayat, M., Thanki, A., Mohanty, S., Witvrouw, A., Yang, S., Thorborg, J., Tiedje, N.S., Hattel, J.H., 2019. Keyhole-induced porosities in Laser-based Powder Bed Fusion (L-PBF) of Ti6Al4V: High-fidelity modelling and experimental validation. Additive Manufacturing 30, 100835. https://doi.org/10.1016/j.addma.2019.100835
Bidare, P., Bitharas, I., Ward, R.M., Attallah, M.M., Moore, A.J., 2018. Fluid and particle dynamics in laser powder bed fusion. Acta Materialia 142, 107–120.
https://doi.org/10.1016/j.actamat.2017.09.051
Chen, Q., Guillemot, G., Gandin, C.-A., Bellet, M., 2017. Three-dimensional finite element thermomechanical modeling of additive manufacturing by selective laser melting for ceramic materials. Additive Manufacturing 16, 124–137.
https://doi.org/10.1016/j.addma.2017.02.005
Cloots, M., Uggowitzer, P.J., Wegener, K., 2016. Investigations on the microstructure and crack formation of IN738LC samples processed by selective laser melting using Gaussian and doughnut profiles. Materials & Design 89, 770–784.
Cunningham, R., Zhao, C., Parab, N., Kantzos, C., Pauza, J., Fezzaa, K., Sun, T., Rollett, A.D., 2019. Keyhole threshold and morphology in laser melting revealed by ultrahigh-speed x-ray imaging. Science 363, 849–852. https://doi.org/10.1126/science.aav4687 Dry air properties, n.d. URL
https://www.engineeringtoolbox.com/dry-air-properties-d_973.html (accessed 15 March 2020)
Grange, D., Bartout, J.D., Macquaire, B., Colin, C., 2020. Processing a non-weldable nickel-base superalloy by Selective Laser Melting: role of the shape and size of the melt pools on solidification cracking. Materialia 12, 100686.
https://doi.org/10.1016/j.mtla.2020.100686
Gunenthiram, V., Peyre, P., Schneider, M., Dal, M., Coste, F., Fabbro, R., 2017. Analysis of laser–melt pool–powder bed interaction during the selective laser melting of a stainless steel.
Hann, D.B., Iammi, J., Folkes, J., 2011. A simple methodology for predicting laser-weld properties from material and laser parameters. J. Phys. D: Appl. Phys. 44, 445401. https://doi.org/10.1088/0022-3727/44/44/445401
JMatPro, 2020. Practical Software for Materials Properties. Sente Software Ltd. www.sentesoftware.co.uk
Khairallah, S.A., Anderson, A.T., Rubenchik, A., King, W.E., 2016. Laser powder-bed fusion additive manufacturing: Physics of complex melt flow and formation mechanisms of pores, spatter, and denudation zones. Acta Materialia 108, 36–45.
https://doi.org/10.1016/j.actamat.2016.02.014
King, W.E., Barth, H.D., Castillo, V.M., Gallegos, G.F., Gibbs, J.W., Hahn, D.E., Kamath, C., Rubenchik, A.M., 2014. Observation of keyhole-mode laser melting in laser powder-bed fusion additive manufacturing. Journal of Materials Processing Technology 214, 2915–2925. https://doi.org/10.1016/j.jmatprotec.2014.06.005 Körner, C., Attar, E., Heinl, P., 2011. Mesoscopic simulation of selective beam melting
processes. Journal of Materials Processing Technology 211, 978–987. https://doi.org/10.1016/j.jmatprotec.2010.12.016
Leuders, S., Thöne, M., Riemer, A., Niendorf, T., Tröster, T., Richard, H.A., Maier, H.J., 2013. On the mechanical behaviour of titanium alloy TiAl6V4 manufactured by