HAL Id: hal-00922074
https://hal.archives-ouvertes.fr/hal-00922074
Submitted on 23 Dec 2013
HAL is a multi-disciplinary open access
archive for the deposit and dissemination of
sci-entific research documents, whether they are
pub-lished or not. The documents may come from
teaching and research institutions in France or
abroad, or from public or private research centers.
L’archive ouverte pluridisciplinaire HAL, est
destinée au dépôt et à la diffusion de documents
scientifiques de niveau recherche, publiés ou non,
émanant des établissements d’enseignement et de
recherche français ou étrangers, des laboratoires
publics ou privés.
Investigating the Influence of Rotating Steel Platform in
the RCS Measurement of Vehicles At 22-26 GHz for
Automotive Radar Application
Pengfei Chen, Stéphane Meric, Olivier Lafond, Mohamed Himdi, El-Makhour
Raed
To cite this version:
Pengfei Chen, Stéphane Meric, Olivier Lafond, Mohamed Himdi, El-Makhour Raed. Investigating the
Influence of Rotating Steel Platform in the RCS Measurement of Vehicles At 22-26 GHz for Automotive
Radar Application. 7th European Conference on Antennas and Propagation, Apr 2013, Goteborg,
Sweden. pp.1-5. �hal-00922074�
Investigating the Influence of Rotating Steel Platform
in the RCS Measurement of Vehicles At 22-26 GHz
for Automotive Radar Application
Pengfei Chen
1, Stéphane Méric
2, Raed El-Makhour
1, Olivier Lafond
2, Mohamed Himdi
2,
1
Renault S.A.S, 1 avenue du Golf, 78280 Guyancourt, France, pengfei.chen@renault.com
2
IETR, Institut d’Electronique et Télécom de Rennes
European University of Bretagne, 263 avenue du Général Leclerc, 35042 Rennes, France
Abstract— This paper investigates the influence of rotating steel platform in the RCS (Radar Cross Section) measurement of vehicles at 22-26 GHz for automotive radar application. Across several measurement steps, we compare different RCS measurement results in order to eliminate the undesired RCS contribution caused mainly by the rotating steel platform. We demonstrate that when it is difficult or impossible to use microwave absorbers on the steel platform, an alternative method can be applied. Finally, with the help of 2D radar image post processing, we can also identify and separate the RCS contribution of each element (vehicle, steel platform, ground/multipath/clutter) in the hologram image, and therefore obtain the pure RCS distribution of the tested vehicle.
key words – RCS, hologram, radar image, automotive radar
I. CONTEXT
24 GHz UWB (Ultra Wide Band) [21.65-26.65 GHz] automotive radar systems are very popular on the market since they provide most of the driving assistance options at a competitive cost [1] [2].
However, in Europe, regulation and permission of 24 GHz UWB for automotive radar is limited in time. Initially, European Commission (EC) decided the cut-off date would be July 2012, but this date is postponed till January 2018 for new vehicle registration and till January 2022 for vehicles registered before 2018 [3]. Therefore, 26 GHz UWB [24-29 GHz] will be ready as a replacement for 24 GHz UWB during the cut-off date. Indeed the shift to the 26 GHz band would be much easier to achieve. Moreover, this technology is allowed with no time limit.
This paper deals with RCS measurement of vehicles in the frequency of 22-26 GHz for automotive radar application.
II. CASE OF STUDY
In the automotive radar system, it is mandatory to characterize RCS of VUT (Vehicle Under Test) according to different scenarios (viewing angles, distances and speed) in order to set up the alert threshold for different automotive
applications, such as ACC (Adaptive Cruise Control) or FCW (Forward Collision Warning).
The RCS measurement configuration could be described as follows. As in a real road cruising situation, we carry out RCS measurements in outdoor conditions. Secondly, considering the weight of VUT, and the need of a continuous 180° azimuth scan (symmetry of vehicle) of target vehicle, the VUT should be positioned on a rotating steel platform.
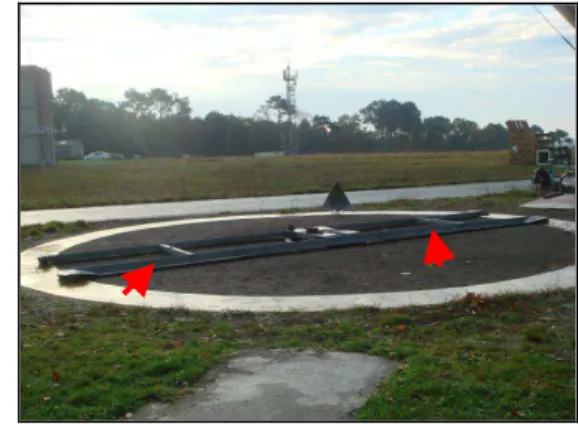
As shown in Figure 1 below, the rotating steel platform used for RCS measurement is made of steel; it is controlled and piloted by a motor positioned at the middle of the structure. We should notice that in the front and in the rear of the rotating steel platform, there are two crossbars, as indicated by the red arrows, which can be used to adjust the width of the structure and support different types of VUT, like big trucks or typical cars. The measurement site is conducted outdoor, referring a real road environment.
Figure 1 - The rotating steel platform used in the RCS measurement in the outdoor conditions
However, the problem is: when the rotating steel platform is loaded by the VUT, the front crossbar, the rear crossbar and all the end of the structure are still exposed in the view of automotive radar. For this purpose, our first thought was the use of microwave absorbers (suited for this frequency band) on the steel platform in order to suppress the undesired RCS disturbance caused by these parts. As shown in Figure 2, the
steel platform is covered by microwave absorbers in the front and rear of the VUT since these two parts are mainly in the field of view of the automotive radar, and present the most important RCS contribution to our measurement results.
Figure 2 - The rotating steel platform is protected by microwave absorbers in the front and the rear of VUT
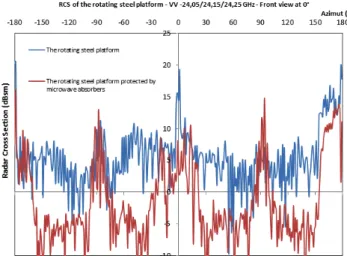
Figure 3 shows the RCS measurement results of the rotating steel platform (without the VUT) with (red curve) and without (blue curve) microwave absorbers. We find out that the rotating steel platform itself also has a very strong scattering capability in the frequency band [22-26 GHz]. For example, at 90°, which means the side of the VUT, we get 14 dBsm. It means that in some particular angles, the rotating steel platform presents a higher distribution of RCS than the VUT itself, which leads to inaccurate measurement results. On the other hand, we also find out that by using microwave absorbers, the level of RCS in the front (from -30° to 30°) and in the rear (from 150° to 180° and from -180° to -150°) are decreased significantly. In other words, the use of microwave absorbers on the steel platform in the RCS measurement is very important.
Figure 3 – RCS measurement results of rotating steel platform with (red curve) and without (blue curve) microwave absorbers
III. HYPOTHESIS
In some particular cases, where we cannot find the suitable microwave absorbers for some reasons (for example: unsuitable for the band of frequency under test, or inappropriate size according to the structure of the rotating steel platform), we propose two hypotheses to eliminate the effect of the rotating steel platform in the RCS measurement. For this purpose, we rue four different measurement scenarios. The measurement is carried out in the frequency range of 22-26 GHz. The VUT is positioned 10 m away from the radar, and the radar is 0.5 m above the ground. A continuous azimuth scan (i°) is realized from -30° to 30° located on the front and the rear of the VUT. The automotive radar is in the VV (Vertical Polarization) configuration. Thus, we achieve the following 4 measurement steps:
• Step 1: RCS measurement (platform) that gives the value of - σ1(i°) in dBsm
• Step 2: RCS measurement (target vehicle + platform) that gives the value of - σ2(i°) in dBsm
• Step 3: RCS measurement with absorbers (platform) that gives the value of - σ3(i° ) in dBsm
• Step 4: RCS measurement with absorbers (target vehicle + platform) that gives the value - σ4(i°) in
dBsm
In order to validate our procedure (without the use of microwave absorbers), we propose to compare the measurements resulting of two hypothesis:
Hypothesis (1)
σ (i°) (without contribution of platform) = σ2 (i°) - σ1 (i°)
We assume under this condition, we can use the direct subtraction to get the pure RCS distribution of vehicle. Hypothesis (2)
The difference in hypothesis (2) is the use of microwave absorbers to protect the steel platform.
IV. ANALYSIS OF RESULTS
Figure 4 below describes the comparison of RCS distribution measurement results from -30° and 30° on the front of target vehicle at 22-26 GHz. It includes fours curves: step 2 (green), step 4 (purple), hypothesis (1) (blue) and hypothesis (2) (red).
First of all, the RCS distribution on the front of vehicle is quite symmetric from -30° to 30°. The strongest scattering area is concentrated between -5° and 5°.
Then, the RCS measurement results (step 4, purple curve) are quite similar to the results of hypothesis (1) (blue curve). And these RCS contribution results are much closer to the results obtained in [4]. It means that in the absence of microwave absorbers to protect the steel platform in the RCS measurement, the use of direct subtraction (step2 – step1) is a valid alternative method.
On the other hand, our method confirms that the platform presents a very strong scattering capability in some particular angles at this frequency. For example, at 0°, the total RCS contribution is about 20 dBsm (green line), but the real RCS of vehicle is only 13 dBsm [2]. Besides, the total level of RCS distribution obtained from hypothesis (2) is too low compared with other results. But for example at 5°, no matter the use of protection or not, we have nearly the same RCS value (blue/purple/red) except the case of step 2 (green). It means that under the hypothesis (2), the subtraction with microwave absorbers is too strict, but there are still some points (ex. 5°) that could be detected by the radar in all conditions.
In addition, we continue to apply a 2D radar image post processing in order to separate the contribution of each element in the environment [5]. The description of the 2D hologram image is simplified from equation (1) below. The whole object can be described by the vector
R
'
and the hologram image is presented by
I
(R
'
)
.
s
( f
)
is the power spectrum. It is very important to transform
(
f
,
θ
)
coordinate to)
,
(
f
xf
y coordinate (2).∫∫
+=
f fs
f
e
j f x f ydf
xdf
yR
I
x y y x ) ' ' ( 2 ,(
)
)
'
(
π
(1)
=
=
θ
θ
sin
2
cos
2
c
f
f
c
f
f
y x (2)Figure 4 – RCS measurement results on the front of VUT at 22-26 GHz with different steps/hypothesis
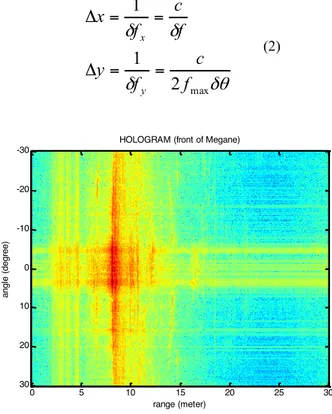
In the Figure 5, we construct a hologram image of the entire measured results from -30° to 30°. We know that the target vehicle is placed on the steel platform at a 10 m distance. In the RCS measurement, we set up a 4 GHz bandwidth
Δ
f
and 60° azimuth scanΔ
θ
. The step of frequency is 5 MHz and 1° in the azimuth that induces a range ambiguityΔ
x
of 30 m in the range and 3.305 m in the cross-rangeΔ
y
respectively. These parameters can be obtained from equation (3).δθ
δ
δ
δ
max2
1
1
f
c
f
y
f
c
f
x
y x=
=
Δ
=
=
Δ
(2)HOLOGRAM (front of Megane)
range (meter) angl e (degr ee) 0 5 10 15 20 25 30 -30 -20 -10 0 10 20 30
In the radar image, we can conclude that all the scattering points (pixel) ahead of 10 m (where VUT is positioned) are caused by the effect of ground/multipath/clutter. Those pixels can be easily removed in the radar image. The same goes for the pixels generated by the structure of steel platform.
Similarly, in Figure 6, we get the comparison of RCS distribution measurement results from -30° to 30° on the rear of the VUT. It also includes fours curves: step 2 (green), step 4 (purple), hypothesis (1) (blue) and hypothesis (2) (red).
In comparison to the results in the Figure 4, the RCS distribution on the rear of VUT is not quite symmetric. It is reasonable because of the exhaust system (including the steel pipe) is on the right side in the back of the VUT, and it can be seen by the automotive radar. That is why the level of RCS is bigger from 0° to 20°. Then, as we previously in Figure 4, the RCS measurement results (step4, purple curve) are quite similar to the results of hypothesis (1) (blue curve). That confirms our conclusion: the use of direct subtraction is a valid alternative measurement method.
Figure 6 – RCS measurement results on the rear of VUT at 22-26 GHz with different steps/hypothesis
We also notice that in the rear of the VUT, the RCS value at 0° is lower than at 10° because at 0°, the automotive radar cannot see the whole exhaust system, even though the back surface is the largest. It is reasonable because the exhaust system is made of steel, and its capacity of reflection at these frequencies is much higher. On the other hand, the bumper of the VUT is made of Borealis material, and its capacity of reflection is lower than steel. Meanwhile, we also notice that in Figure 4, the difference between the red curve (hypothesis (2)) and the purple curve (step 4) is quite significant, but in Figure 6, this difference is not so obvious. That is because: according to the vehicle’s design, the height of front side is slightly lower than the height of rear side, therefore, the use of microwave absorbers in the rear of the VUT is not quite obvious. The automotive radar can see the below of the VUT in all conditions.
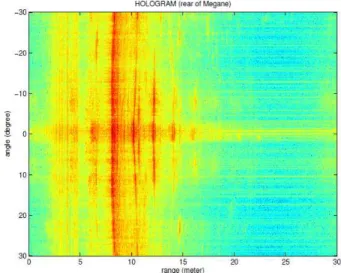
We can also notice these results in the hologram image. If we compare Figure 5 and Figure 7, we can find out: in the
Figure 5, we can identify the structure of the rotating steel platform from nearly -8° to 8°. However, in Figure 7, we can see this structure from -30° to 30°. In other words, at the front, as the height of VUT is lower, the automotive radar cannot see the rotating steel platform during the whole scanning angle. But at the rear, as the height of VUT is slightly higher, the automotive radar can see the rotating steel platform during the whole scanning angle. It also should be noticed that: it is more difficult to eliminate or separate the undesired RCS contribution at the rear of the hologram image than at the front. It is obvious that in Figure 7, we have more red pixels (strong scattering point).
Figure 7 – The hologram of target at 22-26 GHz on the rear of the vehicle
V. FILTERING
In the 2D hologram image, we can identify the different RCS contributions caused by the different parts in the measurement. As we have mentioned, all the yellow pixels (scattering points) ahead of 10 m (where the VUT is positioned) are caused by the effect of ground/multipath/clutter. We firstly remove these pixels by a similar so called greedy-algorithm [6] [7]. After that, we also use the same algorithm to remove the RCS contribution of rotating steel platform pixel by pixel, separately in the front and the rear of the VUT.
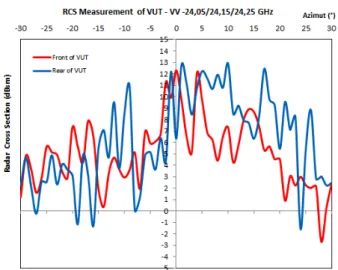
Finally, in Figure 8, we get the pure RCS measurement results of VUT at 22-26 GHz on the front and the rear. From these results, we can conclude that in the front and the rear of the VUT, from -30° to 30° scanning angle range, the RCS level is nearly positive.
Then, in the front of the VUT, the distribution of RCS is quite symmetric; and the biggest value 12 dBsm appears at 0° and 5°. 0° means the automotive radar is pointed to the front of the VUT, and the scattering surface is the largest. Besides, 5° means the automotive radar can see the motor (metal parts) under the hood, and it also gives a strong reflection.
On the other hand, in the rear of the VUT, the distribution of RCS is asymmetric; the right parts of the VUT have a strong capacity of reflection to these frequencies. The maximum value is 13 dBsm, and at 0°, the RCS is approximately 6 dBsm.
Figure 8 – The pure RCS measurement results of VUT at 22-26 GHz at the front and the rear
VI. CONCLUSION
In the RCS measurement, the rotating steel platform should be taken into account, because its scattering contribution is very important.
We propose two methods to avoid such effects. The first one consists on the use of microwave absorbers. As for the second method, it is an analytical method based on a direct subtraction between two measurements (RCS of the rotating steel platform subtracted from RCS of the VUT and the platform).
In addition, by using radar image post processing and filter techniques, we can separate the undesired RCS contribution
from the measurement results, and finally get the pure RCS results of the VUT.
VII. ACKNOWLEGMENT
The authors like to thank TDF (Télédiffusion de France) for providing the measurement site and necessary equipment.
.
VIII. REFERENCES
[1] ETSI EN 302 288-1, Short range radar equipment operating in the 24 GHz range, http://www.etsi.org
[2] ECC, CEPT. (2010). CEPT Report 36 and 37, Automotive Short Range Radar Systems (SRR). Final Report
[3] The 79 GHz Consortium, (2011). 79 GHz CSA Project, Negotiation Meeting, Brussels.
[4] Schipper, T, Fortuny-Guasch, J, Tarchi, D, Reichardt, L, Zwick, T (2011). RCS Measurement Results for Automotive Related Objects at 23-27 GHz, EuCAP, pp.683-686.
[5] D.L. Mensa, High Resolution Radar Cross Section Imaging, Artech House, 1991
[6] Schuler, K, Becker, D, Wiesbeck, W. Extraction of Virtual Scattering Centers of Vehicles by Ray-Tracing Simulations, IEEE Transactions on Antennas and Propagation, Vol 56, No. 11, November 2008
[7] T.C.Cormen, Introduction to Algorithms, 1st ed. Cambridge, MA: MIT Press, 2001.