Publisher’s version / Version de l'éditeur:
Proceedings of the Canadian Engineering Education Association (CEEA)
Conference, June 19-22, 2016, Halifax, NS, Canada, 2017-01-28
READ THESE TERMS AND CONDITIONS CAREFULLY BEFORE USING THIS WEBSITE. https://nrc-publications.canada.ca/eng/copyright
Vous avez des questions? Nous pouvons vous aider. Pour communiquer directement avec un auteur, consultez la première page de la revue dans laquelle son article a été publié afin de trouver ses coordonnées. Si vous n’arrivez pas à les repérer, communiquez avec nous à [email protected].
Questions? Contact the NRC Publications Archive team at
[email protected]. If you wish to email the authors directly, please see the first page of the publication for their contact information.
Archives des publications du CNRC
This publication could be one of several versions: author’s original, accepted manuscript or the publisher’s version. / La version de cette publication peut être l’une des suivantes : la version prépublication de l’auteur, la version acceptée du manuscrit ou la version de l’éditeur.
For the publisher’s version, please access the DOI link below./ Pour consulter la version de l’éditeur, utilisez le lien DOI ci-dessous.
https://doi.org/10.24908/pceea.v0i0.6456
Access and use of this website and the material on it are subject to the Terms and Conditions set forth at
Educational data mining approach for engineering graduate attributes
analysis
Bouslimani, Yassine; Durand, Guillaume; Belacel, N.
https://publications-cnrc.canada.ca/fra/droits
L’accès à ce site Web et l’utilisation de son contenu sont assujettis aux conditions présentées dans le site LISEZ CES CONDITIONS ATTENTIVEMENT AVANT D’UTILISER CE SITE WEB.
NRC Publications Record / Notice d'Archives des publications de CNRC:
https://nrc-publications.canada.ca/eng/view/object/?id=27763f32-9b61-439f-be58-3063892297cc https://publications-cnrc.canada.ca/fra/voir/objet/?id=27763f32-9b61-439f-be58-3063892297ccE
DUCATIONAL
D
ATA
M
INING
A
PPROACH FOR
E
NGINEERING
G
RADUATE
A
TTRIBUTES
A
NALYSIS
Yassine Bouslimani
(1), Guillaume Durand
(2)and Nabil Belacel
(2)(1) Electrical Engineering Department, Faculty of Engineering, Université de Moncton, New-Brunswick, Canada E1A3E9 (2) National Research Council Canada, Institute for Information Technology, New-Brunswick, Canada E1A 7R1
Abstract
– Curriculum improvement and graduateattributes assessments have become recently a serious issue for many Canadian engineering schools. Collecting assessment data concerning graduate attributes and the students’ learning is an important step of curriculum evaluation and the continuous improvement process. To be successful, this improvement process needs appropriate methods and tools for data analysis.
Recent developments in the field of Psychometrics and Educational Data Mining (EDM) provide multidimensional item response models able to take into account student and curriculum attributes as parameters. The primary intent of these new models is to predict student successes based on students past performance and the assessment map underlying the tests they completed.
We demonstrate in this paper that these models can also be used to analyze the assessment map. In the psychometric and Educational Data mining literature, assessment maps are usually represented as a parameter that associates items to competencies in a matrix called Q-matrix. This concept draws its origins from the Rule-Space Model that was introduced in the eighties to statistically classify student item responses into a set of ideal response patterns associated to different cognitive skills.
A method based on the Additive Factor Model has been successfully implemented to analyse the Q-matrix corresponding to the assessment maps used in the graduate assessment process. The results of 17 volunteering anonymous students completing 36 courses at the Université de Moncton between winter 2010 and fall 2015 semesters was analysed with our method. Results obtained provided interesting and useful information regarding the assessment map and the overall assessment process that are presented and discussed in this paper.
Keywords: Engineering Education; Educational Data;
Mining; Additive Factor Model; Predictive Modeling;
Q-matrix; Curriculum Improvement; Engineering Graduate Attributes.
1. INTRODUCTION
The Canadian Engineering Accreditation Board (CEAB) requires that each engineering program institution demonstrates that the graduates of a program possess twelve attributes (Accreditation Criteria 3.1) and the institution must have processes in place that demonstrate that the program outcomes are being assessed in the context of these graduate attributes, and that the results are applied to the further development of the program [1]. The CEAB requires also that engineering programs must continually improve (Accreditation Criteria 3.2) [1].
The Engineering Programs at the Université de Moncton (UdeM) have been accredited since 1972 for civil engineering, since 1990 for mechanical engineering and since 1998 for electrical engineering. Following many recommendations of the Engineering Graduate Attribute Development Project (EGAD) [2], the Engineering Faculty of UdeM started in 2012 the implementation of a continuous curriculum improvement process based on the 12 graduate attributes as defined by the CEAB. The EGAD website [3] released in 2011 contains all the relevant and related information.
In June 2015, the three UdeM engineering programs (civil, electrical, and mechanical) were accredited for another 6 years. The curriculum improvement and graduate attributes assessment still have many challenges to overcome and during the coming years more emphasis will be placed mainly on the evaluation of data being collected and to overall improve the process.
Data was previously collected in Excel spreadsheets and for each engineering program, more than 140 Excel files were created every year. A report for the graduate attribute assessments is generated based on these files at the end of the academic year. For the 5-year programs
analysis, a migration to database management system was necessary. With huge amount of data, this approach helped a lot for the data collecting process but didn’t solve yet the data analysis problem.
To be able to extract relevant information from the collected data, several data mining approaches [4] have to be considered for graduate attribute contexts. Many methods have great potential to be used and some have been already applied successfully to model learning activities and to generate recommendations for student’s learning [5]. For example, a regressive model has been used for predicting graduate-level performance using undergraduate performance indicators [6]. Another method is the Additive Factor Model (AFM). It was introduced in 1995 to predict student later performances based on prior learning attempts [7]. AFM has been used for student modeling in Instructional Factors Analysis in 2006 [8,9]. AFM is a multidimensional model where the probability of success may depend not only on one, but potentially several skills. The relationship between items and skills is defined by the Q-matrix [10,11,12]. The AFM is used as a multidimensional item response model able to take into account student and curriculum attributes as parameters.
In this paper, AFM uses the curriculum maps as knowledge components and analyze if item mapping is appropriate. The objective is to make sure that the assessment maps (Q-matrix) are consistent with the results obtained by students. This also provides faculty members and students with evidence-based confidence in the quality of the assessment performed and the abilities measured.
2. CURRICULUM MAPPING
The CEAB has developed statement of the graduate attributes that engineering students are expected to demonstrate at the time of graduation. Each engineering schools has established a set of indicators which define what students must do to be considered competent in each attribute [3]. These indicators are measurable and used to evaluate student learnings. A Curriculum Map is used to define relationship between indicators and learning experiences (e.g. courses, co‐ops, co‐curricular activities). A table representation is used to show which learning experiences (e.g. courses) is selected to develop abilities and to assess indicators to demonstrate the graduate attribute acquisition.
The Faculty of Engineering at UdeM, with more than 400 students enrolled in three different programs, started the implementation of graduate attribute process in 2012.
The engineering programs at UdeM share the same set of indicators (total of 44) but have different curriculum
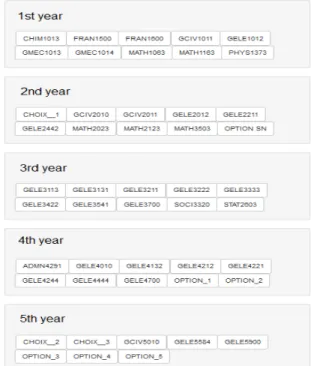
maps. Each indicator is assessed for all students without sampling in different courses using a same evaluation rubric. Students selected for this studies are enrolled in the electrical engineering program. It takes 5 years with 48 courses (150 credits) of full time studies. The electrical engineering course progression is shown in the next figure.
Fig. 1. Electrical engineering course progression Many courses related to other disciplines such as mathematics, physic and chemistry couldn’t be used for the Graduate Attributes development or assessments. Total of 12 compulsory courses which are common to the three engineering programs at UdeM, have been excluded from the process. Optional Courses have been also excluded from the process. Remaining courses more than 27 have not been used all for indicator evaluations. Assessment mapping used only the courses where students have the opportunity to demonstrate Gradute Attribute related skills they have been developing. Fig. 2 shows an assessment map for the 4th year courses. In this figure the
indicators are shown with UdeM labels. They have been labeled and numbered using the letters Q and R (QR for qualité requise: Graduate Attribute in French) and a number to in indicate the Graduate attribute as listed by the CEAB (for example 04 for Problem analysis) and the indicator number. For example, the first indicator to assess the first listed Graduate Attribute (A knowledge base for engineering) is QR011.
Fig. 2. Assessment map for the electrical engineering 4th year courses
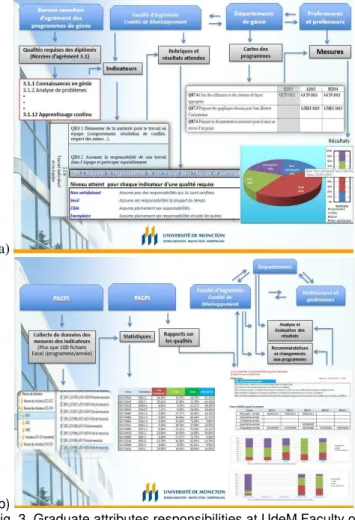
In order to accomplish the graduate attribute process implementation, the responsibilities have been shared between Faculty Level Comity, Departments Level and Faculty Members. Fig. 3 summarize these responsibility sharing.
a)
b)
Fig. 3. Graduate attributes responsibilities at UdeM Faculty of Engineering: a) Curriculum mapping and assessment
b) Data collection and analysis
The development of indicators and rubrics was accomplished at the faculty level. The faculty members have to select indicators developed or to assess in each course. This information is used at the department level to build maps for curriculum graduate attribute development and for indicators assessments.
3. DATA SET DESCRIPTION
The data set used for the study was collected on a voluntary basis from graduating students who accepted to share their transcripts. Seventeen transcripts were collected and duly anonymized prior to run our experiments. Transcripts listed scores from 0 (Failure) to 4.3 (Perfect) obtained in 24 different courses completed between fall 2009 and winter 2015. Each course is associated to one or several knowledge components and a total of 43 out of the 44 existing knowledge components are mapped to at least one course in our sample. On average each course has been completed 15.08 times ( = 4.83). Two courses, GELE5584 and GELE1012 have been completed two and three times (respectively). The next smallest number of completions is for course GCIV5010 performed eight times. This was considered as a significance threshold in our study. The data set contains also the assessment map from which the Qmatrix was built, and the observations used for estimating the AFM model.
The faculty pedagogical teamimplemented a continuous curriculum improvement process is based on the 12 graduate attributes defined by the CEAB. For each attribute between 2 and 6 indicators were defined and associated to the different courses of the program.
The nature of the attributes is heterogeneous and covers skills that are not solely discipline-related. For example, “life-long learning” covers student abilities to “identify and to address their own educational needs in a changing world” or “Ethics and Equity” would evaluate student abilities to “apply professional ethics, accountability, and equity”. Some attributes might also overlap with others. That might be the case for “Ethics and Equity” and “Professionalism” or for “Problem Analysis” and “Investigation”, since the descriptions of both of these last two attributes require “Analysis”. Based on these twelve attributes, the faculty pedagogical team created a total of 44 indicators and matched them to the 24 electrical engineering courses used for assessments. This created a 24 by 44 Q-matrix, where indicators play the role of knowledge components.
In the resulting data set, knowledge components are associated to between 1 and 5 different courses (average γ.β6, σ=.87) while courses can evaluate from 1 to β9 knowledge components (average 5.8γ, σ=6.98). Four
courses have more than 10 knowledge components: GCIV1011 (11 KC), GELE3422 (12 KC), GELE3700 (25 KC) and finally GELE4700 (29 KC). Sixteen out of the 44 knowledge components are only mapped to all of these last four courses.
4. MODEL AND EXPERIMENTAL METHOD
AFM models the probability that a student j succeeds on an item i by a mixed-eect logistic regression:
where logit−1(x) = 1/(1+e−x) and αj represents the
proficiency of student j, which in principle in range between −γ and 3, Parameters and are key differentiators for AFM as a psychometric model. tjk is the
number of times student j has practiced skill k, also known as the opportunity for student j on skill k.
A higher value for the proficiency corresponds to a better overall student proficiency. Both and parameters are related to skills: k models the easiness and k the
learning rate for skills k = 1...K.
The mapping between skills and items is represented by a Q-matrix Q = [qik], where qik in Eq. 1 is a binary
indicator that item i uses skill k. A simple Q-matrix is shown in fig. 4.
Fig. 4. Q-matrix example with one skill per item
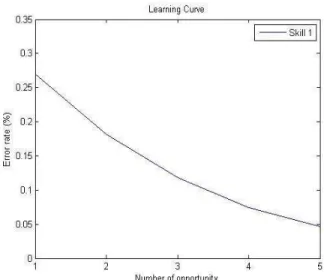
The implemented algorithm used to learn the AFM model relies on a conjugate gradient algorithm that estimate parameters α, and by maximizing the likelihood with a small regularization on α. Once the parameters are estimated, it is possible to evaluate the consistency of the competency matrix by tracing learning curves for each skill. In our investigation, a learning curve represents the expected performance of an average student as the number of opportunities (number of time the skill has been evaluated) grows. This is illustrated in Figure 5. The expected error rate decreases smoothly from above 25% (at the first opportunity) to around 5 % at the fifth opportunity. This suggests that the mapping of this skill to the test items is adequate.
Fig. 5: Example learning curve associated to a hypothetical “Skill 1”.
A curve with a smooth slope usually reflects a correctly mapped knowledge component. In this work, we use analytical learning curves given by the following equation.
where α is the average of all alpha parameters, representing an average student.
Ideally the learning curve should follow a power law (Power Law of Learning) since performance (both speed and accuracy) improves with a power function. Even if the power function makes a large consensus in the learning communities, some researchers [13] argue that an exponential function might have a better fit than a power function in certain circumstances. In practice, a smooth learning curve following a power law is hard to obtain since it requires a large number of observation and a skill perfectly mapped. The calculated value of k depends also
on the number of observations and needs to exceed some thresholds to be significant. While positives values of k
should be the norm for good Q-matrices, null or negative values for the slope or the learning curve are not the kind of values expected. For example, a null slope means that no learning has been made along the several attempts of the learners. A negative value usually signifies that the skill has been misplaced. The learning curve can also be traced to detect some patterns. For example, when two skills are treated as the same skill [14] the observed learning curve shows in its beginning two spikes before continuing its asymptotic evolution. In this last example given by Corbett and Anderson, the authors draw learning curves directly from the observations as it is also possible to do with PSLC-DataShop [15]. In this paper we investigated only the curves calculated by AFM (analytical curves) from the following data set.
5.
RESULTS AND DISCUSSION
The number of courses completed by the students and used for indicator assessments were in the range between 17 and 24. Usually at university, scores have to be above O for the student to pass the course. Keeping this way of defining success and failure, we obtained only 16 failures (n = 356 records) for 7 different students and 8 courses. This number of failure is relatively low and AFM would have difficulties to discriminate students as illustrated in the following figure.
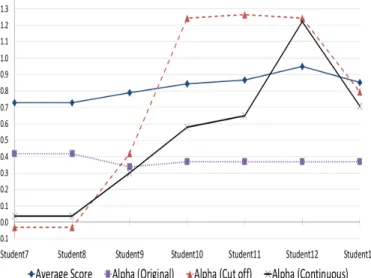
Fig. 6. Variation of alpha values for students 7 to 13. (Subset only for editing constraints).
The curve with legend Alpha (original) is relatively flat and does not follow the variations of student average scores. Note that student average scores have been normalized between 0 and 1 in this figure while other values of Alphas have not been transformed. Having a failure rate too low to finely discriminate student proficiency, it was decided with the pedagogical team to create a new dataset in which failure would include any score below 2 (see curve Alpha (Cut Off) in figure 6). In this new dataset, the number of failures raised to 73 (n = 356 records) for 24 different courses and impacted all students. As a result, the model was able to provide a better differentiation of student proficiency but the ranking was still incorrect. For instance in fig. 6, student 11 is given slightly stronger than student 12 while in reality student 12 is stronger than any other students.
Keep raising cut-off threshold would solve the ranking issue for high scores but also add errors to the ranking of lower scores. Curve Alpha (Continuous) was calculated with scores transformed as percentages by dividing each score by its maximum (4.3). As illustrated in fig. 6, ranking is correct and student 12 proficiency is significantly better than the other students. Using
percentages when possible instead of binary observations to estimate AFM parameters is a work around that brought a better estimate of student proficiency in this case.
Not all of the knowledge components would worth studying with AFM since not enough information would be contained in the dataset to provide meaningful parameters ( , ). For instance, knowledge components that are always associated as a same group to one or several courses are more likely to appear as flat lines ( close to zero value) in learning curves plots. Depending on the success rates or in our experiment also scores, the group of the knowledge components is given a value that is because of the additive nature of AMF distributed to the measure of group knowledge components. That way all knowledge components of the group composed of sixteen items that are solely met in the items GCIV1011, GELEγ4ββ, GELEγ700 and GELE4700 get values that are for many of them identical. This is the case for instance of all of the 4 indicators of attribute 6 (“Individual and team work”). In all variations of the dataset (Original, Cutoff, Continuous), they always get same values of α and in each experiment leading to learning curves flat with an error rate close to zero.
For each different dataset variations, a subset of interesting knowledge components was selected based on the following criteria:
• KC learning curve having a non-null slope (γ) inducing a potential learning.
• KC having a realistic easiness inducing at first opportunity an error rate above 10 percents.
• KC would have been met by almost all of the student and on an average superior of 2.3 opportunities.
Learning curves of knowledge components of interest are represented in figure 6, 7 and 8. All the graphs in this selection were limited to five opportunities since no opportunities above this threshold were observed.
On figure 7, knowledge component QR07.6 is a perfect curve that has a smooth slope contrary to the error rates of KCs QR01.1 and QR03.3 which decrease rapidly. QR01.1 is met the first time in course GCIV2010 where 4 out the 17 students failed with no other failure at next opportunities, as if students were hammered in this first opportunity. QR03.3 has one student who failed on the second opportunity inducing a not that strong “hammer” phenomenon.
Fig. 8. Learning curves of interest for the dataset with Cutoff
On figure 8, there is more Knowledge components falling in the ”hammer” pattern (QR01.1, QR04.4, QR07.5) since new failures have been generated and courses from second year have a lower average than the third year hence creating more cases where KCs are met at first time on a high failure rate course. KCs QR02.1 and QR01.3 bring interesting new patterns. Both of their error rates decrease over time (which is what is expected to provide evidence of learning) but their shape is far from the ideal illustrated in figure 5. The explanation may be coming from the fact that some courses with the same KCs have been completed the same semester. For instance, QR01.3 has been met by the same students several times in one semester in courses GELE2442, GELE2012 and GELE3333. However, to use AFM we had to calculate the opportunity number tik. Therefore, an
odd order was used in this special cases creating an opportunity sequence were in reality results were obtained theoretically at the same opportunity number.
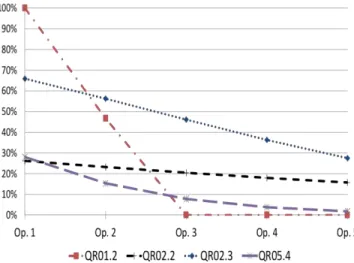
Fig. 9. Learning curves of interest for the dataset with scores as continuous values
KC QR02.3 learning curve in figure 9 is affected by the order issue to generate opportunity numbers. However, it is not the case of attribute QR02.2 which evaluates the capacity of students to “formulate a solving process to a problem”. A duplication of this knowledge component [1] could explain the curve, but also a possible mismatch with other kCS of attribute categories 2 (Problem analysis) and 3 (Investigation) that would confirm a potential overlap as mentioned in a previously.
5.
CONCLUSION
Using the Additive Factor Model outside of its “comfort zone” requires even more cautions regarding the assumptions that can be drawn. Comforted by our results and discussion with the pedagogical team, learning factor analysis and AFM could prove to be of great value to continually improve programs by providing measures of the assessment map through goodness of fit metrics and parameters values but also by the exploitation of the analytical learning curves generated. In the meantime, we discovered that going around the traditional binary results expectation of AFM and using instead continuous values that could be seen as “observation of a probable success” would provide benefit in the student proficiency estimates. Moreover, keep playing with thresholds or scores to variate success and failure while chasing alpha values led us to realize the different realities that could emerge the same data set. This could prove to be a good method, when using a data set with scores, to adjust different lenses in order to focus on the different and often ignored realities contained in the same data set. Finally, an engineering program is also different from an online exerciser or intelligent tutoring system because not all
courses are performed in similar conditions. For instance, teachers change and it would maybe make sense to potentially consider a “teacher factor” at some point.
Acknowledgements
This study was conducted with support from the Faculty of Engineering at the Université de Moncton and from the National Research Council Canada (NRC). The authors express their gratitude to the students who volunteered in the study. This work is part of the National Research Council Canada program Learning and Performance Support Systems (LPSS), which addresses training, development and performance support in all industry sectors, including education, oil and gas, policing, military and medical devices
References
[1] Canadian Engineering Accreditation Board, Accreditation
Criteria and Procedures, Engineers Canada, 2015, 115 pp,
2015 {ISSN 1708-8054}
[2] Brian Frank, Susan Fostaty-Young, Susan McCahan, Peter Wolf, Peter Ostafichuck, K. Christopher Watts, Nasser Saleh, Engineering Graduate Attribute Development
(EGAD) Project, Proceedings of the Annual CEEA
Conference, St. John's, Newfoundland, June 6-8, 2011 [3] Engineering Graduate Attribute Development Project,
EGAD Project web site, http://egad.engineering.queensu.ca [4] International Educational Data Mining Society, Educational
Data Mining, http:/www.educationaldatamining.org, 2008. [5] Albert T. Corbett, and John R. Anderson, Knowledge
tracing: Modeling the acquisition of procedural knowledge.
UMUAI, 4(4):253–278, 1995.
[6] Judith Zimmermann, Kay H. Brodersen, Hans R. Heinimann, Joachim M. Buhmann, A model-based approach to predicting graduate-level performance using indicators of undergraduate-level performance, Journal of Educational Data Mining, Vol 7, No 3, 2015.
[7] Karen L. Draney, Peter Pirolli, Mark Wilson, A
Measurement Model for a Complex Cognitive Skill. In
Cognitively Diagnostic Assessment, Chapter 5, pp 103- 126, Lawrence Erlbaum Associates, 1995.
[8] Hao Cen, Kenneth Koedinger, and Brian Junker, Learning
factors analysis – a general method for cognitive model evaluation and improvement. In ITS Conference Proceeding, Springer, pp 164–175, 206.
[9] Hao Cen, Kenneth Koedinger, and Brian Junker,
Comparing Two IRT Models for Conjunctive Skills. ITS
2008, LNCS 5091, pp. 796–798, Springer-Verlag Berlin Heidelberg, 2008
[10] B. W. Junker, K. Sijtsma, Cognitive assessment models
with few assumptions, and connections with nonparametric item response theory, Applied Psychological Measurement,
25(3): pp 258-272, 2001.
[11] K. Tatsuoka, Rule space: An approach for dealing with
misconceptions based on item response theory. Journal of
Educational Measurement, 20(4): p. 345-354, 1983.
[12] T. Barnes, The Q-matrix Method: Mining Student
Response Data for Knowledge, 2005 Educational Data
Mining Workshop, American Association for Artificial Intelligence, 2005.
[13] J. M. Murre and A. Chessa. Power laws from individual
differences in learning and forgetting: mathematical analyses. Psychonomic bulletin & review, 18(3):592–597,
2011.
[14] A. Corbett and J. Anderson. Knowledge tracing: Modeling
the acquisition of procedural knowledge. User Modeling
and User-Adapted Interaction, 4(4):253–278, 1994
[15] K. Koedinger, R. Baker, K. Cunningham, A. Skogsholm, B. Leber, and J. Stamper. A data repository for the EDM
community: The PSLC Datashop. In C. Romero, S. Ventura,
M. Pechenizkiy, and R. Baker, editors, Handbook of Educational Data Mining. CRC Press, 2010.
[16] A. A. Rupp and J. Templin. The effects of q-matrix
misspecification on parameter estimates and classification accuracy in the dina model. Educational and Psychological
Measurement, 68(1):78–96, 2008.
[17] J. de la Torre. An empirically based method of q-matrix
validation for the dina model: Development and applications. Journal of Educational Measurement, 45(4):343–362, 2008.