HAL Id: hal-00566468
https://hal.archives-ouvertes.fr/hal-00566468
Submitted on 16 Feb 2011
HAL is a multi-disciplinary open access
archive for the deposit and dissemination of
sci-entific research documents, whether they are
pub-lished or not. The documents may come from
teaching and research institutions in France or
abroad, or from public or private research centers.
L’archive ouverte pluridisciplinaire HAL, est
destinée au dépôt et à la diffusion de documents
scientifiques de niveau recherche, publiés ou non,
émanant des établissements d’enseignement et de
recherche français ou étrangers, des laboratoires
publics ou privés.
Spatial indicators for the analysis of peri-urban
dynamics in the Languedoc Mediterranean area
M. Balestrat
To cite this version:
M. Balestrat. Spatial indicators for the analysis of peri-urban dynamics in the Languedoc
Mediter-ranean area. ERSA 2009, Aug 2009, Lodz, Poland. 17 p. �hal-00566468�
ERSA 2009: TERRITORIAL COHESION OF EUROPE AND INTEGRATIVE PLANNING 25th - 29th August 2009 – Lodz Poland http://www.ersa.org/spip.php?rubrique12 Theme: Territorial cohesion of Europe and integrative planning
K : Urban policy, land use planning, real estate and housing markets
Title: Spatial indicators for the analysis of peri-urban dynamics in the Languedoc Mediterranean area Introduction
For the first time in the history of humanity, in 2008, the urban population surpassed the rural population. The consequences of this urban growth are well known (UNO, 2006). In the effort to address this explosion, the multiplication of decision-making levels – arising from decentralization and the ensuing institutional multi-layering – is a serious impediment to long-term planning. Competitive imperatives, qualified by ‘territorial benchmarking’1, are observed: every decisional instance tends to push the negative impacts of the urban sprawl out of the boundaries of the territory under its management. In France, the Chevènement act (1999) encouraged the establishment of Public Organizations of Intercommunal Cooperation (EPCI)2 to promote improved cooperation in planning policies. Within this framework, new management tools were created, in particular the Urban Master Plans (French acronym: SCOT). These plans include prospective studies (scenarios, etc.) and measurement tools (indicators for monitoring, evaluation, etc.) for supporting territorial diagnostics. The question arises of agriculture’s place in the planning of urban areas (Bertrand et al. 2006). The decongestion and delocalization of populations from city centres to the outskirts (‘urban sprawl’) results in the growth and dispersion of built-up areas at the expense of natural and agricultural spaces, especially for lands whose agricultural potential is highest. Their preservation is considered usually only from the environmental angle; issues of agricultural production are rarely raised. The urban perspective and the model of using natural spaces for recreational activities predominate in urban-planning policies. Agricultural production is more and more accepted only in an ‘ecological’ framework (pedagogical farms, natural foods, etc.).
This situation appears to be acute on the Mediterranean coast in general and in the Languedoc-Roussillon region in France in particular. The urban growth is higher here than anywhere else in the country. Data from the 2006 census indicates an estimated increase in population of 32% in Languedoc-Roussillon by 2030 (INSEE, 2008). For the institutions and actors of the agricultural world, the loss of a long-term strategic agricultural heritage for immediate economic interests raises the issue of effective management approaches for its preservation. Concerned by this phenomenon, and to better understand the conversion of agricultural lands into artificialized surfaces, the Regional Directorate of Agriculture and Forests3 (DRAF) of Languedoc-Roussillon has commissioned a methodological study from the TETIS JRU (Cemagref) and the LISAH JRU (INRA): What are, in effect, suitable and generalizable methods of spatial analysis that can lead to objective and quantitative data on the loss of agricultural lands, both in surface area and in quality?
To respond to this request, a methodology for the establishment of spatial indicators linked to the dynamics of the urbanization in the Mediterranean zone is being developed. This study has as goal to study the contribution of the spatial dimension in the approach of constructing indicators useful for decision-making in the planning of spaces. In what way does the indicator, with its accompanying ‘spatial’ adjective, encourage a transversal and systemic approach which is indispensable for tackling the territorial complexity and the associated issues of sustainable development? In what way does the spatial tool encourage its appropriation and use (and thus its own legitimization) by the actors?
This paper presents the first results of this work. To begin with, we recall the framework of the revamping of measurement tools within which DRAF’s request is located. Secondly, we show that the potential of the spatial dimension remains underutilized despite the increased general use of geographic information in tools for aiding decision-making. After clarifying the concept of the spatial indicator we defend the idea that it is a suitable tool to translate a territory’s systemic complexity and thus overcome the shortcomings of current measurement tools. Thirdly, to support our proposal, we
1
Territorial benchmarking: ‘Comparative evaluation of states of developments of similar regions, based on indicators integrated into a conceptual system of representation of the dynamics of the territories under study’ (CPDT, 2000).
2
All acronyms and abbreviations used in this article are defined in annexure 1. For French organizations and documents, the French-language acronyms/abbreviations have been retained.
3
The DRAFs are decentralized services of the French Ministry of Agriculture and Fisheries created in 1984, subsequent to decentralization laws, and have as goal the regional implementation of national policy relating to food, agriculture and forests.
present an iterative approach for producing spatial indicators designed for quantitative and qualitative analysis of the conversion of agricultural lands into artificialized surfaces. Finally, we discuss perspectives of improving this method.
1. A context of revamping the measurement tools used for aiding decision-making
1.1. Need for tools and methods for an increased consideration of agricultural lands in planning policies
In the Mediterranean zone, the demographic and property dynamics are especially intense and translate into littoralisation, which is defined as the ‘concentration of human and human activities on the coastline’ (Baud, 1997). Towns and activities expand on the coastal plain where, at least in the Mediterranean context, the agricultural potential of soils is generally the highest and natural resources the most abundant. This phenomenon leads to intense competition for land and water resources. Coastal constructions, establishment of infrastructure and the development of economic-activity zones boost the property market and leads to the fragmentation of agricultural land. Local interests, including those of local property owners, lead systematically to an acceptance of the loss of agricultural lands. This dynamic, perceived as inconsequential at the local scale, becomes worrying at the regional scale. In fact, we fear that the disappearance of agricultural lands is irreversible. It is, therefore, a heritage that seems to be doomed (i.e., impossible to revive) for an immediate economic interest without any thought to its medium and long term utility.
The loss of this agricultural production potential leads to the question of agriculture’s place in the policies of urban planning: ‘How to represent “agricultural interests” in the face of “urban interests” in the decision-making process?’ (Jarrige et al., 2003). The French Urban Solidarity and Renewal act (SRU), passed in 2000 in the framework of the 1999 Act on Town and Country Planning and Sustainable Development (French abbreviation: LOADDT), and also called the ‘Voynet’ act, has put sustainable development at the core of the planning approach. In this framework, new tools of territorial planning have emerged. The Urban Master Plan (SCOT) replaces the Land Management and Urban Development Plan (SDAU) and becomes the principal planning tool at the intercommunal scale. Apart from harmonizing planning policies at the territorial scale (in particular, the Local Urban Plans (PLU)), this new procedure emphasizes a balanced management of urbanized, natural and rural spaces by the establishment of Sustainable Development Plans (French acronym: PADD). These latter represent the territorial project and allow transversal planning issues to be spatialized (Cete-Méditerranée, 2007). To support the new action mechanisms and to develop planning policies that are consistent at the territorial scale, in particular in terms of preserving the agricultural heritage, planners require their detailed knowledge. These planners are hankering for spatial tools to monitor changes in land-use caused by the dynamics of urban sprawl.
But there currently exist few generalizable and reproducible methods designed specifically for quantitative and qualitative monitoring of agricultural lands consumed by built-up surfaces. The tools developed so far are usually limited as to availability and heterogeneity of data, thus limiting the possibilities of reproducibility. Moreover, they are mainly developed in an urbanistic approach, often considering rural spaces in terms of land banks that can be constructed upon rather than in terms of agricultural or environmental heritage that needs preserving. It is in this context that the methodological study commissioned by DRAF Languedoc-Roussillon titled ‘Analysis of the potential of agricultural lands affected by territorial planning’ is placed. This request is part of the context of the revamping of measurement tools for aiding decision-making. Within this framework, we are working towards a generalization of indicators.
1.2. Generalization of the use of indicators, multifunctional tools for aiding decision-making ‘Indicator’ is a polysemous term represented by different approaches and definitions. In general-purpose dictionaries, indicator is defined etymologically via its indicative function ‘which indicates something, which contributes information’ (Encyclopédie Universalis, 2009). The term then branches out differently depending on the usage domain (general language, economics, statistics, chemistry, etc.). In the scientific literature, we often find the definition provided by the OECD (1990) according to which the indicator is ‘a parameter, or a value derived from one or more parameters, that indicates, supplies information, describes the state of a phenomenon, environment, or zone, with a significance which extends beyond that which is directly associated with the parameter’s value’. Nevertheless, this
definition does not encompass the entirety of purposes of an indicator such as, for example, as a tool to aid communication. The bibliography (OECD, 1994; IFEN, 1997; EEA, 1999; cited by Salles (2001); Bockstaller, 2008) insists on three characteristics that allow an indicator to be defined. It has to be, at the same time, issued from a model (thus ensuring its reliability, its relevance and its measurability), an explicit synthesis of information and a communication tool. Rey-Valette and Chia (2007) affirm that an indicator is characterized by a multiplicity of functions. It allows a problem ‘to exist’ and thus has an inventory function. It also possesses a mediation function in so far that it helps converge the representation of different actors. Joerin and Rondier (2007) differentiate between ‘revelatory’ indicators and ‘evaluation’ indicators; the former allow a phenomenon to be described, the latter form part, more directly, of decision-making processes. Within the context of these definitions, we are interested here in particular in the first group of indicators, via a method for designing a system of spatial indicators to aid decision-making.
It was in the decades following the Second World War that the idea of including measurement and evaluation instruments in public policy took hold (Sénécal, 2007). From the mid-1980s, models for establishing biodiversity indicators were proposed by large international organizations. The best known, the Pressure/State/Response (PSR) model of the OECD, distinguishes three broad categories. ‘Human activities exert pressure on the environment (Pressure) and impact the quality and quantity of its natural resources (State). Society responds to these changes by adopting environmental, economic and sectoral policies, taking into account the changes that have ensued and thus adapting its behaviour (Response)’ (OECD, 1993). Since 1998, the European Environment Agency uses a five-compartment model: DPSIR (for Driving forces, Pressures, State, Impact, Responses; EEA, 1998). In 1992, with the official adoption of the concept of sustainable development at the Rio summit, was affirmed ‘the necessity of obtaining quantitative information to measure progress on the route to sustainability’ (Bovar, 2008). Since then, the tables and scorecards of sustainable development indicators (SDI) have been generalized (Zuinten, 2004; Eurostat, 2005; Lavoux, 2006 cited by Rey Valette et al., 2006). However, the limitations of their applicability and the difficulty in proposing integrated and concerted approaches remain manifold. The multiplication of initiatives for creating indicators at every territorial scale is characterized by a wide heterogeneity and an absence of clear theoretical foundation. As notes Lazzeri (2006), ‘The integration of the different dimensions of sustainable development, the opening towards the future and the articulation of spatial scales demands a revamp of territorial expertise and the invention of new measurement tools. Although, since Rio, a large number of initiatives have been launched, there does not as yet exist an acceptable and shareable framework on this topic.’
1.3. Limitations of methods for developing Sustainable Development Indicators
In the absence of a consensus on the methods for creating indicators, the approaches developed by public institutions and research laboratories vary widely, as do the scales of production. In general, we can differentiate global approaches for creating generic indicators (international, national or regional levels) from local methods for producing indicators adapted to the issues specific to a territory. Lazzeri and Moustier (2006) thus distinguish between ‘diagnostic’ indicators (e.g., IFEN, ARPE, INTERRG), indicators of processes designed to monitor and evaluate urban projects (e.g., Agenda 21, SCOT) and synthesized indicators (e.g., HDI4). In France, the generalization of the SDIs has been accompanied by the establishment of mechanisms for decentralized management. The attempted translation of the gamut of SDIs at the international scale (e.g., the 134 indicators of the UNO in 1995) to national, then more regional, scales highlights the limitations of such tools. Apart from the discouraging effects of such long lists (Lavoux, 2006), these indicators are often sectoral in nature and proposed by mainstays of sustainable development (social, environmental, economic) with a clear weightage towards the environment, whereas the application of sustainable development seems to require a transversal approach. As emphasized by Deprez and Bourcier (2003), ‘The initiatives so far at the world level (OECD, United Nations, European Union), as well as at the national scale (IFEN) on the themes of SDIs usually culminate with definitions of so-called “environmental” indicators rather than with genuine tools for evaluating the existing system’s sustainability.’ Finally, the indicators produced at the international scale appear very often to be too general to be able to define the issues of sustainable development at a regional or local scale with any relevance. In consequence, this type of
4
Human Development Index: ‘The oldest composite indicator, established by the UNDP in 1990, it combines three basic indicators corresponding to life expectancy at birth, standard of living and educational level’ (Germaneau, 2008).
initiative is often destined to fail and these lists of indicators remain little used due to their lack of social legitimacy and application (Chamaret, 2006).
These methodological questions (integration, specificity and appropriation) lead to the fundamental one on the choice of the analysis scale. In fact, it seems that the initiatives undertaken for local territorial issues are most suitable for developing an integrated and concerted approach. But the opposition between the top-down approaches (international initiatives) and bottom-up approaches (cooperation of actors) need not dominate the debate since each has its own limitations. Chamaret (2006) emphasizes that if the former often lack social legitimacy and appropriation by the actors, the latter lack ‘transferability’. In fact, an indicator’s adaptability is the proof of its effective transferability in different economic, political and social contexts (Deprez and Bourcier, 2003). The methods appear to be complementary (Lazzeri and Moustier, 2006). Nevertheless, it seems that requirements for local indicators, for issues of planning specific to a territory, are more important. In fact, according to Audouit, Puech, Honegger (2006), ‘In spite of the interest in SDIs, these tools remain little developed at the local scale.’
Nevertheless, we are witnessing a recent evolution towards methods for producing SDIs that emphasize an integrated and concerted approach at the territorial level. According to Hélène Rey-Valette et al. (2008), this trend follows the evolution of public policy and action in the last thirty years: centralized planning, decentralization and participation, processes of co-creation. The integrated approach concerns the interactions between the mainstays of SDI. For example, the approaches of IFEN and Eurostat which are working on some ten flagship SDIs have tried to link the economic, environmental and social dimensions (Lavoux, 2006). Since 2003, ARPE and DIACT have broken down national indicators to the territorial level by adapting them to local issues (INSEE, 2008). The conference in Montpellier, France, in 2006, on the uses of SDIs showed the growth in concerted approaches (Maurel and Roussillon, 2007; Desthieux, 2004; Roussel 2007). According to Rey-Valette et al. (2006), the co-construction presupposes the design of a common repository to identify sustainability issues. The integration of the spatial dimension in this type of approach seems to favour a transversal and shared representation of sustainable development issues.
2. Spatial indicators: are they suitable tools for supporting decision-making?
We advance here two hypotheses on the use of the spatial dimension in the approaches for constructing indicators for aiding decision-making. On the one hand, this type of approach emphasizes a transversal and systemic viewpoint, indispensable in our opinion for tackling the territorial complexity and the attendant issues of sustainable development (in particular to overcome the limitations of the choice of an analysis and action scale). It leads to a simplified vision of a complex geographic system’s reality by providing sense to the organization of objects in the space. On the other hand, the spatial dimension can be a tool for aiding cooperation in the understanding of a territory’s development issues. It contributes to the appropriation (and subsequently to the legitimization) of the tool by the actors.
These are the fundamental hypotheses of our work that we are attempting to justify. This choice will force us to state what we understand by ‘geographic indicator’, a term that, according to Maby (2003), remains to be clarified. Existing literature does, in fact, exhibit confusion in the use of the terminology that characterizes this type of indicator. It therefore seems important to us to state what we mean by territorial indicator and spatial indicator. In the context of the proliferation of initiatives for producing indicators for aiding decision-making, we will see that these spatial tools offer potential that has been, so far, little or ill explored.
2.1. The contribution of the spatial dimension: an approach adapted for translating the territory’s complexity
We back the idea that a spatial approach leads to a systemic vision of a territory’s development issues. Joerin and Rondier (2007) recall that the territory is a complex system and, consequently, its representation requires the establishment of a model. A system is ‘a set of elements in dynamic interaction, organized in pursuit of a goal’ (De Rosnay, 1975). For Deprez and Bourcier (2003), one of the main objectives of indicators is in their ability to simultaneously and non-isolatedly take into account a complete set of parameters which are representative of a situation. According to Maby (2003), ‘the explicative function of the geographic indicator consists in identifying the mechanisms that link objects between or within them, in an aim of extracting rationality.’ The Geographic Information
Systems can prove to be suitable tools for constructing a systemic representation. Thus, Deprez and Bourcier (2003) list several arguments in favour of increased recourse to GIS tools for the creation of sustainable development indicators:
- the possibilities of conducting multicriteria analyses (data correlation, integrated approach, composite indicators);
- using space as a basis of the study can help translate complex and abstract phenomena since space is a means of representing the reality of the terrain;
- their operational character and their purpose (tools for management, planning, scheduling; communication or information tool).
If we can model the spatial dynamics, not only do we have the possibility of proposing an integrated approach but also of constructing a shared spatial representation. By itself, a system of indicators constitutes a directly usable tool for aiding decision-making and for sensitization. Work done during the drawing up of the urban master plan of the Thau Territory, by Cemagref in collaboration with SMBT, illustrates the contribution of the spatial dimension in a participative approach in territorial diagnostics. ‘The geographic information is very important when drawing up an urban master plan. Not only is it used to produce and represent the knowledge of the territory but also to accompany a process of collective learning by the various actors involved. Finally, it also has a role in informing the public’ (Maurel, Roussillon, 2007). Different geographic tools are called upon (participative cartography, floor charts, cataloguing, opinion gathering, etc.) and a protocol for evaluating these tools, their uses and their impact on the participative process is proposed. Desthieux (2004) too demonstrates the relevance of using spatial indicators in a participative process in local diagnostics. According to him, the purpose of the geographic indicator is to ‘represent the spatial heterogeneity and variability of phenomena on the territory’. He makes a distinction between thematic indicators which inform on the shape, the structure and the organization of the object in the space. He thus demonstrates the relevance of developing information tools based on spatial indicators to support upstream decision-making.
2.2. What is a spatial indicator?
Weber and Hall (2001) illustrate the issues involved in defining concepts of geographic indicators by distinguishing between the expressions ‘spatial indicators’ and ‘territorial indicators’. It seems relevant here to try to clarify the use of these two concepts to justify our choice of the use of the spatial indicator. The difference between these two concepts lies in their relationship to the geographic object5. Di Méo (1998) advances the following distinction between the geographic concepts of space and of territory. The first expresses the initial unity of the world whereas the second represents its social and human diversity. The territory can perhaps thus be defined as an appropriated space (in the sense of lived-in space and social space; Baud, 1997). Decroly and Grasland (1996) distinguish two principles of geographic organization:
- the principle of spatial organization, linked to the concept of distance and, more generally, to that of proximity;
- the principle of territorial organization, linked to the existence of partitions of the space into disconnected subsets or indistinct subsets.
The territorial approach appears thus more limited because it is linked to a scale of analysis and plotting (partition of space). On the other hand, the spatial approach looks for a meaning, explanatory factors and causal links via the organization and localization of geographic objects in the space (distribution, discontinuity, distance, etc.). It is in this perspective that Maby (2003) proposes aspects of the spatial indicator: ‘The spatial indicator defines the position of the geographic object and permits the search for spatial auto-correlation.’ However, the territorial approach seems to dominate most approaches in developing measurement tools, in general, and indicators, in particular. Grasland and Hamez (2005) underscore the fact that until very recently, the preponderance of published work on the measurement of social cohesion or economic development completely neglected to take the spatial dimension into account. This fact is linked to the limitations in the production of the source data at the scale of territorial organization (region, commune, parcel, etc.).
2.3. Use of geographic information limited to its territorial dimension?
5
Maby (2003) lists three fundamental characteristics that essentially constitute the geographic object: the spatiality (it is a location or set of locations, it is located and mappable), the constructivity (creation of cognitive procedures) and the systemic complexity.
This problem of data production limits the use of geographic information with regards to the new possibilities in the domains of spatial analysis and modelling. Chéry (2003) identifies two problems in the use of spatial analysis and modelling, and by extension, in the construction of indicators: the scale and the side effect. The issues arising from the change in scale is a significant limitation and one that remains unresolved. Source data is produced at a territorial scale and this prevents the plotting of indicators at other geographic scales. Side effects are the direct and unforeseen consequence of the choices made at the time of the system’s territorial delimitation, conveyed at the stage of data production. These result from the production of geographic information at the level of the organization of geographic spaces that are smaller than the globe itself. They restrict the spatial analysis processes because of the limits of spatial interaction, whereas the phenomena themselves (environmental, social, etc.) are usually continuous and not limited to the bounds of a discrete space. Usage of geographic information remains low and is often limited to its representation by way of localization, situation and land-cover maps. Thus, the large number of indicators that are usually proposed to describe the urban sprawl do not take into account causal relationships that could be inferred from the organization of objects in the space. We present below two examples of indicators that show this difficulty of overcoming the limitations arising from the choice of an analysis scale: Number of housing units for given periods by commune (Cete-Méditérranée, 2007); Mean surface area artificialized annually since 1977 in the maritime coastal communes (DRE, 2007). The phenomena are reduced to being represented by the localization and their land coverage without any relationship to their function in a geographic system. And yet, the localization can also be a factor that helps explain the organization of geographic objects in space and thus aid the comprehension of interactions (man, resources, activity) that structure and create the territory. This is what we are trying to show – in response to the request of DRAF – via the development of an iterative method of co-construction of spatial indicators. Our goal is to propose an approach that is both systemic and coordinated, which goes beyond the weaknesses of existing measurement tools that accompany the decision-making processes.
3. Methods and results
Our methodological choice concerns the production of an artificialized patch and a land-quality index, continuous information, as base data for creating indicators. This allowed us to envisage a spatial and systemic approach unrestricted by the issues of scale and side effects. In addition, the approach adopted for producing indicators relies on an iterative process of co-construction with the users. It thus offers interesting perspectives for overcoming the limitations of current measurement tools.
3.1. Proposal of a method for producing continuous data
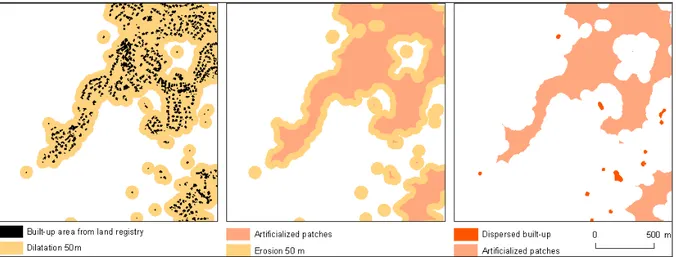
As far as quantification is concerned, the methodological study took stock of the generalizable spatial methods that allow the measurement of land cover of artificialized territories and its monitoring over time (past and future). Three types of items are directly connected to the growth of towns in space and are thus factors in land artificialization: habitat zones, activity zones, and transport infrastructure. The term ‘artificialized patch’ was preferred over ‘urban patch’ since we are interested in comprehensive information. A nomenclature that is common to all the envisaged methods has been defined to be able to characterize elements of the artificialized patch (urban fabric, industrial and commercial zones, communication infrastructures, building sites and landfills) and thus allow comparison of potential results. The method selected to determine this form of land use is an operation of mathematical morphology6. It consists in applying to the studied data successive dilation/erosion operations characterized by the continuity of the built-up areas, which depends on the distance between buildings and the infrastructure. This criteria has to be taken into account in order to decide whether or not they belong to the same zone. The figure below illustrates this operation of aggregating the elements that make up the artificialized patch.
6
Figure 1: Steps in the creation of an artificialized patch using built-up objects extracted from the digital land registry (2007, Commune of Vailhauques, source DGI)
An inventory of vectorial geographic data and images available for the creation and monitoring of this artificialized patch was then drawn up. Because of the requirement of the potential generalization of the method, four types of processes with associated data were used:
- The exploitation of artificialized patches provided by the DB Corine Land Cover usable in an initial approach, but too imprecise (grid of 25 ha);
- The production of artificialized patches from satellite images (SPOT 1, 3, 5 and IRS) led to good results (exhaustiveness and geographic precision). This method is also the one that allows us to go furthest back in time (1989). However, the quality of the acquired images and their acquisition date are the determining factors. Moreover, this is a method requiring significant technical and human resources, especially if periodic monitoring is required;
- The production of artificialized patches from precise vectorial data of the built-up area (DB Topo®, digital land registry). Compared to the other methods, this is easier to reproduce but has problems with updating and exhaustiveness of the represented information;
- The combination of vectorial data and satellite images can be used to provide a history of the changes of the artificialized patch (use of satellite images) and to propose a method of periodic monitoring (vectorial data). This is relatively easy to implement but is not exhaustive. In addition, this method suffers from significant limitations caused by the heterogeneity of the data sources.
As far as quality is concerned, a quality index for the land in Languedoc-Roussillon has been developed and implemented to gauge the long term and very long term potential of Languedocian lands. Using existing reference land-quality indicators from the literature, an index that can define 4 broad classes with 16 sub-classes was constructed. It uses a logical combination of ‘diagnostic’ land properties (decision tree) at three levels: definition of absolute constraints for agricultural production (slope and salinity); classification of typological soil units without absolute constraints into three classes of quality from their water reserve; subdivision of these three classes by considering minor constraints for agricultural production (hydromorphy, stoniness, tendency of crusting or pH imbalance). The index thus produced has been spatialized over the test zone by using the Regional Pedological Repository of Languedoc-Roussillon.
During the pursuit of the methodological study, it became necessary to us to propose a method of producing spatial indicators for translating and comprehending results.
3.2. An iterative approach for co-construction of spatial indicators
For the best appropriation of SDIs, Audouit et al. (2006) recommend an interactive and iterative approach between scientists and users. It is this type of collaborative approach that we have adopted. We have thus regular interaction with the users who will use the indicators (DRAF and DDAF). The main issue with approaches for developing systems of indicators is that of the choice of indicators. However, as emphasized by Joerin and Rondier (2007), it is more important to design a system than to choose indicators. The co-constructional approach should lead to the development of a systemic model of the dynamics of urbanization in the Mediterranean zone. Thus, limitations of transversality
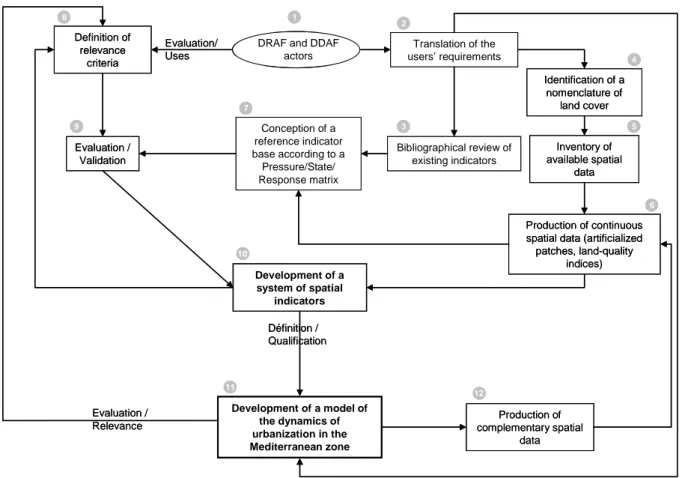
and applicability of existing indicators have to be overcome by the drawing up of a systemic vision that can be shared with the users. The figure below shows the broad stages of this iterative process.
DRAF and DDAF actors Translation of the users’ requirements Bibliographical review of existing indicators Conception of a reference indicator base according to a Pressure/State/ Response matrix Development of a model of the dynamics of urbanization in the Mediterranean zone Evaluation/ Uses Evaluation / Relevance Development of a system of spatial indicators Definition of relevance criteria Evaluation / Validation Production of continuous spatial data (artificialized
patches, land-quality indices) Inventory of available spatial data Identification of a nomenclature of land cover Définition / Qualification 1 12 3 4 5 7 6 9 8 10 11 Production of complementary spatial data 2
DRAF and DDAF actors Translation of the users’ requirements Bibliographical review of existing indicators Conception of a reference indicator base according to a Pressure/State/ Response matrix Development of a model of the dynamics of urbanization in the Mediterranean zone Evaluation/ Uses Evaluation / Relevance Development of a system of spatial indicators Definition of relevance criteria Evaluation / Validation Production of continuous spatial data (artificialized
patches, land-quality indices) Inventory of available spatial data Identification of a nomenclature of land cover Définition / Qualification 1 1 12 12 3 3 4 4 5 5 7 7 6 6 9 9 8 8 10 10 11 11 Production of complementary spatial data 2 2
Figure 2: Iterative approach for co-construction of spatial indicators
As seen from the figure, before embarking on such an approach, it is indispensable to conduct an in-depth analysis of the users’ requirements. DRAF’s initial request consisted of two major aspects:
- a desire of comprehension, to contribute to the overall analysis of the dynamics at play and to increase awareness of the loss of agricultural heritage.
- a call to action to quickly locate the best lands and to reinforce the views of local personnel (DDAF, etc.) for an increased consideration of agricultural lands during the drafting of town planning documents.
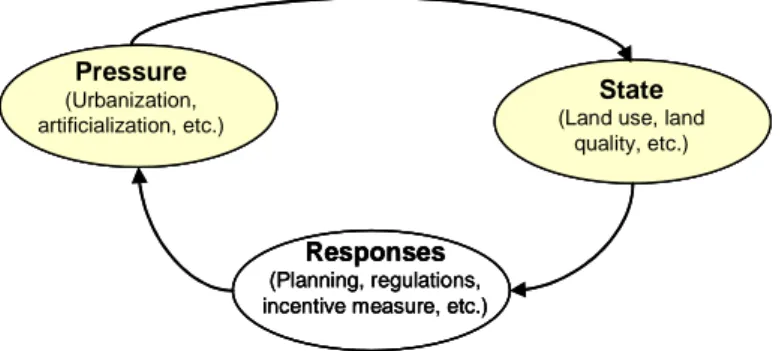
The translation of this request can be summarized in three types of requirements: increasing the existing knowledge of agricultural heritage, qualitatively, quantitatively and spatially; identifying the factors in the artificialization of agricultural lands and understanding the processes at work (interactions); and, finally, assigning priorities to aid decision-making but also to support communication about and sensitization of the loss of agricultural heritage. To respond to these requirements, we have attempted to construct a base of reference indicators from a bibliographical survey of existing indicators. We have then classified these indicators according to the Pressure-State-Response matrix proposed by OECD. The figure below shows how we have adapted the PSR model for our study.
Pressure
(Urbanization, artificialization, etc.)
State
(Land use, land quality, etc.)
Responses
(Planning, regulations, incentive measure, etc.)
Pressure (Urbanization, artificialization, etc.) Pressure (Urbanization, artificialization, etc.) State
(Land use, land quality, etc.)
State
(Land use, land quality, etc.)
Responses
(Planning, regulations, incentive measure, etc.)
Responses
(Planning, regulations, incentive measure, etc.)
Figure 3: Pressure-State-Response model adapted for the study
This base of reference indicators was then submitted to the users for their evaluation and feedback. Joerin and Rondier (2007) affirm that any effort at consensus with the actors over the design or for the contents encourages appropriation by them. They also point out the enriching nature of this learning phase. In parallel, we evaluated these indicators’ capacity to describe and qualify our systemic model. This stage allows us to define relevance criteria on which to base ourselves to co-construct spatial indicators using which we shall finalize the systemic model.
3.3. Production of a first set of reference indicators
Within the framework of our study, we had to propose, on the one hand, indicators on the state of land use and on soil quality and, on the other, indicators on the pressure of conversion of land to artificialized surfaces. It was possible to develop these reference indicators using generated data (artificialized patches, land-quality indices) and supplementary data selected during the inventory phase (statistics on housing, demography, zoning, etc.). 21 basic reference indicators were identified, classified into seven categories. They can be divided into broad themes: 13 indicators relate to the quantitative aspects of land use and land artificialization and 8 indicators do the same for quantitative and qualitative aspects of the land’s agricultural potential. Composite indicators that correlate quantitative and qualitative information (e.g., degree of artificialization as a function of land quality) are also proposed. Others combine external data (demography, statistical zoning, urbanistic zoning). Data availability has influenced the choice of the spatial method and thus the technical characteristics (spatial scale, temporal scale, update frequency, etc.) of the final indicators.
The method of qualifying agricultural soils proposed by the LISAH JRU team, developed using the Sol DB (1:250,000), influenced the choice of the scale of precision. Consequently, the communal and intercommunal scales have been retained for the plotting level of the indicators. Beyond this threshold, the agricultural qualification data was not ‘readable’. And yet, as we have seen, the development of a spatial approach should not be bound by the technical limitations imposed by the choice of a particular scale of territorial representation. That is why we plan on developing a spatial approach that overcomes these types of limitations to improve the indicators. In addition, the extent of the zone under study varies from 3 communes (3,670 ha) to 103 communes (172,056 ha) depending on the data we use. For example, indicators drawn from the processing of data from the TOPO® DB 2001 are limited to a coverage of 18 communes (34,345 ha), whereas those drawn from the processing of satellite images cover the entire zone. In the continuation of this study, we propose to homogenize the extent of all the indicators by using data available for the four coastal départements7 in Languedoc-Roussillon, i.e., 1,361 communes (about 22,670 km²).
The reference periods also present a wide heterogeneity. Those provided by the satellite image temporal series are for the years 1989, 1996, 2000 and 2005. Data originating from the different versions of the TOPO® DB correspond respectively to the aerial photography campaigns of 2001 and 2005, but this database is updated continuously. The demographic censuses date from 1999 and 2000; the new census procedure applied to the 2004–2009 period estimates the population for 2006. Finally, the pedological map dates from a land inventory taken in 1992, and the dates of the last update of various town planning documents range from 1987 to 2005. In the same way as for the spatial plotting scale, we plan on a homogenization of data dates. The ideal for correlating data and to
7
allow comparison of results would be an update frequency of 5 or 10 years (1990, 1995, 2000, 2005, and so on).
The set of spatial layers used for calculating the indicators are vector files that can be opened in the ArcGIS 9.2 software application, with the exception of the demographic censuses which are in spreadsheet format. Results are presented in the form of a scorecard. Each indicator is described by a summary sheet (calculation procedure, technical details, critical analysis, interpretation) and accompanied by representations (maps, tables and graphics). The full list of spatial indicators selected is provided in Annexures 2 and 3, as is an extract from a scorecard for indicator 1.1 (Extent of land-use themes at a recent date in percentage). Even here, we intend to refine the procedure by transforming the produced scorecard into a system of indicators.
4. Perspectives: adapting the method of producing spatial indicators
4.1. Overcoming the technical limitations to be able to propose a spatial approach
The problem of the spatial extent of the zone under study appears to be the most difficult to resolve. How to overcome, for example, the choice of a spatial plotting scale (administrative delimitations, etc.)? One of the goals of our method is to generate spatial indicators that overcome this limit. To do this, the indicators have to express the characteristics of the spatial shapes and relative positions of the objects in the space. The spatial analysis approach we propose for producing artificialized patches is based on mathematical morphology. From this continuous data, we can propose different levels of construction of spatial indicators (inspired by landscape ecology and adapted from Chéry, 2003) also based on the following types of morphological processes:
- at the level of an artificialized patch: appearance, disappearance, stability, displacement, complexification, simplification, deformation and orientation;
- at the level of a set fragmented into several patches: fragmentation, coalescence and orientation;
- at the level of several sets: conditional progression and regression (of one habitat at the expense of another), remote pressure.
For an artificialized patch, we can apply ‘preferential’ orientation indicators and indicators for shape relationships over time. With granulometry, it is possible to recognize mean surface indicators for the extent of built-up areas, of parcelling, of orientation around an artificialized patch and a set of patches. At the level of several sets, we can measure the spatial density. In addition to the limitations imposed by the choice of the territorial scale, the experiment also has to contend with the choices of the way of expressing spatial indicators. Joerin and Rondier (2007) distinguish the scorecard, which only provides a sectoral vision, from the system of indicators, which seems more suitable to translate the complexity of a territory’s reality.
4.2. Going from the scorecard to the system of indicators
A territory’s diagnostics and the understanding of its underlying dynamics derive from the study of the interactions and processes at work therein. To propose indicators that offer an integrated vision of the issues of territorial development, the model should be adapted to a system of indicators. As emphasized by Joerin et al. (2005), ‘For indicators to be truly useful for decision makers during the formulation of a problem, it seems necessary to go from a set of indicators to a true system of indicators that by itself will be a model of the territorial complexity.’ The indicators are associated with geographic objects which are linked amongst themselves by semantic or causal relationships. The traditional scorecards offer only sectoral information, with indicators considered independent. This is also the case with our results as taken currently (cf. Annexure 3). The issue is to be able to define the interactions to translate this scorecard into a system of indicators. In a similar fashion to the definition of our goals, the drawing up of a list of causal relationships can be based on a series of interviews and workshops. We have conducted a first workshop bringing together scientists and actors of the agricultural sector. A first set of spatial indicators was studied, for example: the fragmentation of agricultural land by dispersed and isolated habitat; change in densities (correlating the land artificialization data and demographic growth); classification of farms for the purpose of supplementing the soil-quality data (correlating parcel size, access to irrigation, farm consolidation). In addition, Joerin and Rondier (2007) demonstrate that the analysis of the causal relationships can lead to the identification of ‘top-most’ indicators (which influence other indicators but cannot be influenced themselves) and ‘bottom-most’ indicators (which can be influenced by other indicators but cannot
influence any other indicator). Consequently, the relational scheme linking the indicators highlights the importance of each indicator in the system’s functioning. In our case, causal links have to be established between the 21 proposed indicators. This will allow us to target interactions linked to the spatiality of various phenomena. Since our goal is to use the potential of spatial modelling by finding a sense to the organization of objects in space, we will also have to evaluate the consistency and operational aspect of this system of indicators.
4.3. Develop a co-evaluation method
The evaluation will be based on a definition, arrived at in conjunction with actors of the agricultural sector, of the criteria of indicator relevance (cf. figure 2). Relevance criteria depend, on the one hand, on their capacity to describe and qualify the model and, on the other, on how useful they prove to the users. The latter’s feedback on these measurement tools in terms of transferability, applicability, calculation method, plotting, etc. is an important part of the evaluation process. Conducting interviews with actors of the agricultural sector is part of the approach. In fact, it is the usage of the indicators by the actors which will principally determine their relevance. Involving actors in the process of creating indicators will also help their appropriation. This involvement strengthens the evaluation of public policies both from the point of view of the legitimacy of reference bases as well as of the relevance of the measures and mechanisms put in place. Rey-Valette and Chia (2007) cite Offredi (2006) who states that, based on the legitimacy of the actors involved, the legitimacy of a system of indicators builds up in a constructive and reflexive manner. Several evaluation systems designed to validate the quality and relevance of indicators for aiding decision-making currently exist. We can look to an indicator’s quality criteria as defined by OECD (Germaneau, 2008). They are precision, topicality and regularity, data accessibility, clarity of form, data comparability and consistency.
Conclusion
We are witness to the growing role of geographic information as a tool in helping formulate public policy via increased usage of GIS and spatial analysis and modelling methods. Verburg (2008) affirms that in 1995 there were few operational models whereas in 2008 we could already count over a hundred (e.g., MOLAND, CLUE, Eururalis). Via our proposal, we have been able to demonstrate the contribution of the spatial dimension in constructing indicators for aiding decision-making. On the one hand, spatial indicators offer a simplified and integrated representation of a territorial system’s complexity. On the other, space can be a suitable basis for the construction of a shared representation of the issues of sustainability as long as it is not limited to its localization aspect when such types of measurement tools are designed. Several authors have shown that spatialization of issues provides an opportunity for a concerted approach and a common and shared representation. What remain to be overcome, however, are the limitations of the scale of analysis and action and the side effect resulting from data production at a territorial level. We can speculate about the map’s ability to constitute a suitable model for representing spatial interactions. This leads to the question of the plotting of these indicators and of the choice of representation to allow an integrated approach. The system of indicators, as defined by Joerin et al. (2005 and 2007), seems to indicate one way. In addition, as the study progresses, we expect to propose bases for cooperation that will offer a systemic vision of territorial issues. We draw inspiration from methods implemented in this regard. For example, the work of Maurel (2007) on the use of the spatial aspect as a framework in an integrated vision of a territory’s different dimensions. The iterative approach of co-construction of spatial indicators with DRAF and DDAF actors is a promising experiment in the use of the potential of geomatics. We have to, however, qualify our proposal; it is necessary to integrate other types of indicators along with spatial ones. As notes Tanet (2003), the territorial phenomenon cannot be reduced to this single spatial dimension.
Annexure 1: Acronyms and abbreviations
For French organizations and documents, the French-language acronyms/abbreviations have been retained.
ARPE: Regional Agency for the Environment (French: Agence Régionale Pour l’Environnement) Cete: Centre for Technical Study of Equipment (French: Centre d’Études Techniques de
l’Équipement)
CLUE: Conversion of Land Use Change DB: Database
DDAF: Departmental Directorate of Agriculture and Forests (French: Direction Départementale de
l’Agriculture et de la Forêt)
DIACT: Interministerial Delegation for Planning and Competitiveness of Territories (French: Délégation
Interministérielle à l’Aménagement et à la Compétitivité des Territoires)
DGI: Directorate General of Imports (French: Direction Générale des Impôts) DPSIR: Driving forces, Pressures, State, Impact, Responses
DRAF: Regional Directorate of Agriculture and Forests (French: Direction Régionale de l’Agriculture et
de la Forêt)
DRE: Regional Directorate of Equipment (French: Direction Régionale de l’Equipement) EEA: European Environment Agency
EPCI: Public Organizations of Intercommunal Cooperation (French: Etablissement Public de
Coopération Intercommunale)
GIS: Geographic Information System HDI: Human Development Index
INEA: Engineering-advice, Nature, Environment, Planning (French: Ingénieurs-conseil, Nature,
Environnement, Aménagements)
IFEN: French Institute for the Environment (French: Institut Français pour l’ENvironnment)
INSEE: National Institute for Statistics and Economic Studies (French: Institut national de la
Statistique et des Etudes Economiques)
JRU: Joint Research Unit
LISAH: Laboratory for the Study of Land-Agrosystems-Hydrosystems Interactions (French:
Laboratoire d'étude des Interactions Sol Agrosystème Hydrosystème)
LOADDT: Act on Town and Country Planning and Sustainable Development (French: Loi d'Orientation
pour l'Aménagement et le Développement Durable du Territoire)
LR: Languedoc-Roussillon
Moland: Monitoring Land Use/Cover Dynamics
OECD: Organisation for Economic Co-operation and Development
PADD: Sustainable Development Plans (French: Plan d’Aménagement et de Développement Durable) PSR: Pressure-State-Response
PLU: Local town plan (French: Plan Local d’Urbanisme) POS: Land use plan (French: Plan d'Occupation des Sols)
SCOT: Urban Master Plan (French: Schéma de COhérence Territoriale)
SDAU: Land Management and Urban Development Plan (French: Schéma Directeur d’Aménagement
et d’Urbanisme)
SD: Sustainable Development
SDI: Sustainable Development Indicator
SMBT: Joint Association of the Thau Basin (French: Syndicat Mixte du Bassin de Thau) SRU: Urban Solidarity and Renewal (French: Solidarité et Renouvellement Urbain)
TETIS: Territory, Environment, Remote Sensing and Spatial Information (French: Territoire
Environnement Télédétection et Information Spatiale)
UNDP: United Nations Development Programme UNO: United Nations Organisation
Annexure 2: List of reference indicators
At the end of the first phase of the methodological study commissioned by DRAF LR, on the monitoring of artificialization of agricultural lands and their qualification in terms of agricultural potential, a base of 21 reference indicators was proposed.
13 indicators on the quantitative aspects of land use and artificialization of land 1- Detailed land use as on a recent date
1-1 Land use (ha) 1-2 Land use (%)
2- Extent of artificialized territory on a give date 2-1 Extent of artificialized territory (ha) 2-2 Extent of artificialized territory (%) 3- Change in artificialized territory between two dates
3-1 Rate of change of artificialization (%)
3-2 Mean surface area artificialized annually (ha/year)
3-3 Rate of increase in surface area of artificialized territory between two dates (%) 4- Artificialization of land by space category
4-1 Zoning in urban areas (%) 4-2-1 POS and PLU zoning (ha) 4-2-2 POS and PLU zoning (%) 5- Demographic pressure
5-1-1 Demographic growth (%)
5-1-2 Demographic growth (number of residents)
5-2 Mean surface area artificialized per resident (ha/1 resident)
8 indicators on quantitative and qualitative aspects of the agricultural potential of soils
6- Loss of agricultural potential by Soil Typological Unit (STU) by percentage of Soil Quality Index (non-spatialized)
6-1-1 Extent of non-artificialized territories by STU (ha) 6-1-2 Extent of non-artificialized territories by STU (%) 6-2-1 Artificialization of lands by STU (ha)
6-2-2 Artificialization of lands by STU (%)
7- Loss of agricultural potential by Soil Map Unit (SMU) aggregated by majority Soil Quality Index (spatialized)
7-1-1 Extent of non-artificialized territories by SMU (ha) 7-1-2 Extent of non-artificialized territories by SMU (%) 7-2-1 Artificialization of lands by SMU (ha)
Annexure 3: Extract from the scorecard of indicator 1.1. (Extent ofdetailed land-use themes as on a recent date in percentage)
Indicator name 1. Land use
Definition 1.1. Extent of detailed land-use themes as on a recent date
Type State
Technical information
Data description Object-oriented classification of a Spot 5 satellite image of 27/04/2005 (resolution 2.5 metres)
Coverage 103 communes, i.e., 172,056 ha of which 99 communes fully covered, i.e., 167,364 ha
Unit %
Date 2005
Plotting nomenclature Nomenclature of land use at 4 levels of precision including, respectively, 4, 8, 14 and 19 themes
Plotting scale Intercommunal or communal
Calculation method Calculation of a surface area value then of the ratio of this area to the study zone’s surface area. Merging of the field (of the column) of the plotting nomenclature corresponding to the level of the desired land-use detail (1, 2, 3, 4). Sum of the surface areas (during merging) with each of the themes of the retained nomenclature.
Production frequency Annual
Evaluation of information
Relevance of data to the indicator’s objectives
The indicator’s objective is to indicate a state of land use as on a recent date, in particular the artificialized territories, reliably and suitable for calculations of past and future changes. The satellite image’s high resolution and the semi-automatized object-oriented classification method offer a precision that allows relevant information on artificialized territories to be deduced.
Temporal comparability
This indicator is not comparable over time since land-use information at this level of detail is determined only for the most recent date. For earlier dates, the satellite images are processed from the thematic plan of the artificialized patch obtained using this classification, and the output nomenclature allows distinction between just two themes: artificialized territories and non-artificialized territories. For later dates, only the new artificialized surfaces are detected. However, we can envisage producing a classification at a later date if we opt for a method that uses satellite-image processing. Spatial comparability The results are comparable between communes
Usage limitations This indicator does not allow monitoring over time
Help in interpretation This indicator offers detailed information on land use on a reference date. Refer to level 4 of the nomenclature for precise information on the objects that make up the main classes (agricultural, natural and artificialized territories). Most notably, this indicator provides a level of detail on habitat types: continuous, discontinuous, dispersed.
Interpretation offered The 103 communes (172,056 ha) of the study zone present a significant agricultural and natural footprint; these spaces occupy 78% of the territory with 31% classified as agricultural territories and 47% as natural environments. Artificialized surfaces account for 13%, of which 5% are non-built-up and 8% as built-up spaces. Within these built-up spaces, the large majority is the urban fabric (5.8%), the rest is equally divided between major infrastructures (1.2%) and industrial and commercial zones (1.3%). In the entire zone under study, 35 communes have a level of artificialization greater than 13%, with the most urbanized communes being those attached to the urban centres of Montpellier and Sète and, to a lesser degree, in the north-west (Clermont l’Hérault). The map highlights a continuous urbanization extending from the east to the west along the length of the coast and along the major communication routes in the area. For example, the urban commune of St Jean de Védas attached to the urban centre of Montpellier has 29% of artificialized territories of which 13% are continuous residential habitats and 10% are commercial and industrial zones. Agricultural lands represent 27% and forests 22%.
Proposed representations
Extents of different land uses aggregated to the scale of the zone under study:
Bibliographie
ARPE (2001). Diagnostic développement durable urbain. Tome 1 - Le questionnaire. Toulouse, ARPE Midi-Pyrénées. 76 p.
Baud P., et al. (1997). Dictionnaire de la géographie. Paris, Hatier. 509 p.
Bockstaller C. (2008). Les indicateurs de durabilité, du choix au tableau de bord. Colloque de restitution du projet OTPA, Lyon, 5 mai 2008. 18 p.
Bovar O., et al. (2008). Les indicateurs de développement durable. Paris, INSEE. 23 p.
Cete-Méditerranée (2007). Les évolutions des territoires littoraux 1986-2006. Annexe 2, index méthodologique. Lyon, DGUHC-PA, Cete Méditerranée, Cete Sud Ouest, Cete Ouest, Cete Nord-Picardie, Cete Normandie-Centre. 68 p.
Cete-Méditerranée (2007). SCoT et développement durable. Lyon, Certu, Collections du Certu, Dossiers 189. 92 p.
Chamaret A., et al. (2006). Approche top-down / bottom-up pour l’élaboration d’indicateurs de développement durable applicables au secteur minier. L’exemple des mines d’uranium du Niger. Colloque international : Usages des indicateurs de développement durable - Mise en relation des pratiques et savoirs pour les ressources marines et les territoires littoraux avec les acquis d’autres domaines et espaces, Montpellier, 3 et 4 avril 2006. 15 p.
Chéry J.P. (2003). Réflexion sur une expérience de construction d'indicateurs spatiaux pour l'environnement. 10 p..
CPDT (2000). Chapitre V : Indicateurs de développement territorial. In: Rapport d'activité de la subvention 1999. Cellule "Base de données". Liège, CREAT/LEPUR. 9 p.
Deprez S., Bourcier A. (2004). Vers des indicateurs de développement durable pour connaître, informer et décider : réflexion méthodologique appliquée à l’étude des effets environnementaux du transport de marchandises en ville. Colloque développement durable. Leçons et perspectives, Ouagadougou, 1 au 4 juin 2004. 10 p.
Desthieux G. (2004). Utilisation d’indicateurs spatiaux dans un processus participatif de diagnostic de quartier à Saint-Jean. EPLF, Genève. 28 p.
Di Méo G., (1998). De l’espace aux territoires. In: L’information Géographique, n°3, Ed. SEDES. pp.99-110.
Decroly J.-M., Grasland C. (1997). Organisation spatiale et organisation territoriale des comportements démographiques : une approche subjective. In: Bocquet, J.P. (Ed.). Analyse spatiale des données biodémographiques : approches récentes. Paris, John Libbey/INED. pp. 131-156.
DRE des Pays de la Loire (2007). Caractérisation du développement urbain dans les Pays de la Loire. Fiche n°7 : La progression des surfaces artificiali sées dans les communes littorales maritimes. Nantes, Cete-Ouest. 8 p.
EEA (1998). Guidelines for Data Collection and Processing. EU State of the Environment Report, Annex 3. Copenhague, EEA.
Germaneau C. (2008). Les indicateurs du développement durable : Pour qui ? Sous quelle forme ? Et quel degré de pertinence ? (Article 1/1). Synerblog Association Synergiz.
Grasland C., Hamez G. (2005). Vers la construction d’un indicateur de cohésion territoriale européen ? L'espace Géographique, v.2. pp.97-116.
IFEN (1997). Indicateurs de développement durable - Bilan des travaux étrangers et éléments de réflexion. Orléans, IFEN, Collection Notes de méthode n°8. 72 p.
IFEN (2003). L'étalement urbain. 45 indicateurs de développement durable : une contribution de l'Ifen. Etudes et travaux, n° 41. pp.78-79.
Jarrige F., Jouve A. M., et al. (2003). Et si le capitalisme patrimonial foncier changeait nos paysages quotidiens ? Courrier de l'environnement, n°49. pp. 13-28.
Joerin F., et al. (2005). Des systèmes d'indicateurs pour aider les acteurs à manipuler les complexités territoriales. Colloque Développement durable, gestion des ressources et gouvernance, Lausanne, 21-23 septembre. 9 p.
Joerin F., Rondier P. (2007). Chapitre 1. Les indicateurs et la décision territoriale. Pourquoi ? Quand ? Comment ? In: Sénécal, Gilles (Dir.) Les indicateurs socioterritoriaux. Perspectives et renouvellement. Laval, PUL (Les Presses de l'Université de Laval). pp. 9-36.
Lavoux T. (2006). L'offre et la demande d'indicateurs : les leçons des expériences internationales, nationales et locales. Colloque international : Usages des indicateurs de développement durable - Mise en relation des pratiques et savoirs pour les ressources marines et les territoires littoraux avec les acquis d’autres domaines et espaces, Montpellier, 3 et 4 avril 2006.
Lazzeri Y. (2006). Introduction générale. In: Lazzeri, Yvette (Dir.) Les indicateurs territoriaux de développement durable. Questionnements et expériences. Aix en Provence, L'Harmattan. pp. 21-26.
Lazzeri Y., Moustier E. (2006). Chapitre 4. Les expériences territoriales d'élaboration d'indicateurs de développement durable : un tour d'horizon. In: Lazzeri, Yvette (Dir.) Les indicateurs territoriaux de développement durable. Questionnements et expériences. Aix en Provence, L'Harmattan. pp. 77-103.
Maby J. (2003). Approche conceptuelle et pratique des indicateurs en géographie. In: Maby Jacques (dir.) Objets et indicateurs géographiques. . Avignon, A. Barthélémy. pp. 16-41.
Maurel P., Roussillon J. P. (2007). Usages de l'Information Géographique pour l'élaboration du SCOT de Thau : premiers retours d'expérience. GéoEvènement 2007, Paris, 3-5 avril 2007. 11 p. OCDE (1990). Environmental Policies for Cities in the 1990s. Paris, OCDE. 92 p.
OCDE (1993). Core set of indicators for environmental performance reviews. Paris, OCDE.
ONU, (2006). World Urbanization Prospects2006 ONU World urbanization prospects : the 2005 revision. New-York, ONU. 210 p.
Rey-Valette H., Chia E. (2007). Modes et conditions d'appropriation du concept de développement durable. Education à l'environnement pour un développement durable. Informer, former ou éduquer ?, Montpellier, 7-8 Juin 2007 Montpellier. 10 p.
Rey-Valette H., et al. (2008). Les usages des indicateurs de développement durable. Compte rendu de colloque (Montpellier, 3-4 avril 2006). Natures Sciences Sociétés, v. 16, n° 1. pp.73-75. Rey-Valette H., et al. (2006). Usages des Indicateurs de Développement Durable : entre Offre et
Demande d'indicateurs. GECOREV: Gestion concertée des ressources naturelles et de l'environnement, du local au mondial, St-Quentin-en-Yvelines, 26-27-28 juin 2006. 15 p. Roussel S., (2007). Efficacité d’une Gestion Intégrée de la Zone Côtière (GIZC). Montpellier 1, thèse
d’économie. 264 p.
Salles E. (2001). Définition d'indicateurs spatiaux pour le suivi de l'état de conservation des habitats naturels. Application à la Grandes Camargue. Strasbourg / Montpellier, Cemagref / Mémoire ENGEES. 123 p.
Sénécal G. (2007). L'esprit de la mesure et l'incertitude métropolitaine. In: Sénécal, Gilles (Dir.) Les indicateurs socioterritoriaux. Perspectives et renouvellement. Laval, PUL (Les Presses de l'Université de Laval). pp. 1-6.
Tanet P. (2003). Les indicateurs géographiques pour l'évaluation des mesures agri-environnementales. In: Maby Jacques (dir.) Objets et indicateurs géographiques. Collection Actes d'Avignon n°5. Avignon, UMR Espace Université d'Avignon CNRS, A. Barthélémy. pp. 269-281.
Verburg P. (2008). Perspectives on multi-scale modelling of European Land Use. Symposium “Spatial landscape modelling: from dynamic approaches to functional evaluations”, Toulouse, 3 au 5 juin 2008.
Sites Internet
ARPE : http://www.arpe-mip.com/html/index.php Cete-Méditerranée : http://www.cete-mediterranee.fr/ Certu : http://www.certu.fr/ CLUE : http://www.cluemodel.nl/Dictionnaire Encyclopédie Universalis : http://www.universalis.fr/test_lexique.php?mots=indicateur Eururalis : http://www.eururalis.eu/
Indicateur de l’environnement en Europe (EEA) : http://themes.eea.europa.eu/indicators/ INSEE Languedoc Roussillon : http://www.insee.fr/fr/regions/languedoc/
Ministère de l’Agriculture et de la Pêche : http://agriculture.gouv.fr/ Moland : http://moland.jrc.ec.europa.eu/
Programme INTERREG : http://www.interreg3.com/FR/homepage.asp Observatoire des territoires de la DIACT :
http://www.territoires.gouv.fr/indicateurs/portail_fr/index_fr.php Observatoire du littoral de l’IFEN : http://www.littoral.ifen.fr/ Observatoire du bassin de Thau (SMBT) :
http://smbt.teledetection.fr/index.php?option=com_content&task=view&id=49&Itemid=180 UMR LISAH : http://www.umr-lisah.fr/