HAL Id: hal-00141463
https://hal.archives-ouvertes.fr/hal-00141463v2
Submitted on 7 Jul 2007
HAL is a multi-disciplinary open access
archive for the deposit and dissemination of
sci-entific research documents, whether they are
pub-lished or not. The documents may come from
teaching and research institutions in France or
abroad, or from public or private research centers.
L’archive ouverte pluridisciplinaire HAL, est
destinée au dépôt et à la diffusion de documents
scientifiques de niveau recherche, publiés ou non,
émanant des établissements d’enseignement et de
recherche français ou étrangers, des laboratoires
publics ou privés.
Dynamical Equilibrium, trajectories study in an
economical system. The case of the labor market.
Patrick Letrémy, Marie Cottrell, Patrice Gaubert, Joseph Rynkiewicz
To cite this version:
Patrick Letrémy, Marie Cottrell, Patrice Gaubert, Joseph Rynkiewicz. Dynamical Equilibrium,
trajec-tories study in an economical system. The case of the labor market.. WSOM 2007, 6th International
Workshop on Self-Organizing Maps Conference Proceedings, Bielefeld, Sep 2007, Bielefeld, Germany.
pp.TUP-2. �hal-00141463v2�
hal-00141463, version 2 - 7 Jul 2007
Dynamical Equilibrium, trajectories study in an economical
system. The case of the labor market.
P. Letr´emy, M. Cottrell, P. Gaubert, and J. Rynkiewicz
SAMOS-MATISSE-CES, CNRS UMR 8174
Paris School of Economy
Universit Paris 1 Panthon-Sorbonne
90, rue de Tolbiac, 75013 Paris
email:
{patrick.letremy, marie.cottrell, patrice.gaubert, joseph.rynkiewicz}@univ-paris1.fr
Keywords: Segmented labor market, Kohonen maps, trajectories
Abstract— The paper deals with the study of labor
market dynamics, and aims to characterize its equilibriums and possible trajectories. The theoretical background is the theory of the segmented labor market. The main idea is that this theory is well adapted to interpret the observed trajec-tories, due to the heterogeneity of the work situations. The Kohonen algorithm is used to define the segments of the la-bor market. The trajectories are reconstructed by means of a non homogeneous Markov model and classified by using a Kohonen algorithm again.
1
Introduction - A classical approach
of the labor market
The analysis proposed here is developed in the framework of the modern analysis of the labor market. We will first re-mind briefly the main features of this approach by compar-ison with the classical theory. Our main reference for this presentation is the Handbook of Labor Economics ([6]).
1.1
Labor market, supply-demand
equilib-rium and major determinants.
The market is based on a relation between workers offering their work and firms expressing a demand, each actor max-imizing its function. The equilibrium wage and the cor-responding quantity of labor results from the comparison between supply and demand. The major characterization of this solution is productive efficiency. Some strong hy-potheses are behind this result, namely a perfect flexibility of wages and a global stability of the system, which can be represented by Walras’ ”commissaire-priseur”. The possi-bility of persistent unemployment is explained by a down-ward rigidity of the wages and the notion of reservation wage.
1.2
Global remarks and some critics about
the basic explanation.
The representation of the worker’s supply behavior, com-paring his reservation wage with the one offered on the market has from several theoretical points of view, the prin-cipal difficulty being to conciliate a voluntary unemploy-ment with the supplier rationality. Different approaches in terms of job search constitute the mainstream in this direc-tion. The initial idea is to define a rational supplier of labor whose information is incomplete: during his job search, with diverse costs induced, his knowledge of the jobs char-acteristics is imperfect. He has to choose between, on the one side, the current proposed job with the actual value of the expected earning, taking account of the expected stabil-ity of this job, and, on the other side, a longer search for a better job, which means a longer unemployment spell and higher search costs. This construction makes possible the introduction of voluntary unemployment and the notion of reservation wage, its level being defined endogenously in the model, from the wages distribution and the stability of the corresponding jobs.
A lot of developments have been made under this ap-proach, leading to a much more precise representation of behaviors, but also departing from the initial aim, to ex-plain the mechanism of an imperfect labor market. As a re-sult, this approach may end, with the same reasoning, in an equilibrium with unemployment or with over employment. Among the efforts produced to enhance this scheme, the idea of incomplete contracts as well as a macroeconomic approach of indexation may be found.
In the same way, deriving from an individual approach to the retrieval of a macroeconomic interpretation of dise-quilibrium, another main current of thought is that of in-centives, with a special mention to the approach in terms of efficiency wages. An important result has to be emphasized when compared with the original project, it is that the the-ory has moved from an idea of unemployment as voluntary to that of unemployment as involuntary. Several ideas can be outlined in this perspective:
rotation costs: there is a cost for the firm each time a worker, once he/she has received on-job training and acquired a specific human capital, moves to another firm in order to get a better return to his productivity. To avoid this, the firm compensates the worker with a wage higher than the market level, making it more difficult to find a new job better paid.
• another one, in a more sociological way, mobilizes
the notion of reciprocal gift; it allows for another in-terpretation of a behavior trying to stabilize the work force with the firm: a level of compensation higher than the market average is the reciprocate of a level of productivity higher than the minimum requirement. Rather than an explanation of the differences observed in compensations on a labor market, this approach is interesting in the sense that it conceives relation-ships between employers and workers as an adaptive process, resulting from the interaction between these agents.
This kind of interpretation at the firm level can be devel-oped at a more general level: in a world of competition, this leads to some firms paying wages above the market level, inducing in turn some rigidities in the work force flexibility and a resulting global unemployment. Numer-ous empirical studies have shown strong evidences of this mechanism (see in particular Kruger and Summers, 1988, [8]).
An interesting evolution, in the vein of the present study, is the one going towards the theory of organizations, that is a different conception of employer/employee relationship with no reference to a market and its rules, as it has been presented until now. Again we find an efficiency wage but it results from a differentiation process within the firm it-self, the firm being viewed as a set of heterogeneous groups in which the processes of encouragement does not have to be the same. With this conception, we come closer to the approach implemented here, with at the beginning the idea that the labor market is composite, gathering sub-sets using completely different rules of functioning. These standards models fail to answer to major questions like the efficiency of policies in that field. Added to the various weaknesses that have been rapidly presented above, this leads to look for a different approach of the labor market as an economic system.
2
The theory of a segmented labor
market: a dynamic approach
2.1
The design of the analysis in terms of
seg-mented labor market
The theory of segmentation, as introduced by Doeringer and Piore, 1971, [2], and developed later by Piore (see also Taubman and Wachter, 1986, [9]), defining the principles
of an analysis based on an heterogeneous labor market, is a non traditional approach.
2.1.1 Heterogeneity of the market
- the agents are conditioned by their own history which determines their choices on the market, currently with the present conditions existing on this market; ignoring the past of each individual to keep only the market conditions sup-presses an essential component of the available information (see the US debate on a growing and persistent labor mar-ket instability, in Farber, 1999, [4]);
- the agents interact and use the information of past ex-perience with a progressive learning; put in other words their behavior results from the past: an adaptive behavior is produced by the preceding disequilibria; the synthesis real-ized by Durlauf, 2003, [3] emphasizes the advantages of an approach in terms of complexity to take into account such behaviors, group effects and interactions;
- at the same time, this adaptive process concerns the structure in which the agents interact: this structure is pro-gressively transformed, and its rules are changing during the whole process.
This means that the traditional approach and its usual tools for formalization are not adapted to this complexity which constitutes the foundations of the labor market.
2.1.2 The definition of labor market segments
The main distinction is between 1) the primary segment where institutional rules and organizational practices guar-anty both stability and careers; its main characteristics are rigidities, the role of social norms, the weight of practices and believes. This segment cannot be analyzed with a sim-ple comparison between demand and supply and equilib-rium price; 2) the second segment which is working like a standard market, but which contains a lot of heterogeneity.
2.1.3 Trajectories
This notion is of first importance to understand the system dynamics. It may represent a set of moves within a given segment or between two segments (secondary to primary or exit from the market for an undefined period). Many im-portant questions are implied by these moves: what is the role of unemployment? Is it a temporary situation between two segments? Is it better to stay unemployed than to ac-cept an unskilled job on the secondary segment, waiting for a good one on the primary? Is gender an important charac-teristic in the context? In this perspective, the trajectories between situations on the labor market cannot be seen as randomly distributed. A suite of situations have to be tra-versed before a given employment may be reached. This order in the successive situations of employments is called by Piore a chain of mobility.
This idea of a trajectory or a path followed by workers looking for a maximization of their objective function is
really attractive, as is the idea of a non homogeneous econ-omy considering the mechanisms ruling the confrontation between suppliers of labor and employers. That is the jus-tification for the idenjus-tification of trajectories and for the study of the dynamics of the labor market.
2.2
Downside of this analysis.
The approach in terms of labor market segmentation presents several important weaknesses. Actually it is a sociological approach, meaning that the definition of con-cepts, which would be necessary to reveal the mechanisms of a segmented economy, are missing. In place of a statis-tical measure of the components of the market, or a set of relations between the analytical categories determining the dynamics of the system, there is a very precise description of the types of occupations and skills constituting the seg-ments. So the theoretical scheme has to be completed or constructed, using these pertinent observations. These cat-egories are weakly operative, so it is difficult to construct an empirical validation of its reality; of course the construc-tion of models formalizing the implied mechanisms is even worse. The ambition of the analysis presented after is to help making a progress in these directions.
3
The data and the method
There are few empirical studies in this frame, except to ver-ify the existence of segments. To tentatively answer the questions above, we deal with real data which come from the “EMPLOI” (Employment) INSEE (French National In-stitute for Statistic and Economy) sample survey. We split our work into several steps.
• Evidence of the reality of the segmentation
The goal is to identify market subsets with very different characteristics. As we only have the workers data and not the firms data, we have to identify these subsets by only using the personal and job characteristics, and not the company policies. We will consider that the job qualities differentiate the segments, in terms of career and precariousness (fixed-term or open-ended contracts). We would try to separate a primary segment (stable and open-term contracts) from secondary ones (fixed-term contracts, temporary or seasonal contracts) for example.
• Reconstruction of trajectories
We have to observe or to reconstruct the positions oc-cupied over a long period, to be able to highlight the trajectories and study the mobility. For example we would like to analyze the role of the secondary seg-ment with respect to the primary one (is it a simple transition before first job or before a return to employ-ment after interruption?). We also want to study the role of the unemployment situation, with respect to
other situations. After an unemployment period, is it possible to directly return to the primary segment, or is it usual to go through an alternation of precarious jobs and unemployment periods?
A preliminary study by Gaubert and Cottrell, 1999, [5], was lead on an American panel over the 1984 to 1992 pe-riod, for which we had a large number of information about the head of households position in the labor market.
The “EMPLOI” survey has different characteristics: it is not a panel since each individual is present only three con-secutive years in the database: this fact has to be overcome as explained in section 5. This survey is annual and be-gan in 1970. The questionnaire has changed several times, mainly after each census. After an important modification in 1990, the questions remained stable until 2002, and after that, were totally modified and the survey became quar-terly. For that reason, we only consider the 1990-2002 pe-riod, that is 13 years.
We only keep the active population, which includes oc-cupied active peoples, and the unemployed peoples. Due to their specificities, we remove the farmers. So we can use a more than one million observations database, represented by several hundreds variables.
There are two kinds of variables: some of them de-scribe the individual (sex, age, education level, number of children, housing region, professional activity, and so on); other (more numerous) describe the individual situa-tion with respect to the labor market. Most of them are cat-egorical variables (answers to the inquiry questions), when other ones are numerical (age, salary, seniority, etc.)
For this part of our work, we used a 3% sample, ran-domly drawn in the total population, that is around 30 000 observations, equally distributed in the 13 years period. As each individual is observed three consecutive years on av-erage, we pay attention to keep his three consecutive obser-vations and remove all those who were present only once or twice.
The first step is to select the relevant variables to elimi-nate the redundancy and to remove those which do not de-scribe the position of the worker with respect to the labor market. We also reduce the number of modalities which was excessive in many cases and analyze the non-answers to see if they correspond to interesting information or to missing data.
The result is that we keep 22 main qualitative variables for a total number of modalities equal to 99, and on an-other hand, we consider 28 an-other variables (qualitative or quantitative) as supplementary variables.
4
Classification on a Kohonen map,
labor market segmentation
Each observation corresponds to a couple (individual iden-tifier, year of the observation).
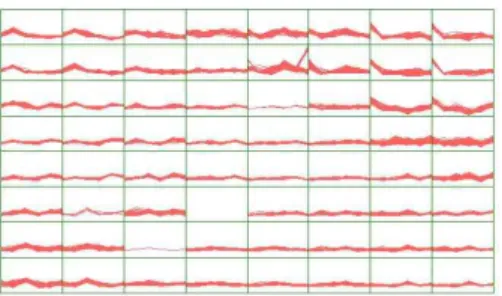
Figure 1: The 64 classes and their contents summarized in their 6 first components
Figure 2: The light color indicates the unemployed peoples, they are all in the upper right corner
As the main 22 variables are qualitative, we begin by transforming them into numerical quantitative values with-out loosing information. For that we use a Multiple Cor-respondence Analysis (MCA) so that each observation is described by its 63 new coordinates on the factorial axes. Due to its visualization and organization properties, we use a Kohonen map to classify the 30 000 observations (a 8 by 8 grid) (see [7], [1]). The number of iterations is 150 000, that is 5 iterations by observation on average, and there is no pretreatment on the values, since they are already cen-tered and reduced.
In Fig. 1, we represent the 64 classes and their con-tents. The observations (individual, year) are represented by means of their first 6 factorial components which have the largest variances. The observations are regularly dis-tributed over the 64 classes, only one class is empty, class 30. These 64 classes can be described by computing ele-mentary statistics of all variables (the 22 main ones, the 28 supplementary ones).
See in Fig. 2, the repartition of the FI variable (FI=1: employed, FI=2: unemployed), this variable does not con-tribute to the classification. Fig. 3 shows the repartition of the FIP variable, which indicates the position of the in-dividual during the previous year. The main modalities (green-FIP=1 for employed and yellow-FIP=2 for unem-ployed) are very stable from one year to the next year, but unemployed people in classes 45 and 53 were working dur-ing the previous year, the employed people in classes 33 and 34 were unemployed during the previous year, other
Figure 3: Green: employed, yellow: unemployed, blue: student or in training course, violet: military service, grey and red: retired, removed, light blue: housewife, light green: other
Figure 4: The 7 segments
modalities (3 to 8) lead to employment as well as to unem-ployment. Then, in order to define a small number of seg-ments which will be easy to identify, we use a Hierarchical Classification ( with Ward distance, [1], [10])to group these 64 classes into 7 super-classes (here called segments), see Fig. 4. Because of the self-organization property of the Kohonen algorithm, these segments group only neighbor and contiguous classes. So in this way, we get an accurate and significant segmentation of the labor market, where we hope to find the classical segments which were identified by Doeringer and Piore, 1991, [2].
It is easy to identify the 7 segments, from the compo-nents of the code-vectors and also by studying the distribu-tion of the variables which are not used for the construcdistribu-tion of the classes. Let us give a summary of the description. Segment 1 contains the workers who have ”normal” jobs, clerks, workmen, intermediate professions (16438 obser-vations). In segment 2 (3029 observations), one finds the open-ended part-time contracts, with a majority of women and clerks. The managers and intellectuals form segment 3 (3375 observations). Above it, segment 4 (3006 obser-vations) contains the independent workers on their account and the craftsmen. Segments 5 and 6 correspond to the sit-uations close to the unemployment: in segment 5 (1122 ob-servations), we find the temporary jobs, interim positions, and segment 6 (1309 observations) includes all the peoples who were unemployed during the previous year. Segment 7 (2660 observations) is exclusively devoted to unemployed peoples.
Figure 5: The unemployment rate in France along the 1990-2002 period
After defining the segmentation, it remains to reconstruct the trajectories among the 7 segments.
5
The trajectories and their
recon-struction
As each individual is questioned three consecutive years, at least three states and two transitions are observed for each of them. The idea is to model these transitions by a Markov chain, in order to be able to simulate trajectories along the total period and to compute the limit distribution (given by the probabilities to belong to each segment after a long time).
However, the evolution (see Fig. 5) of the unemploy-ment rate between 1990 and 2002 shows important varia-tions in the trend and in the value. Statistical tests (Maxi-mum Likelihood Tests) prove that it is not correct to con-sider an homogeneous Markov chain to model the changes of segments: there are several significant ruptures over the period.
To overcome this problem, we define a non homoge-neous Markov chain, where the transition probabilities de-pend on the current year. We denote the probability to go in segment j starting from segment i between year n and year n+ 1 by pn
ij. Then for fixed i and n, the vector
(pn
i1, p
n i2, . . . , p
n
i7) defines a probability distribution
condi-tionally to the fact of belonging to segment i during year
n.
All parameters pnijare estimated from the observed val-ues.
These estimated conditional distributions can therefore be used to simulate complete trajectories over the whole period of 13 years.
From the simulated trajectories, we can estimate a ”mean” Markov chain, (see the transition matrix in Table 1) and the ”limit” distribution (Table 2). These estimates are valid as long as the changes are not too strong, and we can see that the limit values are very close to the true per-centages which are observed in the database. We can see
C1 C2 C3 C4 C5 C6 C7 C1 92.2 2.2 1.8 0.5 1.0 0.1 2.2 C2 10.9 79.4 3.8 0.4 1.6 0.2 3.6 C3 9.8 3.9 82.7 1.5 0.4 0.0 1.6 C4 1.9 1.0 0.4 95.3 0.2 0.0 1.2 C5 22.0 4.1 4.6 0.5 52.7 2.4 13.7 C6 28.0 17.6 4.1 2.7 20.4 7.6 19.7 C7 0.0 0.0 0.0 0.4 0.0 36.8 62,8
Table 1: Mean transition matrix, the values are percentages, entry(i, j) is the probability to go into segment Cj from
segment Ci.
Segment limit observed frequency Segment 1 3.63% 3.63% Segment 2 52.01% 53.13% Segment 3 9.90% 10.91% Segment 4 11.50% 9.79% Segment 5 12.50% 9.72% Segment 6 3.30% 4.23% Segment 7 7.80% 8.60%
Table 2: Limit distribution and real values
that the exit from segment 7 (unemployed peoples) is only (with probability 36%) towards segment 6, what is natural, since it is the segment of peoples who were without job during the previous year. But after having spent a year in segment 6, there are significant probabilities to reach other segments 1, 2, 5. We can also draw an individual trajectory, like in Fig. 6.
6
Classification of trajectories
Finally, we simulate a large number of trajectories using the empirical distribution of the individuals in 1990 as initial state, and the transition probabilities pn
ij to draw the next
state from one year to the next one.
Then it is possible to build a classification of these
tra-Figure 6: The trajectories of one individual who belongs to segment 1 in 1990 and alternates between to be a manager and an independent worker
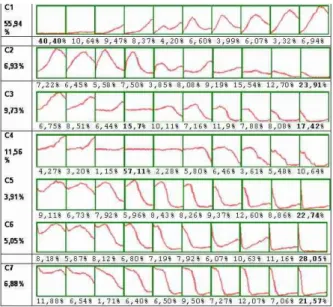
Figure 7: The classes of the trajectories according to the initial State of the worker
jectories. For this purpose, we use seven one-dimensional Kohonen maps (strings) with 10 units, to classify all the trajectories which start from the same initial state. The segment numbers are reordered to define a kind of scale from the “best” situation (segment 1) to the “worst” one (segment 7) and we consider these numbers as real ordered numbers. These classifications highlight typical behaviors, which remain to be analyzed from an economical point of view. We use a one-dimensional Kohonen to get an ordered sequence of possible trajectories.
In Figure 7, the code vectors of the 7 Kohonen maps are displayed. The left column indicates the percentages of the individuals according to their situation in 1990. In lower part of each 10-units map, the frequencies of each class are written. We observe that most of workers in “normal situ-ation” in 1990 remain in this “normal” situation, that seg-ments 3 and 4 are stable, that even if most of unemployed peoples remain close to segment 7 or 6, a not negligible proportion goes to segment 1 (finds a job), and so on.
The study of these trajectories allows us to analyze in a very detailed way typical behaviors which were not clear by considering only the segmentation.
7
Conclusion and perspectives
From the SOM point of view, the more interesting result is that we extend its traditional domain of application to eco-nomical theory and to dynamical behavior models. Future works include a more precise analysis of the meaning of each typical trajectory. This analysis has to be done in re-lation with the personal profiles of the individuals. Up to now, we have not used all the variables which are present in the survey. In particular the variables which do not directly
describe the situation with respect to the labor market were not considered for the segmentation, but could explain the heterogeneity of the trajectories from a worker to another one.
References
[1] M. Cottrell, P. Gaubert, P. Letrmy, and P. Rousset (1999), Analyzing and representing multidimensional quantitative and qualitative data : Demographic study of the Rhne valley. The domestic consumption of the Canadian families, in Kohonen Maps, E.Oja and S.Kaski (Eds.), Elsevier, Chap. 1, 1-14.
[2] P.B. Doeringer and M.J. Piore (1971), Internal Labor
Market and Manpower Analysis, Heath and Co., 1971,
see also Handbook, op.cit., vol. 2, ch. 21.
[3] S. N. Durlauf (2003), Complexity and empirical
eco-nomics, WP University of Wisconsin, Fv., 22 p.
[4] H. S. Farber (1999), Mobility and stability, in Hand-book of Labor Economics, vol. IIIB, O. Ashenfelter and D. Card eds., 2439-2483.
[5] P. Gaubert and M. Cottrell (1999), A dynamic analysis of segmented labor market, Fuzzy Economic Review, Vol. IV, No 2, 63-82.
[6] Handbook of Labor Economics (1999, 2000), vol. 1, 2, 3A, 3B, 3C, North-Holland.
[7] T. Kohonen (1995), Self-Organizing Maps, Springer Series, Information Sciences, Vol.30, Springer, Heidel-berg.
[8] C. J. Kruger and M. K.Summers (1988), Efficiency
Wages and Inter-industry Wage Structure,
Economet-rica, 56, 1988, 259-293.
[9] P. Taubman and M.L. Wachter (1986), Segmented
La-bor Markets, in Handbook of LaLa-bor Economics, vol.
II, O. Ashenfelter and R. Layard eds., 1183-1217. [10] J. Vesanto and E. Alhoniemi (2000), Clustering of the
self-organizing map, IEEE Trans. on Neural Networks, vol. 11, n3, 586-600.