APPLYING A MEIO APPROACH TO MANAGE INTEL'S VMI HUB SUPPLY CHAIN
By Min Fang Hsieh
Bachelor of Science in Astrophysics, National Central University (2001) Master of Science in Electrical Engineering, National Chiao Tung University (2003)
Submitted to the MIT Sloan School of Management and the Department of Engineering
Systems in Partial Fulfillment of the Requirements for the Degrees of MASSACHUSETTS INSTI
OF TECHNOLOGY Master of Business Administration
AND
JUN 15 2011
Master of Science in Engineering System Division
LIBRARIES
In conjunction with the Leaders for Global Operations Program at the Massachusetts Institute of Technology
June 2011
02011 Min Fang Hsieh. All rights reserved.
The author hereby grants MIT permission to reproduce and to distribute publicly copies of this thesis document in whole or in part in any medium now known or hereafter
created.
Signature of Author
May 4, 2011 MIT Sloan School of Management and Engineering Systems Division
Certified by
Stephen Graves, Thesis Advisor Abraham J. Siegel Professor of Management, MIT Sloan School of Management
Certified by ___
David Simchi-Levi, Thesis Advisor Professoid ineering Systems and 1il & Environmental Engineering Accepted by ___________
N~ancy Leveson Professor of Engineering Systems and Aeronautics & Astronautics Chairman of Enaineerine Systems Division Education Committee
Accepted by
Debbie tserechman Executive Director of MBA Program, MIT Sloan School of Management
APPLYING A MEIO APPROACH TO MANAGE INTEL'S VMI HUB SUPPLY CHAIN
By Min Fang Hsieh
Submitted to the MIT Sloan School of Management and. the Department of Engineering Systems on May 4, 2011 in Partial Fulfillment of the Requirements for the Degrees of
Master of Business Administration AND
Master of Science in Engineering System Division
ABSTRACT
To improve customer service levels, Intel implemented Vendor Managed Inventory (VMI) hub process for its Central Processing Unit (CPU) Finished Good (FG) inventory, which allows Intel's customers to pull inventory directly from the hubs. However, this process change resulted in increased inventory in Intel's overall supply chain and thus
increased inventory costs. This work investigates reducing inventory cost by applying a Multi Echelon Inventory Optimization (MEIO) approach to manage Intel's VMI Hub
Supply Chain. The goal is to evaluate the hypothesis that an MEIO approach for inventory management and replenishment will result in a more efficient use of FG inventory. To assess the hypothesis, we developed a three-step modeling framework. In each step, we conducted several experiments, applying the MEIO model approach, to determine the optimal CPU FG inventory stocking levels needed to meet customer service level goals for different products and locations. The study was concluded with quantitative and qualitative business impact of implementing an MEIO approach for Intel CPU FG Supply Chain. The MEIO modeling result shows significant inventory
reduction opportunities and were presented to the Senior Management team of Intel Supply Chain.
Thesis Advisor: Stephen Graves
Title: Abraham J. Siegel Professor of Management, MIT Sloan School of Management
Thesis Advisor: David Simchi-Levi
ACKNOWLEDGMENTS
First, I wish to express my sincere appreciation to the Intel Corporation for providing me with the resources and support for this work. The success of this internship was possible thanks to the endless support, guidance, and enthusiasm of my wonderful project advisor, Maria Mentzer, who allowed me to learn, grow, and enjoy myself through this amazing experience. Brian Wieland, an amazing teacher, also had a direct impact on this project by offering his valuable time, insights, and knowledge. Thanks also to Sean
Cunningham, Tom Sanger, Pat Mastrantonio, Asima Mishra, Carlos Mazariegos, and Chuck Arnold, along with everyone at Intel with whom I worked during my internship.
I also must acknowledge the Leaders for Global Operations (LGO) Program for its rich collection of resource and tools that were made available to me. I would also like to extend a special thanks to my faculty advisors, Dr. Stephen Graves and Dr. David
Simchi-Levi, for offering invaluable guidance, advice, and feedback throughout the entire thesis process.
Next, this thesis would not have been possible without the love and support from my friends and family. I was very lucky and proud to be part of the LGO Class of 2011. Thank you for your support and friendship for making these last two years truly an unforgettable journey for me.
Finally, I would like to dedicate this thesis to my parents, sisters, Joe and Elaine. For their love and support mean the world to me.
TABLE OF CONTENTS Abstract Acknowledgements Table of Contents List of Figures List of Tables 1 Introduction... 15 1.1 Statement of Problem... 17 1.2 Thesis Organization...18 2 Company Overview...19 2.1 Intel Corporation... 20
2.2 Intel CPU FG Supply Chain... 21
2.3 Inventory Optimization Efforts at Intel...25
2.4 Inventory Policy for Safety Stock Target Generation...27
2.4.1 Flat Inventory Policy...27
2.4.2 SEIO implementation at Intel VMI Supply Chain...29
2.4.3 MEIO implementation in Intel Box Channel supply chain..31
3 Literature Review...34
3.1 ITS Approach...34
3.2 Boxed CPU Demand Characterization...37
4 Three Lens Analysis...43
4.1 Strategic Design Perspective... 43
4.2 Political Perspective...48
4.3 Cultural Perspective...53
5 Approach and Methodology...57
5.1 Document Current State...57
5.2 Model Development...62
5.3 Study of Inventory Reduction Opportunities...65
6 Model Implementation and Results...68
7 N etw ork R edesign... 79
8 Summary of Recommendation and Conclusions ... 89
8.1 8.2 8.3 8.4 8.5 Bibliography Summary of Results...89 Summary of Recommendations...89 Model growth...93
MEIO's Future at Intel...94
LIST OF FIGURES
Figure 1: Intel implemented VMI hub to improve its customer service level...16
Figure 2: OEM reduced its onsite inventory through VMI implementation...16
Figure 3: Total Intel FG inventory increased after VMI implementation...17
Figure 4: VMI Hub Inventory...17
Figure 5: Manufacturing process and lead times for microprocessor products...21
Figure 6: Two different packaging form factors for CPU FG products...21
Figure 7: Intel CPU distribution channels...22
Figure 8: CPU FG Supply Chain...23
Figure 9: VMI hubs network diagram...24
Figure 10: Boxed CPU supply network diagram...25
Figure 11: Efficient Frontier progression at Intel...26
Figure 12: VMI Hub Guidance sample sheet...28
Figure 13: SEIO moves the efficient frontier...29
Figure 14: Days of Inventory (DOI) for the ITS VMI pilot...30
Figure 15: SKUs managed by the MEIO tool have significantly higher service levels than planner-m anaged SK U s...32
Figure 16: Modified Sigma and Kernel Smoothing Impact on CSPO Inventory E fficiency ... 33
Figure 17: ITS "Order Up-To" Target Generation...35
Figure 18: Example of ITS calculation...36
Figure 19: Intel Channel Forecast Error Summary...39
Figure 20: Forecast Bias has significant impact on SDFE value...39
Figure 21: Processes in Strategic Design...44
Figure 22: Functional Grouping Structure...44
Figure 23: Simplified Org Chart for Supply Planning Operations...45
Figure 24: Functional/Product Matrix structure...47
Figure 25: Stakeholder Mapping Analysis...51
Figure 26: Capability Analysis...52
Figure 27: Project Commitment Chart...52
Figure 28: Hub Guidance monthly Safety Stock targets setting process...58
Figure 29: ITS Safety Stock targets setting process...58
Figure 30: MEIO Safety Stock targets setting process...59
Figure 31: MEIO Data Flow...60
Figure 32: MEIO SS Target Setting Processes...61
Figure 33: A three-step modeling framework was developed to evaluate the MEIO approach ... . ... 62
Figure 34: Step One- Single Echelon Inventory Optimization...63
Figure 35: Step Two- Multi Echelon Inventory Optimization, including VMI Hub and Box Channel Supply Chains...64
Figure 36: Step Three- Multi Echelon Inventory Optimization, including VMI Hub, Box
Channel, and Tray Disti Customer Supply chains...65
Figure 37: Baseline model and what-if model for the Inventory Reduction...67
Figure 38: SS targets using different SEIO and demand characterization methodology..69
Figure 39: SEIO modeling results by products...70
Figure 40: the SS target output distribution by ITS models...70
Figure 41: the SS target output distribution by the off-the-shelf MEIO software ... 71
Figure 42: Forecast Error distribution for product 5 in location 3...73
Figure 43: forecast error distributions across six VMI Hubs...74
Figure 44: Inventory Reduction for different Inventory Optimization Options...76
Figure 45: Inventory Reduction for risk-pooling at VMI hubs...77
Figure 46: OCCND Network Re-design using MEIO approach...79
Figure 47: MEIO model based on different Supply Chain design...80
Figure 48: MEIO model based on global network design...81
Figure 49: To- Be Scenario 1 for the OCCND project...82
Figure 50: To- Be Scenario 2 for the OCCND project...83
Figure 51: To- Be Scenario 3 for the OCCND project...84
Figure 52: To- Be Scenario 4 for the OCCND project...85
Figure 53: To- Be Scenario 5 for the OCCND project...86
Figure 55: Total Stock cost for different network design scenarios...88
Figure 56: project implementation pyramid...90
Figure 57: the Four Pillars of Intel Supply Chain Strategy...91
Figure 58: Intel Supply Chain Map...94
LIST
OF TABLESTable 1: The SS targets generated through ITS and MEIO off-the-shelf software...71
Table 2: Step 2 modeling Safety Stock inventory reduction result...74
Table 3: Step 3 m odeling result...74
1
Introduction
"Vendor Managed Inventory (VMI). In the VMI process, the vendor assumes
responsibility for managing the replenishment of stock. Rather than a customer
submitting orders, the vendor will replenish stock as needed This is sometimes referred to as supplier-managed inventory (SM) or co-managed inventory [1]."
Poor visibility across the supply chain partners, inadequate ability to respond to demand fluctuations, inflexible manufacturing processes, short product life cycle, and long lead time have perpetuated significant supply chain challenges for the companies in the semiconductor manufacturing industry. With increasing competition, the firm that is able to provide quick and effective service to its customers would enjoy a competitive advantage. As the competitive landscape continues to shift, it has resulted in increasing pressure on all semiconductor manufacturers to consider strategies such as Vendor Managed Inventory (VMI) that locates inventory at the supplier hubs near customer manufacturing sites.
Like its competitors, Intel decided to reevaluate its customer fulfillment strategies and considered ways to make inventory reliably available to its customers with low cost solutions, including the combined use of vendor-managed and customer-managed inventory locations. To maintain its competitive position, Intel deployed VMI hubs for the Central Processor Unit (CPU) Finished Good (FG) inventory in 2008 for some high volume, high revenue customers. Several regional hubs were strategically located near clusters of customer sites with a goal to provide better customer service level, improve
forecast error, capitalize on pooling opportunity, and reduce customer owned inventory. As shown in Figure 1, Intel shipped its CPU FG products to the Original Equipment Manufacturer (OEM) customers from the component Central Warehouses (CW) prior to 2008; post-VMI stage, the OEM customers pulled inventory directly from the VMI hubs.
=*E c:> customer
m Customer
cVM -,Customer
Hub
Figure 1: Intel implemented the VMI hubs to improve its customer service level
Over the past several years, the OEMs have asked their suppliers to implement various programs to minimize their (OEMs) risk to excessive inventory. In 2002, inventory across Intel was $2.3B or 8.5% of sales, including $0.7B of FG inventory. If the risk reduction approaches of these OEMs and distributors were to be adopted, we could expect the FG inventory to increase by >20%, resulting in higher levels of inventory risk to Intel [2]. Figure 2 illustrates that OEM customers were able to reduce its onsite inventory, while the total Intel pipeline inventory has increased due to VMI.
0
Pre-V1I Post-VMI
motH oR-site Zoventory WOtI
Utatal Total PG plpenne wOI
Figure 2: OEM reduced its onsite inventory through VMI implementation
1.1 Statement of Problem
The VMI hubs are efforts to improve customer service levels by allowing Intel's customers to directly pull inventory from the hubs. However, supporting the VMI hubs means increased inventory in the overall system for Intel, which increases inventory costs. While OEM customers have enjoyed inventory reduction results, Figure 3 shows that the total FG inventory has increased for Intel after the VMI hub implementation.
c
C
Pv-WVM Post-VMI
* CW In transit sVNI Hub |
Figure3: Total Intel FG inventory increased after VMI hub implementation
Figure 4 shows that the current VMI hub inventories are high compared to the Hub Targets. The current inventory targets are static (cycle stock+ safety stock).
2
Avg Hub WO based on CurreW promess
1 2 3 4 5 6 7 8 9 10 11 12 13 14 15 16 17 18 19 20 21 22 (week)
--- Av gb WV IFCST Baed) .a ub, Targe WOE
This research will investigate improving both customer service levels and
inventory cost by applying a Multi Echelon Inventory Optimization (MEIO) approach to manage Intel's VMI Hub Supply Chain.
1.2 Thesis Organization
This thesis is organized into eight chapters. An introduction and problem statement are presented in chapter one, after which chapter two gives brief company overviews of Intel, the CPU FG Supply Chain, and the inventory optimization effort at Intel. Chapter three reviews literature that described some inventory optimization challenges in the Intel FG Supply Chain and the adjustment procedures that were developed to produce appropriate inventory targets in the presence of forecast error and bias. Chapter four offers unbiased observations, analysis, and characterization of the current Intel Inventory Optimization practices based on a "Three Lens Analysis"
framework. Chapter five details the approaches and methodologies that were employed to modeling the Intel CPU FG Supply Chain. Chapter six describes the model
implementation and the simulation results. Chapter seven expounds the collaboration work with the Intel Network Design Center of Excellence team to model the inventory level and supply chain cost for five different network design scenarios. Finally, chapter eight provides a summary of the findings and recommendations made and finalizes with a conclusion.
2
Company Overview
2.1 Intel Corporation
Intel Corporation (Public, NASDAQ:INTC), founded in 1968, is the world's largest semiconductor chip maker, based on revenue ($43.6 billion). Intel designs and manufactures computing and communications components, such as microprocessors,
chipsets, motherboards, and wireless and wired connectivity products, as well as
platforms that incorporate these components. Intel employs more than 80,000 employees around the world, producing more than 10 million chips every week.
Over the years, Intel continues to offer innovative products and platforms that accelerate the computing and communication market expansion. With its Atom processor, Intel is expanding from its core business of personal computers and servers
into adjacent markets of netbooks, embedded devices and consumer electronics. These new markets have extremely variable demand and require higher service levels at lower
costs than the core business. Intel realized that it will need to reduce its current supply chain cost structure significantly to remain its competitive advantage. In the recent years, Intel's effort to create supply chain efficiencies have resulted in business improvements
such as a 32% reduction in inventory, a 65% reduction in order-fulfillment lead time, and a threefold increase in responsiveness to customers [3].
[3] Delivering Competitive Advantage Through IT, Intel IT performance Report 2010-2011, http://www.intel.com/Assets/PDF/general/IntelIT_2011 APREnglishstandard.pdf
2.2 Intel CPU FG Supply Chain
The Central Processing Unit (CPU) is the portion of a computer system that carries out the instructions of a computer program, and is the primary element carrying out the computer's functions. The introduction of the microprocessor in the 1970s significantly affected the design and implementation of CPUs. Since the introduction of the first commercially available microprocessor (the Intel 4004) in 1970 and the first widely used microprocessor (the Intel 8080) in 1974, for many years Intel has been the dominant CPU manufacturer in many market segments. Intel has primarily accomplished its market leader position through its strengths in microprocessor design, manufacturing, and marketing. "Intel makes approximately 10 billion transistors per second. Our factories produce the most advanced computer technology in the world and these investments will create capacity for innovation we haven't yet imagined," said Brian Krzanich, Senior Vice President and General Manager of Intel's Manufacturing and Supply Chain group [4].
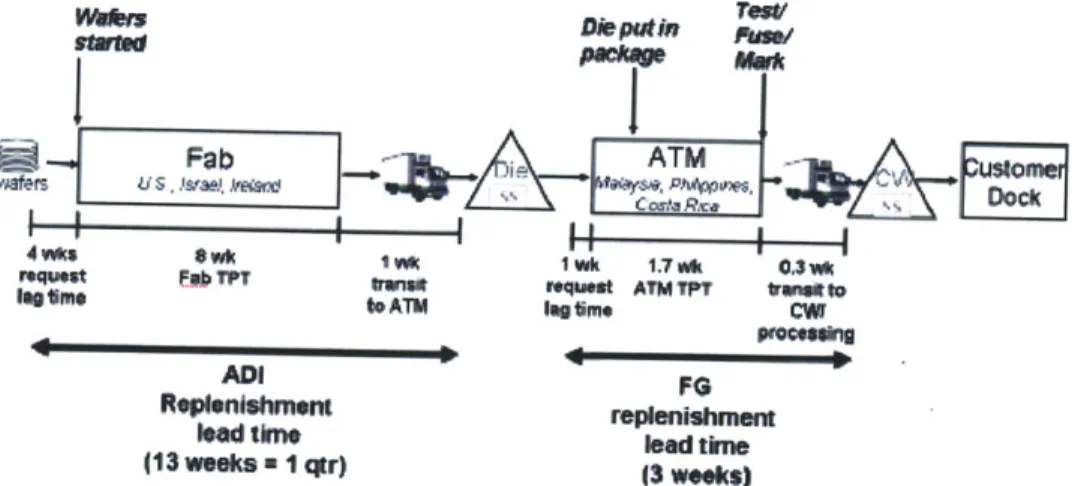
There are two major stages in the manufacturing process of microprocessors at Intel: Semiconductor Fabrication (Fab) and Assembly/Test (ATM). Figure 5 illustrates a simplified microprocessor manufacturing process at Intel [5]. The Fab stage is the process of converting raw silicon wafers to finished die. The ATM stage is the process of assembling and packaging the die into its final microprocessor finished good (FG)
product in either tray or box form factors, as shown in Figure 6.
[4] http://newsroom.intel.com/community/en-za/blog/2010/10/19/intel-announces-multi-billion-dollar-investment-in-next-generation-manufacturing-in-us
[5] J. Chow (2004), Analysis of New Approaches to Improve the Customer Responsiveness of Intel's Microprocessor Supply Chain, Massachusetts Institute of Technology
Fab
4 V00 8 Wk s
request Eob TPT iranst
lagmetoAT
1 Wk 1.7 Wk 0,3 W
request ATM TPT tranetto
log me CWr
proeang
ADI FG
Repenlshmsnt replenishment lead time lead time
(13 weeks 1 qtr) 13 weeks)
Figure 5: Manufacturing process and lead times for microprocessor products (2004)
Box Form
Tray Form
Figure 6: Two different packaging form factors for CPU FG products
Intel's main customers in the CPU space are the OEMs (Original Equipment Manufacturers), and the channel customers that include distributors, resellers, and retailers all around the world. Figure 7 is a diagram of Intel's Value Chain [6]. The OEMs represent the larger portion of the company's sales (over 70%), including the major computer manufacturer such as Dell, Hewlett Packard, IBM, and Lenovo. The distribution (Disti) channel customer including most major distributors in North America with hundreds of other scattered throughout Asia and Europe. Intel's boxed processor shipment volume constitutes approximately 20% of Intel's total CPU shipments.
[6] L.W.Rassey (2003), Enterprise Strategy: Leveraging the Dynamics and Behaviors in a Supply
Chainfor Operational Excellence, Massachusetts Institute of Technology
Figure 7: Intel CPU distribution channels [6]
Safety stock inventory is held at two main areas:
(1) Die safety stock (ADI - Assembly Die Inventory) is held at each ATM site and new die units are shipped from Fab sites worldwide
(2) Finished goods (FG) safety stock is held at components central warehouses (CW) close to the ATM sites and new FG units are provided by the ATM sites
Figure 8 illustrates a simplified CPU FG Supply Chain network. Currently, Intel component central warehouse (CW/ CWl) provides CPU FG to the box channel
customers (distributors), tray VMI customers (OEMs), and tray channel customers (distributors).
CW2 CWC
VM4 Hub 90m
CWl
Figure 8: CPU FG Supply Chain
VMI Hub Supply Chain
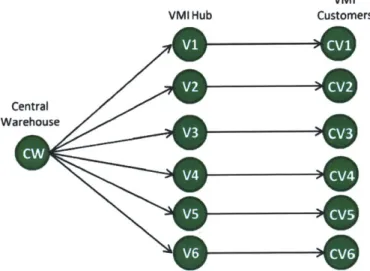
As described previously, Intel deployed the VMI hubs for the CPU Finished Good (FG) inventory in 2008 to improve customer service levels; the Intel VMI hubs network diagram is shown in Figure 9. CW represents finished microprocessor inventory at various assembly/test factory warehouses around the world, which are also known as components central warehouses. To simplify the finished good CPU supply chain, we use one virtual component stage to represent the entire non-boxed, finished CPU inventory within Intel's factory network. VI is the VMI hub at location 1, and CV1 represent a cluster of OEM customers supplied from VI hub.
The customer service improvement could be achieved by forward positioning inventory so that customers could receive materials in less than 24 hours from the order placement. The data showed that the average service level was about 80% prior to the VMI implementation, and 95% post the VMI implementation. Initially, the VMI hubs might increase the overall supply chain inventory, but the inventory could be reduced through better demand signals and customer collaborations. In fact, the collaboration
process is a key enabler to a successful VMI implementation. The process requires Intel and customers working together to create mutual benefit.
VMI
VMI Hub Customers
Central
Warehouse
Figure 9: VMI hubs network diagram
Boxed Channel Supply Chain
The Channel Supply Planning Operations (CSPO) organization is responsible for satisfying the branded boxed CPU demands. Figure 10 shows the supply network
diagram for the boxed CPU products [7]. In Figure 10, CW1 means central warehouse (CW), which represents finished microprocessor inventory at various assembly/test factory warehouses around the world. At CW1, the microprocessors have completed all fabrication steps, and the microprocessors are in trays organized by different package types and processor speeds. Next, processors will be shipped from CW1 to four different CW2 boxing sites, where the thermal solutions (fan, heat sink, etc) are included into the retail boxes along with CPUs. The boxing site, typically owned by subcontractor companies, will ship the boxed products to the nearby Intel finished good warehouses (CW3) after the completion of the boxing activities. Finally Boxed CPUs are supplied to Box Channel (Disti channel) customers throughout the world from the CW3.
CWV3 Boxe acu KF Awagrrouses) Distributor N4etw~ork FHS Ternal Soubon) box ng I-act=r 4
Figure 10: Boxed CPU supply network diagram
2.3 Inventory Optimization Efforts at Intel
"Intel has launched an extremely ambitious effort to remake itself as a
customer-centric supply chain " - AMR Research Supply Chain Top 25
As the semiconductor industry continues to evolve at a rapid pace, supply chain management has become dynamic, complicated and highly sophisticated for Intel. Computer chips are small, and have an extremely high value to weight ratio. Therefore, there were only marginal opportunities to improve distribution costs, and even less in transportation. At the same time, inventory carrying costs represented the preponderance of total supply chain costs.
Inventory management in a company with the size, scale and complexity like Intel is particularly difficult. High demand variability, complex manufacturing process, and long cycle time suggest high inventory requirement and carrying cost.
[7] B. Wieland, P. Mastrantonio, S. P. Willems, and K. G. Kempf, "Optimizing Inventory Levels within Intel's Channel Supply Demand Operations," future issue, Interfaces.
http://www.informs.org/Pubs/Interfaces/Future-Issues CW2
As a result, Intel has launched several initiatives in an attempt to minimize
inventory cost while maintaining high customer service level. As shown in Figure 11, the corporate goal was to continue shifting the efficient frontier to the left. Several projects were proposed to attain this goal, including lowering factory cycle time, lowering inventory investment, delaying product differentiation, and moving from 100% push-based to pull-push-based builds. Also, strategically building inventory ahead of anticipated demand increases, to even out capacity utilization and avoid stock-out situations. From Intel's perspective, customer responsiveness, inventory optimization and asset utilization are the three components of a top-notch supply chain. Nevertheless, the success of the
supply chain management requires leveraging the right people, organization and tools within the company.
Many inventory optimization initiatives were thus instigated to solve the question of how much and where Intel should carry inventory to attain the goal of minimizing inventory cost while maintaining desired customer service level. The objective of these efforts were to allow inventory target differentiation for each product, each stage and each site of the supply chain to optimize the total inventory cost. Meanwhile, inventory analytics prioritize inventory toward market segments with higher service level goals and products with higher supply variability and/or demand uncertainty.
Tomorrow's Efficient Frontier Today's Efficient Frontier _ / 2009 2008 2! V) 2007
Inventory
2.4 Inventory Policy for Safety Stock Target Generation
Over the past several years, Intel has leveraged its sizable supply chain organization and its extensive operations research to reduce inventory investment significantly. Three different inventory optimization policies have been employed to provide the Safety Stock (SS) targets for the CPU Finished Good (FG) Supply Chain. First, Flat Inventory Policy was used to determine the static VMI SS targets based on next four weeks' forecast data. Second, a spreadsheet-based Single Echelon Inventory Optimization (SEIO) model was developed to locally optimize and calculate inventory targets for each stage and site in the VMI Supply Chain. This SEIO model has proven to improve inventory efficiency and has established Intel's analytical inventory practices through the dynamic SS target generation processes. Finally, in 2005-2006 Intel implemented a Multi Echelon Inventory Optimization (MEIO) model to minimize
inventory cost in the Box Channel Supply Chain. A dynamic programming algorithm has been used to find the lowest inventory cost solution by considering the cost tradeoffs across the whole supply network. The MEIO implementation in the Box Channel Supply Chain has achieved stable service level, higher inventory efficiency, and overall
inventory reduction by 11% [7].
2.4.1 Flat Inventory Policy
The first era of the inventory policy at Intel was "Flat Inventory Policy" or so-called "Rule of Thumb Inventory target". Prior to 2005, most inventory strategies at Intel were developed by analysts in Microprocessor Marketing and Business Planning
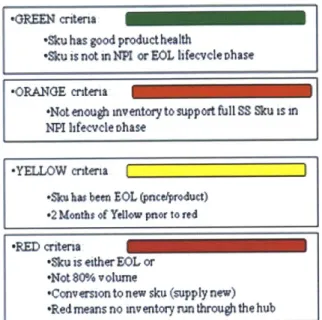
(MMBP) group at the product family level. These flat inventory targets were later carried out and implemented by planners equally for the finished goods product. For example, the VMI Hub Guidance, as shown in Figure 12, took product health and product lifecycle into account and divided different Stock Keeping Units (SKUs) into four color codes, each has a standard Days of Inventory (DOI) target. The color code orange has lower SS than green color code products, yellow ramping down between green and orange.
The Safety Stock (SS) target is calculated based on the Hub Guidance flat DOI target, multiplied by next four week's average forecast data. The problem with such flat inventory policy is that it has not considered service level, demand uncertainty or the demand pooling opportunities. The methods for determining the inventory targets were not analytical or statistical. Also, the SS targets were based on forecast data, which contained persistent bias and resulted in high inventory at the VMI hubs.
'OREEN criteria
.Sku has good producthealth
*Sku is not in NPM or EOL Ifeecele oh ase
*ORANGE critena
*Not enougb anventry to support fullSS Sku s in
NPI Ifeevcle thase -YELLOW critena
-Sku has been EOL (pncefproduct)
-2 Months of Yelow pnor to red
-RED critena
*Sku is eitherEOL or
-Not 80% volume
-Conversion to new sku (supply new)
-Red means no mv entory run through the hub
Figure 12: VMI Hub Guidance sample sheet
[7] B. Wieland, P. Mastrantonio, S. P. Willems, and K. G. Kempf, "Optimizing Inventory Levels
within Intel's Channel Supply Demand Operations," future issue, Interfaces.
2.4.2 SEIO implementation at Intel's VMI Supply Chain
Inventory Target Solution (ITS) is a Single Echelon Inventory Optimization (SEIO) model developed by Intel. ITS employs an analytical single stage, base stock methodology, it was successfully deployed in substrates with a 25% inventory reduction and is currently in a live pilot for the Vendor Managed Inventory (VMI) hubs. ITS incorporates customer service level, replenishment lead time, forecast bias, and forecast error variability into its algorithm to provide differentiated SS targets recommendation by product, by hub over time. A simulation study was performed to determine whether such differentiation of inventory targets by product and market was indeed beneficial. The simulation results [8] of this back-testing model showed that differentiated targets could improve the efficient frontier as shown in Figure 13.
Efficient
Fronder
of ITS compared to Fiat Policy
ITS -- Flat
Ig
A
~0
0
Fill Rat Achieved
Figure 13: SEIO moves the efficient frontier
[8] C. Arnold, A Frameworkfor Success: Moving OR Projects From Concept to Implementation, Supply Chain Modeling & Solutions, Intel Corporation
The curve represents the amount of safety stock required to meet any given customer service level. By shifting the efficient frontier means that we can either reduce inventory while achieving the same service levels, or increase service levels with the same inventory.
In 2008, Intel implemented the VMI hubs to improve the service level to its OEM customers. However, inventories in the VMI hubs were one week greater than the goal by Q4'2009. A study conducted by Supply Planning Operations (SPO) in Q1'2010 revealed that the high inventories were attributed to high bias in the customer forecasts leading to the wrong mix of products in the hubs. A cross functional Hub Taskforce team was formed to address these issues. Meanwhile, the Supply Modeling and Solutions (SMS) group conducted a paper pilot and suggested the ITS inventory strategies could help reduce inventory in the VMI hubs while maintaining desired Service Levels. In Q2'2010, the Hub Taskforce partnered with the SMS group and conducted a live ITS pilot on 10 representative SKUs. Figure 14 shows the ITS VMI live pilot result compared to a control group of similar products in the same VMI locations.
EndAg on Hand inventary tleatve to MAD ThUcal Demand Expressed
as Days of inventory (001)
U I**1 of SW% Ail "ta%
-0401~ SKU ^1l "Ut
1 2 3 4 5 6 7 8 9 10 1112 13 14 15 16 17 18 19 20 2122 23 24 25 (pilot weeks)
Figure 14: Days of Inventory (DOI) for the ITS VMI pilot
Furthermore, the ITS approach can be extended to sequential SEIO optimization. This sequential SS target setting approach considers individual inventory locations independent of other upstream or downstream locations. The sequential approach sets
targets at each location to assure a service time of zero (inventory is available when order is placed) for orders from a downstream location.
2.4.3 MEIO implementation in the Intel Box Channel Supply Chain
"Inventory Optimization is to achieve desired customer service level targets with lowest possible safety stock inventory cost in the supply chain, using a "precision strike" approach to the allocation of our inventory investment, targeting areas of high demand uncertainty and/or high customer service level strategy." -Intel
Inventory Analyst
As mentioned in the earlier chapter, Intel's main customers in the CPU space are OEMs, and channel customers. While Intel sells microprocessors directly to the largest computer manufacturers like Dell, Hewlett Packard and Lenovo, the Channel Supply Planning Operations (CSPO) organization is responsible for fulfilling the boxed CPU demands of Intel's vast customer network of distributors, resellers, dealers and local integrators. Intel's boxed processor shipment volume represents approximately 20% of Intel's total CPU shipments [7].
In 2005, the boxed CPU business group began a multi-echelon inventory optimization (MEIO) project to improve the efficiency and effectiveness of Channel's end to end supply chain [7]. After an extensive study, a commercial tool was selected to provide monthly MEIO solutions. Like Single Echelon Inventory Optimization (SEIO), MEIO optimizes the boxed CPU supply network and provides differentiated inventory target to achieve desired service level goals. In addition, MEIO performs a simultaneous,
global optimization over a very large assortment of Stock-Keeping Unit (SKUs) and achieve the same aggregate service levels with fewer inventories. It optimizes along multiple echelons of the supply chain, balancing between upstream and downstream inventory to identify the most globally efficient inventory, thus minimize the total supply chain cost across the whole boxed CPU supply network.
MEIO incorporates average forecast data, forecast error variability, average and standard deviation of throughput time per production stage, unit costs per production stage, transportation costs, inventory holding costs, and customer service level into its algorithm to provide differentiated Safety Stock (SS) targets by product, by site, and by stage. In the fourth quarter of 2005, the MEIO tool went live as an integrated component of the build plan process. Figure 15 reports the actual service levels attained for each class of managed SKUs beginning in November, 2005 [7]. SKUs planned by the MEIO tool consistently achieve higher service levels than the set of SKUs managed by planners (flat inventory policy). The initial result of MEIO implementation in CSPO shows an 11% overall inventory reduction for CSPO (2005-2006) [7].
Box Inventory and Service Level
-- Box MEIOproductsWOI--- Box Non-MEIO products WOI - Box MEIO Customer Service Level --- BoxNon-MEO Customer Service Level
am
E
0
monthl month 10 month 20 montt
ohm% #-G
log 00d 'IAV
30
Figure 15: SKUs managed by the MEIO tool have significantly higher service levels than planner-managed SKUs
[7] B. Wieland, P. Mastrantonio, S. P. Willems, and K. G. Kempf, "Optimizing Inventory Levels within Intel's Channel Supply Demand Operations," future issue, Interfaces.
The CSPO organization has used MEIO modeling to generate inventory targets for between 200 and 400 product/location combinations every month since
implementation [7]. In addition, a standard process was developed to ensure
collaboration across the various Channel organizations. Although the monthly SS targets are generated by the Optimizer, the model output could be ratified by the stakeholders during the Channel Strategy Review Meeting to better align the inventory policy with the Channel organization's current business objective.
Furthermore, high inventory efficiency and significant annual savings were achieved through continuous process improvement, including the implementation of Modified Sigma and Kernel Smoothing methodologies to solve the presence of bias in the sales forecast data. Figure 16 demonstrates the improvement of 1-Day COR response (one type of customer service level measurement at Intel) since the implementation of MEIO program and various process improvement initiatives at Box Channel Supply Chain. Modified Sigma was developed to adjust forecast error for the heterogeneity and bias problems, and Kernel Smoothing method was used to improve the relevance of the forecast error measurements. We will not discuss these methods in detail in this
document, but we refer the reader to publically available references for demand characterization methodologies in the next chapter, Literature Review.
Inventory Efficiency (Higher is better) Kernel Smoothing
implemented
Modified Sigma
<mplemented
1 4 7 10 13 16 19 22 25 28 (weeks)
-ME1O -- NonMEO
Figure 16: Modified Sigma & Kernel Smoothing Impact on CSPO Inventory Efficiency
[7] B. Wieland, P. Mastrantonio, S. P. Willems, and K. G. Kempf, "Optimizing Inventory Levels
within Intel's Channel Supply Demand Operations," future issue, Interfaces. http://www.informs.org/Pubs/Interfaces/Future-Issues
3
Literature Review
The measurement of forecast uncertainty is often called "demand
characterization" and is one of the most important and challenging factors within inventory optimization. This chapter reviews literatures that described the inventory optimization problem in Intel's VMI Hub and Box Channel Supply Chains and the adjustment procedures that were developed to produce appropriate inventory targets in the presence of forecast bias.
3.1 ITS Approach [9]
ITS is a single echelon optimization tool based on periodic review, base-stock methodology. It includes demand variability over replenishment time and target service level into its calculation.
ITS defines Forecast Error (FE) as e, = (l-LTt
-
-)FLT,t where F-LT,t is thedemand forecast for week t made in week t -L T, L T is the lead-time between the order placement to inventory receipt and A, is the actual demand realized in week t. ITS assumes that the FE comes from a single distribution. A Lognormal or a Normal distribution was found to be the best fit for the FE of A, / F,LT,t =- e, depending on
business group. This FE distribution is intended to capture effectively the FE error bias and variability in terms of u and a- respectively.
[9] A. Mishra, C. Arnold ,VMIDynamic Safety Stock Explore, Supply Chain Modeling & Solutions, Intel Corporation
ITS demand characterization measures the variability of the forecast error over the most recent 8 weeks, using a weighted moving average to place higher emphasis on the forecast error in the most recent weeks. ITS also performs a bias correction of future
demand forecasts using historical Forecast Error distribution. The time series based approach accounts for short product lifecycles and non-stationary FE as the nature of the OEM business group. The decision on targeted Service Level is made based on the news-vendor model formulation using financial parameters considering inventory overage cost and shortage cost.
The output from ITS is an order up-to target (1*) which is the sum of Cycle Stock
and Safety Stock. I* = Cs + Ss where Cs is cycle stock and Ss is safety stock. Cs =
DL where D is the forecasted demand in next lead-time period and Ss = (Bias adjustment) + (Variability adjustment). Figure 17 shows the core concept of ITS methodology [9]. In this figure, RT = LT.
Distribution of Demand over RT~ Normal (p,ar)
aeySte ck
PRT Order Upto Target
E(1-e)*DRT +zsL*o(1-e) *DRT
Figure 17: ITS "Order Up-To" Target Generation
[9] A. Mishra, C. Arnold ,VMIDynamic Safety Stock Explore, Supply Chain Modeling & Solutions, Intel Corporation
Next, we'd like to provide an example to illustrate how the ITS calculation works. Suppose we consider SKU1 with Target service level equal to 95% and with lead time equal to 1.57 weeks
e Step 1: calculate e and standard deviation of forecast error based on 8 weeks of historical data as shown in Figure 18
* Step 2: calculate s, a weighted moving average methodology that places higher emphasis on the forecast error in the most recent weeks. This will give us 1-s =
0.59, and mean error over LT = 1.57*0.59 = 0.92
" Step 3: calculate standard deviation of forecast error over LT = STDEV of (1 -e) *
VLT = 1.06
" Step 4: look up ZSL = 1.53
" Step 5: calculate ITS multiplier = E(1-e) + ZSL* u(1-e). E(1-e) is the mean error
over lead time, and u(1-e) is the Stdev of error over lead time. ITS multiplier = 0.92+ 1.53* 1.06 = 2.54
* Step 6: calculate the ITS Order-up-to Target = E(1-e)* DLT + ZSL* a(1-e)*DLT
ITS multiplier * DLT. Here we define DLT as the forecasted demand in next
lead-time period. This will give us ITS Order-up-to target of 799.51 units
" Step 7: calculate the SS target = "ITS Order-up-to Target" - DLT. This will give
us SS = 799.51 - 494.55 = 304.96 units
e= (Forecast s: moving
Actual -Actual STDEV of (1 Forecast average Forecast Demand demand)/ e)_weekl: over LT (LT (demand (Weekly) (Weekly) Forecast 1- e week8 = 1.57) charaterization)
Week1 100 0 1.00 - 1.00 Week2 100 126 (0.26) 1.26 0.37 Week3 50 42 0.16 0.84 0.27 Week4 50 105 (1.10) 2.00 -0.37 Week5 21 0 1.00 - 0.32 Week6 42 126 (2.00) 2.00 -0.34 Week7 0 0 - 1.00 -0.17 Week8 42 0 1.00 - 0.41
Week9 (Current WeekLT begins at) _ _0.84 494.55
WeeklO 315
Week1l 7875
Week12 15750 1 1 1 1 1
Week13 28350 1 1 1 1
Week14 28350 1 1 1 L
Figure 18: Example of ITS calculation 36
3.2 Boxed CPU Demand Characterization
A key component of the MEIO process is Forecast Error (FE) measurement, for purposes of demand volatility characterization. Or in the case of the off-the-shelf MEIO
software, forecast error is converted in units of the average monthly forecast (F) as shown below: Coefficient of Variation (COV) = a/F where o is standard deviation of forecast error, and F is average monthly forecast. This way, the data is independent from the forecast size and is defined in relative terms.
Graves and Willems (2000) [10] developed a framework for modeling strategic safety stock in a supply chain that is subject to demand or forecast uncertainty. At Intel, demand variability is the greatest contribution of the supply chain uncertainty. CPU products have relatively short life cycles; meaning new products are introduced with
great frequency. Managing product transitions is a particular challenge that exacerbates demand forecast error. Frequent transitions also make it difficult to collect data and measure the uncertainty for a specific product in terms of historical FE. Meanwhile, the
forecast data itself also tends to be biased, heterogeneous (scattered data), and with non-parametric densities (no clear data distribution pattern). Even if it does conform to a particular distribution, it is likely to be non-stationary distributions, which will change
frequently over time. Graves and Willems (2008) [11] introduced a demand model that permits finding the safety-stock placement in a supply chain that applies to the case of non-stationary demand.
[10] S. C. Graves, S. P. Willems (2000), "Optimizing Strategic Safety Stock Placement in Supply
Chain", Manufacturing & Service Operations Management, 2 (2000), 68-83
[ 1 1 ] S. C. Graves, S. P. Willems (2000) "Strategic Inventory Placement in Supply Chains:
Over the years, several continuous process improvement projects were developed to solve the imperfect forecast data problem in the Box CPU Supply Chain: the product transition maintenance tool was developed to map multiple products to a particular
market segment to solve for deficient forecast error data for newly launched products; the MEIO Cube was also developed to improve sample size collection by leveraging multiple forecast offsets in forecast error calculations; Modified Sigma was developed to adjust forecast error for the heterogeneity and bias problems. Lastly, a Kernel Smoothing technique was used to improve the relevance of the forecast error measurements by weighting the historical data points based on their relative proximity to the current
forecast [12]. Again, this research paper does not intend to discuss Modified Sigma or Kernel Smoothing technique in detail, but rather to introduce the basic concept of
demand characterization methodologies utilizing by the Intel Box Channel Supply Chain. However, we refer the reader to the references given by the footnotes in this chapter.
Modified Sigma
Demand planning and collaboration systems are plagued by persistent forecast bias caused by sales reward systems that encourage wishful thinking or by customers trying to secure supply they may or may not need. It is common to experience periods of time where the forecast either consistently exceeds or falls short of the actual demand. For example, a Channel Forecast Error study conducted by CSPO demonstrated forecast error bias based on the observation samples. Figure 19 shows the Median forecast represents 65 units actually sold for every 100 units forecasted.
[12] P. Bloomquist, M. Manary, A. Shihata, B. Wieland (2009), Correcting Heterogeneous &
Biased Forecast Error at Intel for Supply Chain Optimization, Intel Channel Supply Demand
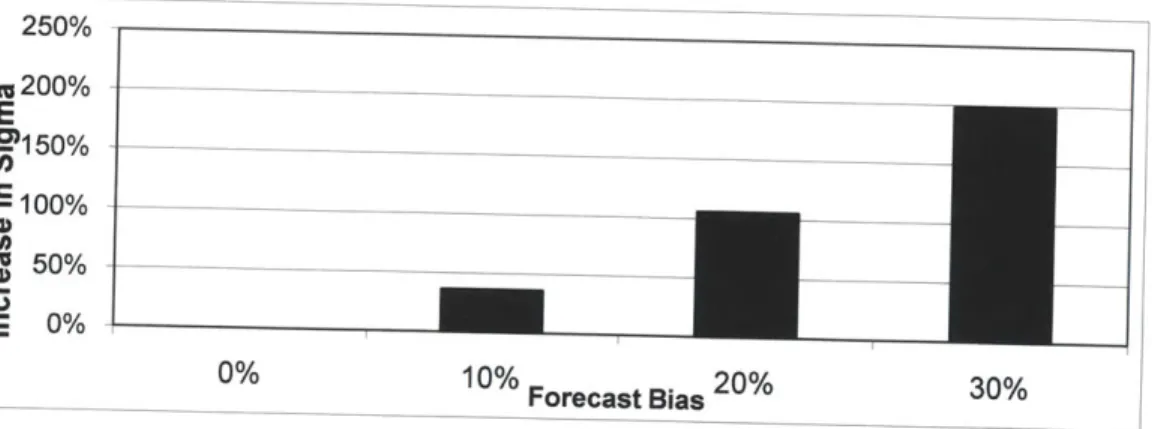
MEIO's initial estimate of demand variation (a2) was calculated from a standard deviation of forecast errors (SDFE) equation, but SDFE is sensitive to any bias in the forecast. Figure 20 illustrates how increase in sigma may be affected by the forecast bias.
,(F1 -A)2
aSDFE -I
Qwntile Fert + DewuardFst 100.0%
maximum
0.99985 99.5% 0.99751 97.5% 0.98425 90.0% 0.91728 75.0% quartile 0.79494 5.0%median
0.644 25.0% qua 0.44759 10.0% 0.28538 2.5% 0.11765 0.5% 0.03557 0.0% minimum 0.00647Figure 19: Intel Channel Forecast Error Summary
250% =200% E .0150% CO) -E 100% 50% 0% 0% 10% Forecast Bias 20% 30%
Since optimization software assumes "well-behaving" error and sets safety stock targets in large part from the base stock equation q + F~1(a) 0c, a 30% bias equates to an approximate tripling of the SDFE, which has a linear affect on inventory targets.
However, it was determined that managing the forecast bias by directly modifying the raw sales forecast data was not an option for the Box Channel Supply Chain because
Sales and Marketing controlled and loaded the data into the manufacturing resource planning (MRP) system before the planning organization received it. Therefore, the average forecast demand, with its bias present, was already in the system; the only adjustment that CSPO could make was to change the inventory target. In 2008, Manary and Willems presented a set of adjustment procedures that produce appropriate inventory targets in the presence of forecast bias [13]. Modified Sigma was adopted by CSPO to adjust the error measure to account for systematic forecast bias. In order to use
optimization techniques the forecast imperfections needed to be addressed through aY. According to Forecast Error (FE) measurement [13]:
Forecast
Forecast i + Actual Demand i
Modified = Max p, 0
Modified Sigma can be presented as: -- where Op
denotes the quantile point corresponding to
p
from the distribution of Os,p
= 1 -a. tp,df is the student-t distribution with a cumulative density ofp
and degrees of freedom coming from the number of historical points to draw from, and p is the average demand. In the case of extreme over-forecasting, the CSPO MEIO models do notrecommend any SS targets, and for extreme under-forecasting the models call for higher SS targets than would otherwise be calculated using a standard approach.
[ 13 ] M. Manary and S. Willems (2008), Setting Safety-Stock Targets at Intel in the Presence of
Kernel Smoothing
All optimization approaches make assumptions about FE accuracy. Standard approaches typically assume error is centered, and normally distributed. Departures from this assumption have profound impacts on SS targets; Manary and Willems (2008) [13] developed an algorithm which eliminates the impact of bias and non-normality of
forecast errors. To check for homogeneity, CSPO compared aModified for multiple service levels then adapted Bartlett's test (1946) [14]. They anticipated a 5%-10% failure rate, but the actual failure rate was above 50%. Closer examination revealed two issues: First, Products displayed significant deviation from Normal behavior. Second, even
"homogeneous" products were heterogeneous when viewed from a different perspective. Therefore, any solution for estimating FE at Intel should address bias, heterogeneity, and errors for an individual product potentially coming from multiple (or undefined)
distributions.
To improve the modified sigma method CSPO developed a Kernel Smoothing technique which does not require FE to be assumed from any one distribution [12]. This
enables customized output for each product at each forecasting level. Combining Kernel Smoothing with Product Transition Mapping enabled CSPO to generate assumptions that best fit the actual FE, giving the most weight to observations with similar prior forecasts and life-cycle stages.
[12] P. Bloomquist, M. Manary, A. Shihata, B. Wieland (2009), Correcting Heterogeneous &
Biased Forecast Error at Intel for Supply Chain Optimization, Intel Channel Supply Demand
Operation, Interfaces C2009
[13] M. Manary and S. Willems (2008), Setting Safety-Stock Targets at Intel in the Presence of
Forecast Bias, Interfaces 38(2), pp. 112-122, 02008 INFORMS
[14] Bartlett, M.S., D.G. Kendall (1946), The Statistical Analysis of Variances-Heterogeneity and the Logarithmic Transformation, Journal of Royal Statistical Society, p. 128-138 ©1946
CSPO minimized the impact of bias, heterogeneity, and potential non-parametrics by isolating a sigma estimate close to the current forecast level. One challenge was a relatively low number of observations around the current forecast level to draw on as a population. To compensate for this, CSPO decided to apply a weighting system to FE observations with decreasing influence as the associated past forecast is further away from the current forecast. Ultimately, CSPO found the most robust technique for calculating sigma under biased, heterogeneous and nonparametric error was to apply a nonparametric approximation of the product error-density function across the full range of prior forecasts, allowing a Kernel-Smoothing technique to help determine a weighted, localized error pattern, while not been deterred by non-parametric error [12].
[12] P. Bloomquist, M. Manary, A. Shihata, B. Wieland (2009), Correcting Heterogeneous &
Biased Forecast Error at Intelfor Supply Chain Optimization, Intel Channel Supply Demand
4
Three Lens Analysis
This chapter details an organizational processes analysis called the three lens analysis [15] whereby we examine the organization from a strategic design, cultural, and political perspective. The purpose of the analysis is to provide an objective and unbiased assessment of Intel's FG CPU Supply Chain organizations and their efforts to implement the Inventory Optimization initiative. The analysis also allows for a richer understanding of the different elements that impact an organization and its ability to deal with the internal and external stresses brought about by change.
4.1 Strategic Design Perspective
The strategic design perspective focuses on: how the flow of tasks and
information is designed; how people are sorted into roles; how these roles are related; and how the organization can be rationally optimized to achieve its goals [16]. Figure 21 shows the basic processes involved in strategic design. The three key elements of organizational design are grouping (differentiation), linking (integration), and aligning. From the strategic design perspective, reasons for organizational ineffectiveness include: unclear goals, ineffective grouping, inefficient linking, unsuccessful internal alignment, and poor external fit.
[ 15] J.S. Carrol (2006), Introduction to Organizational Analysis: The Three Lenses, MIT Sloan
[16] Ancona, Kochan, Scully, Van Maanen and Westney, Managing the Future: Organizational
Assess Environment (Threats and Opporthnities,
Industry Analysis, Etc.) Strtegicgn
H
Intent .taeiGrungAssess Organization (Core competencies.
OrganizatioOal Capabilities)
Figure 21: Processes in Strategic Design
Grouping (differentiation)
Grouping is a framework that draws boundaries around clusters of tasks or activities to define jobs, departments, processes. Intel is a large matrix organization that can be very difficult to navigate. Currently, Intel has several grouping structures in different levels of the organization; for example, the corporate structure is grouped by functions, as shown in Figure 22.
Pmesidenta CEO- Paul S.Otmni
Sals ndnt igta Legal
&
Marketing Architecture Health TMG (Technology Intel capital Intel ta s Crprate
Manufacturing Group) Affairs
Figure 22: Functional Grouping Structure
Each corporate functional group then further divides into several divisions either by functions or by products. For example, Supply Planning Operations (SPO), the group that synchronizes product supply with customer demand, can be represented in product
grouping structure by dividing the planning groups into different product divisions, as shown in Figure 23. The Channel Supply Planning Operations (CSPO) is responsible for the demand and fulfillment alignment for Boxed CPU products and the Intel Architecture Division Planning (IADP) is responsible for all the supply and demand for tray products, including processors and chipsets. Currently, both CSPO and IADP have their own supply & demand alignment team, planning team, and operation teams. From an inventory optimization perspective, CSPO has its own inventory analyst, who is
responsible for setting the monthly safety stock strategy for boxed products using MEIO methodology. IADP does not have its own inventory analyst group, but rather works with the Supply Chain Modeling & Solutions team and Supply Planning Integration &
Analytics (SPIA) team for the inventory optimization needs; for example, the ITS pilot for the VMI hub products. To remain unbiased, we created a research project under
SPIA team, which acts as an internal consulting group tasked to drive supply planning integration and analytics efforts across the Intel Supply Chain.
anning Channel Supply
on & Planning
(SPIA) Operations (CSPO)
Supply & Channel
Box Factory
Demand Planning f an g
Alignrnent Capabilities Plnig 401er
Figure 23: Simplified Org Chart for Supply Planning Operations
Linking (integration)
Linking integrates the subdivisions across organizational boundaries. Currently, CSPO and IADP operate independently with no strong linking mechanism in place. From an inventory optimization perspective, there are several weaknesses with the current division structure, including insufficient knowledge sharing, limited career growth of inventory specialists, strong division affiliations, and difficult product
1. Insufficient Knowledge Sharing: inventory specialists with particular domain knowledge cannot share their expertise across divisional boundaries due to resource constraints in the current division structure. This restricts the opportunity for the IADP and the CSPO to share best practice and conduct knowledge transfers in inventory optimization.
2. Limited Career Growth of Inventory Specialists: technical specialists feel alienated from their peers in other divisions and lack the exposure to the growth opportunities in other organizations.
3. Strong Divisional Affiliations: some employees may feel more allegiance towards their own department than towards the larger organization. While they discern their organization's role, they may not understand how their organization relates to the larger organization's goals.
4. Difficult Product Integration: Intel has multiple product groups and the integration task is extremely challenging because there is little coordination between different divisions. The product management task across different division requires regular sync-ups, but the structure inherently provides little motivation for the product managers to seek this larger goal.
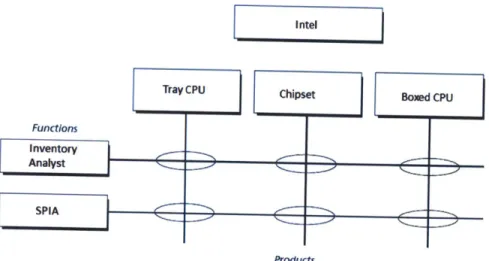
One potential solution to these issues is to use Functional/ Product Matrix structure , as shown in Figure 24, which is similar to the structure of Supply Planning Integration & Analytics (SPIA) group. The SPIA team has experts familiar with the planning processes, analytics, and data access, who can bring integration solutions by leveraging the best practices in different supply chains.
I ntel
Tray CPU Chipset Boxed CPU
Functions
Inventory
Analyst
SPIA
Products
Figure 24: Functional/Product Matrix structure
Aligning
Aligning provides access to ensure that units and individuals posses the necessary resources and motivation to complete the tasks assigned. Aligning can be achieved by organization performance measurement systems, individual rewards and incentives, resource allocation, human resource development, and informal systems and processes.
Overall Intel communicates its strategy very well through several channels, and its sub-organizations seek continuous improvement. Last year, a supply shortage issue resulted in a company-wide effort to reduce its overall pipeline inventory, this shortage issue provided incentive to use analytics to determine inventory strategy across planning processes.
By recognizing the linking gap between different divisions, SPO launched several initiatives to improve collaboration amongst its planning teams. For example, they created fused quarterly Tray/Box Planning Collaboration Forums as knowledge sharing platforms. To facilitate these forums, they invited experts to address these supply chain issues within different business groups. Also, the Supply Chain Strategy (SCS) team started monthly Supply Chain Tech Forums which fostered the engagement necessary amongst technologists and supply chain managers to solve the key supply chain challenges within Intel.
Furthermore, Intel designed many human resource processes to encourage better alignment in bridging the resource gap and in increasing upward management exposure across the different business units. Fox instance, individuals commonly take on
temporary relocation assignments in different functional groups. Additionally, individuals frequently apply for acting manager positions, while their manager is on sabbatical. These practices successes in promoting career development and creating cross organizational learning opportunities.
4.2 Political Perspective
"Politics constitutes the dark side ofthe organization...An inability or an unwillingness to deal with the political aspects of organizations, however, is a serious handicap for anyone trying take effective action in an organizational setting." [16]
The political design perspective focuses on how power and influence are distributed and wielded; how multiple stakeholders express their different preferences and get involved in decisions; and how conflicts can be resolved. Its core concepts revolve around "interest" and "power".
Interest
"Simply recognizing that interests are important is the first step in developing an ability to use the political lens to take more effective action in organizations. The next step is much harder: analyzing what those interests are and what priority they have for key individuals and collective actors. "[16]
[16] Ancona, Kochan, Scully, Van Maanen and Westney, Managing the Future: Organizational
![Figure 7: Intel CPU distribution channels [6]](https://thumb-eu.123doks.com/thumbv2/123doknet/14056897.460839/22.918.219.664.110.472/figure-intel-cpu-distribution-channels.webp)


![Figure 31: MEIO Data Flow [18]](https://thumb-eu.123doks.com/thumbv2/123doknet/14056897.460839/60.918.135.764.180.674/figure-meio-data-flow.webp)
