HAL Id: hal-01081295
https://hal.archives-ouvertes.fr/hal-01081295
Submitted on 7 Nov 2014HAL is a multi-disciplinary open access archive for the deposit and dissemination of sci-entific research documents, whether they are pub-lished or not. The documents may come from teaching and research institutions in France or abroad, or from public or private research centers.
L’archive ouverte pluridisciplinaire HAL, est destinée au dépôt et à la diffusion de documents scientifiques de niveau recherche, publiés ou non, émanant des établissements d’enseignement et de recherche français ou étrangers, des laboratoires publics ou privés.
Distributed under a Creative Commons Attribution - NoDerivatives| 4.0 International License
smallholders’ oil palm plantations: a preliminary
proposal from SPOP Project
Alice Baudoin, Pierre-Marie Bosc, Cécile Bessou, Margot Moulin, Julie
Wohlfahrt, Claude Jannot, Karine Lé, Sylvain Rafflegeau, Raphaël Marichal,
Jean-Pierre Caliman
To cite this version:
Alice Baudoin, Pierre-Marie Bosc, Cécile Bessou, Margot Moulin, Julie Wohlfahrt, et al.. Towards a multidimensional assessment grid of smallholders’ oil palm plantations: a preliminary proposal from SPOP Project. ICOPE 2014, PT SMART, Cirad, WWF, Feb 2014, Indonesia, Indonesia. pp.23. �hal-01081295�
1
Towards a multidimensional assessment grid of smallholders’ oil palm
plantations: a preliminary proposal from SPOP Project
Alice Baudoin1,2, Pierre-Marie Bosc2, Cécile Bessou1, Margot Moulin3, Julie Wohlfahrt3, Claude Jannot1, Karine Lé2, Sylvain Rafflegeau1, Raphaël Marichal1, Jean-Pierre Caliman1,4
1
Cirad Perennial Crops Research Unit, Av. Agropolis 34398 Montpellier, France 2
Cirad MOISA Research Unit, Av. Agropolis 34398 Montpellier, France 3
INRA ASTER Research Unit, 662 avenue Louis-Buffet 88500 Mirecourt, France 4
SMART Research Institute, Jl. Tengku Umar 19, Pekanbaru, 28112, Indonesia
ABSTRACT
This contribution is an intermediate product of the ANR1 research project, SPOP (Sustainable Palm Oil Production). SPOP project aims at providing scientific knowledge on the diverse oil palm cropping systems in Indonesia and Cameroon, and on their social, economic and
environmental impacts. This knowledge should help identify best practices, adaptation strategies, and improvement needs towards sustainability. At this stage of the research programme, we first aimed to present the applied methodology and analyse its relevancy in light of the first field data collection.
INTRODUCTION
The cultivation of oil palm has become emblematic of the trade-off between development and conservation that agricultural commodities have to face: matching an increasing global
demand while preserving the capacity of land to provide ecosystems services. This challenge illustrates how local productions are tightly connected to more global socio-economic and environmental issues in the context of global changes. Global changes are here defined as a whole constraint system resulting from the recent and assumed future evolution of the global production conditions and factors. In essence, sustainable production systems should be able to adapt to global changes, since they are defined to ensure that the production potential for future generations is not compromised by current practices. However, in the facts, codes of practices towards sustainability mostly provide guidelines of best practices according to current knowledge. There cannot be any integrative methodology to assess the effectiveness of sustainability. Guidelines, such as the Roundtable on Sustainable Palm Oil Principles & Criteria (RSPO P&Cs, 2007) provide a global and harmonised framework reflecting the global issues and subsequent constraints. Nevertheless, at the local scale, complementary knowledge and accurate impact assessments are necessary in order to analyse how the cropping systems are influenced by the global changes and to better ensure that recommended practices can lead to sustainable productions.
1
Agence Nationale de la Recherche (French public funding agency for research) is funding the SPOP project for the 2012-2016 period.
2
The ANR research project SPOP (Sustainable Palm Oil Production), 2012-2016, aims at providing knowledge-based solutions to contribute to this analysis and ensure the
sustainability framework of palm oil sector, while reinforcing existing initiatives such as RSPO or ISPO (Indonesian Sustainable Palm Oil). Improved and updated knowledge is not enough though and the transition between knowledge and decision making is often critical. Thus we designed the present SPOP project in the aim of providing models, scenarios and tools for decision making, while applying participatory methods to ensure the suitability of the tools and their adoption by the stakeholders. Within this frame, the core focus of this project is to provide adapted methodological tools to study the impacts of the oil palm cropping systems. The work presented here is part of the Work Package 1 “Characterisation of the various oil palm cropping systems: agricultural practices and 3D impacts, potential adaptation to global constraints”.
OBJECTIVES
We propose here a baseline work to explore and understand the variability of the
smallholders’ production structures and to provide a preliminary multidimensional grid of analysis. We chose to provide a dynamic typology of smallholdings based on explicit hypotheses that need further investigation. Our multidimensional grid focuses on the main variables that provide a synthetic view to document the performances of the different
cropping systems. The basic hypothesis tested in this project is the possible relations between the type of production structure and the values of the performance indicators at production and cropping system level.
MATERIALS AND METHODS
The methodology is based on the World Agricultural Watch (WAW) approach (FAO, 2012), itself inspired by the Sustainable Rural Livelihood (SRL) framework (Chambers and
Conway, 1992). In our case study, the core of the field-applied WAW approach is to capture the global rationale of the holdings and assess the place and role of oil palm production within the household economy – including farm and non-farm activities - and in terms of 3-dimensional impacts (3D-impacts), i.e. social, economic and environmental impacts.
SPOP project is focused on Cameroon and Indonesia where development schemes supported the development of oil palm smallholdings in different ways. In Cameroon, oil palm plots were all planted by smallholders who fully manage them. In Indonesia, it’s the same for independent plots, who are fully managed by the smallholders, but different for plasma plots that may be acquired through different development schemes and that can be either semi-managed by smallholders (smallholders start managing the plots after the juvenile phase) or fully managed by the contracting industry. As development schemes induced much more diversity in Indonesia, we chose that country in order to get a greater variability in the smallholders’ production structures. More precisely, we selected the Riau province in Sumatra, which is characterised by independent and plasma smallholdings with an outlook over more than one oil palm generation.
Surveys were based on both oriented and comprehensive question sets. We focused in this first field work campaign on the smallholders’ systems within the supply area of a palm oil company. In total, 43 oil palm growers were interviewed giving way to 33 complete questionnaires on 33 holdings and 40 oil palm plots. For each holding, one to two oil palm
3
plots were included in the survey with contrasted levels of management (semi-managed and independent from recommendations of the company estate). As we aim to explore the
management diversity between smallholdings, we decided to keep full managed plasma plots out of the plot survey because they are all managed equally and like the contracting industrial plantation. Data were collected in Kampar District, Riau province. The first analysis of these data sets was carried out with the help of the Sphinx Software (Sphinx Plus2 v.5.1.0.7). Further statistical analyses are on going to complete this preliminary analysis.
The proposed indicators are organised along the classical dimensions of sustainable
development: social, economic, and environmental. While social and economic dimensions are estimated at household level, the environmental dimensions relies more on estimates at plot level. The social performances are estimated through a combination of several
components including living standards, education (for the children) and health. Economic performance of the holding is based on an assessment of the total household income
including both oil palm and other farm and non-farm activities. Environmental dimension is based on two main indicators in relation to the use of chemical fertiliser and herbicides. Extrapolation of environmental performances from plot to holding level will be discussed.
RESULTS
Understanding the various smallholders’ production systems
In this area, where oil palm plantations have been developed for more than one generation, we aimed to identify potential differences in production and activity systems’ development and strategies that may explain differences in performances across the various holding types and cropping systems. We used a set of structural indicators to analyse the production
systems and their various evolutions in terms of the five capitals (natural, physical, financial, human and social) from the “livelihood” methodology FAO (2012).
Moving from a linear typology towards a strategic one
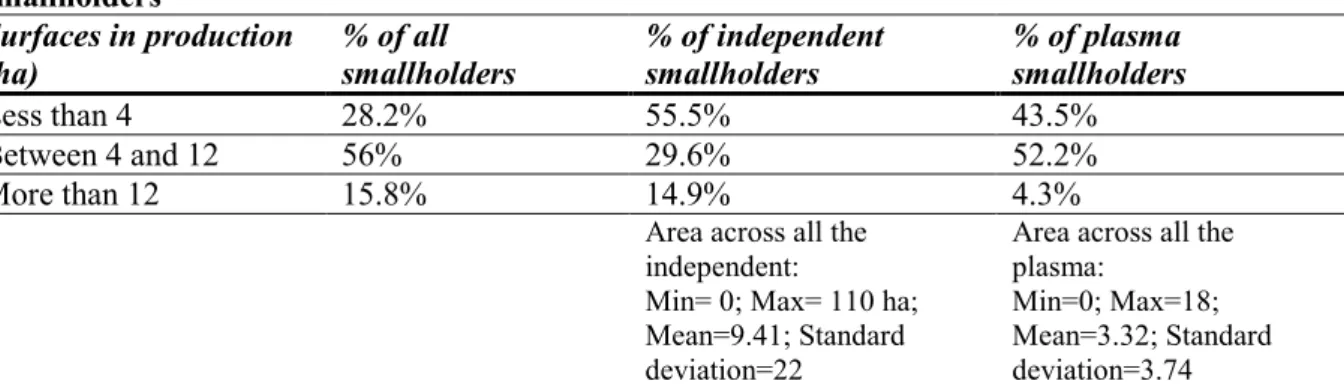
Holding size is usually considered as the most discriminating factor to distinguish production systems (Eastwood and al., 2010), especially when there is a common dominant crop to all of them. Within the frame of RSPO, smallholders are thus defined as holders with less than 50 ha2 which is a rather high standard compared to the importance of holdings below 2 ha at world level3 and especially in Asia (HLPE, 2013). Our sample encompassed many sizes of holdings, the area under independent production (2-110 ha) being more variable than that of plasma production area (0-18 ha) (Table 1).
2
RSPO definition of smallholders: Farmers growing palm oil, sometimes along with subsistence production of other crops, where the family provides the majority of labour and the farm provides the principal source of income, and where the planted area of oil palm is usually below 50 hectares in size [Definition from: RSPO Principles and Criteria for Sustainable Palm Oil Production – October 2007].
3
At world level holding farming less than 2ha account for around 85% of all holdings and in this the share of Asia accounts for more than the two thirds (HLPE, 2013)
4
We refer here to the distinction between production on plasma plots and production on independent plots, already discussed in the literature (Colchester and al., 2006; Mc Carthy, 2010; Duryat; 2011). Independent plots refer to plots planted by individuals without being part of a Nucleus Estate Scheme (NES). By analogy, independent smallholders are those not linked by contract to any company or mills (private or state owned) to manage their
independent plots. However, plasma smallholders, who are part of a scheme, may also develop independent plots apart in a way that may be, or not, completely outside the influence of a nucleus (i.e. to get access to planting material or inputs). Inversely,
independent smallholders may have acquired plasma plots subsequently. Thus independent and plasma plots may co-exist in holdings. The classification of one holding as independent- or plasma-oriented finally relies on the predominance of independent or plasma plots within the holding strategy.
Table 1: Sizes of oil palm cumulated plantations areas for surveyed independent and plasma smallholders Surfaces in production (ha) % of all smallholders % of independent smallholders % of plasma smallholders Less than 4 28.2% 55.5% 43.5% Between 4 and 12 56% 29.6% 52.2% More than 12 15.8% 14.9% 4.3%
Area across all the independent:
Min= 0; Max= 110 ha; Mean=9.41; Standard deviation=22
Area across all the plasma:
Min=0; Max=18; Mean=3.32; Standard deviation=3.74
Size is indeed a relevant indicator, especially as we observed in our sample high variations in the income level ensured by various systems per surface area unit. Annual income from plasma plots (2 ha) ranged from 3,000$US to 8,000$US, i.e. 2 to 6 times the mean averaged Indonesian annual income4 (1,416$US). These results were notably relevant regarding previous studies made in Bungo district (Feintrenie et al., 2010). Annual income earned from independent plots (2 ha) were even more variable (800$US to 6,000$US per year in our sample).
Plasma plots usually ensure high yields and incomes, through proper fertilisation practices and certified seeds. However, the inputs are bought on a credit that must be reimbursed and the price to pay for the plot is very high (especially when land resource becomes scarce), (Colchester and al., 2006; Mc Carthy, 2010; Duryat; 2011). On the contrary, independent plots have usually lower yields (despite some questionable exceptions in our sample) but it is compensated by low input costs through less fertilisers (sometimes of a lesser quality). These characteristics were confirmed in our sample. Plasma plots’ income were usually much higher than independents’ ones, regardless of credits, which could suggest a higher capacity for investment. However, we did not have the data regarding the amount of the land credit at the time of installation. For independent plots, the unselected seeds, the variable price paid by the broker and the more frequent poor quality of the soils (peats, hilly areas) limited the potential income. Nonetheless, the frontier between these two specific plot and management types is not so strict because at the holding level where both both plasma and independent
4
5
plots were combined, similarities in management were observed in our sample. In two cases (1 and 28), similar fertilisers and herbicides applications on plasma and independent plots were recorded. These producers were both migrant but started with plasma plots and owned between 8 and 12 ha of oil palm plots.
The combination of plasma and independent plots appeared to be an indicator of i) the willingness of the smallholder to diversify the oil palm management and try to manage risks linked to varying production performances; ii) an initial opportunistic or a subsequent will to integrate a NES scheme, and iii) possibilities in terms of assets accumulation. Authors underlined that plasma producers were often capable of reimbursing their credit quickly (in less than three years) when a high monthly payback was chosen (Feintrenie et al., 2010). Freed from previous credits reimbursement, these producers may expand quickly, if they’re willing to, being capable of handling other credits. That is why we made the hypothesis that the initial type of plot (starting point) had an important impact on future oil palm investments and possible expansion, as it may enable or not to access credit or direct purchase of planted plots. Moreover, accounting for this historical perspective about older holdings’ expansion, we could reinforce our understanding of the smallholders’ orientations and constraints. For instance, a starting point between 1996 and 1999 defined a population that could rather easily access to plasma plots through PIR5 programs: migrants from outside Sumatra but also spontaneous migrants from Sumatra in the same period. Referring to this establishment phase could explain why some could quickly expand even in plasma thanks to plasma availability and lower land price. On the contrary, non PIR migrants, who arrived after 2000, were completely independent from companies and show a rather low expansion pace for now. Reduced opportunities to access to plasma plots led to higher prices for oil palm plots which may have explained why some were more likely to expand in an independent way, sometimes planting on peat soils, if expanding at all. In the case of PIR-Trans programs which promoted palm oil development, the 2008 crisis or the impact of land prices increase were key events that affected the set of constraints and opportunities faced by smallholders.
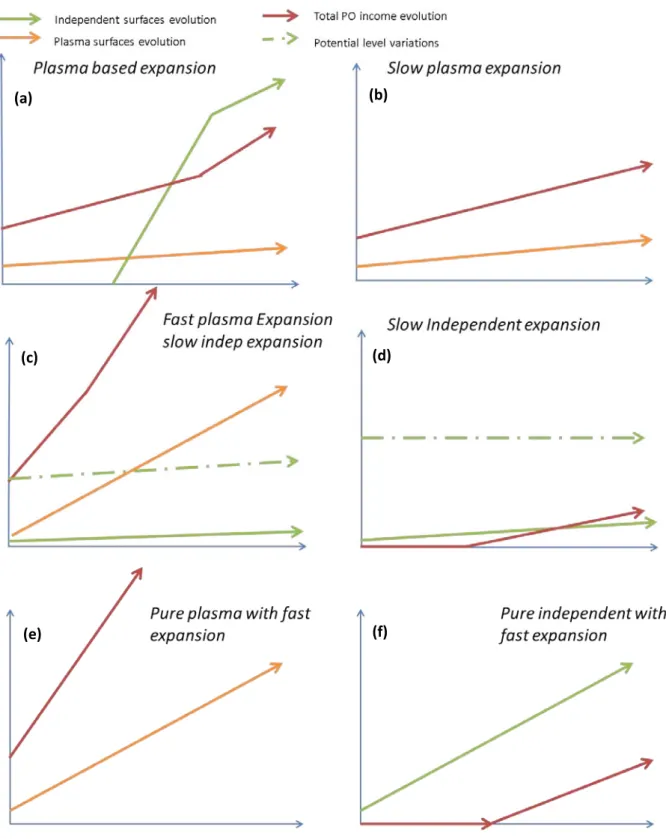
With our data, we could design the evolution of oil palm areas for each holding. After representing oil palm surfaces evolution for each holding, we characterised six main
trajectories (Figure 1), showing the pace of oil palm area acquisition (the slope of the straight lines) and the evolution of the oil palm income per year. Reconstruction of the origins and pathways were key factors for it takes into account, at least for the oldest holdings, the main changes in palm oil environment. We used the analysis of older holding starting point and evolutions in order to try to position the younger holdings on the trajectories as they present similar characteristics with the older holdings’ trajectories.
5
6
Figure 1: Representation of the six trajectories observed in our sample based on mature and retiring holdings. The x-axis represents the time frame from the starting year of oil palm production,
up to now; the y-axis represents the accumulated oil palm areas and total incomes. Dots lines
represent potential variations in the amount of hectares but not in the evolution. Slopes are indicative and based on a qualitative analysis of the data set.
(a) (b)
(e) (f)
(d) (c)
7
The graphics (Figure 1) show the type of plot the holding started with. We can see both the level of oil palm surfaces (and income) on the y-axis and their total pace of increase through the slope of the lines. Increase in oil palm income starts as soon as a new plasma plot is acquired (all of them were already in production at the time of the purchase). However, the increase occurs with an offset for independent plots, all of them being either not planted or immature at the time of the purchase.
Initial access to plasma plots allowed some smallholders to consolidate their natural assets through the purchase of new lands planted in an independent way (“Plasma based expansion” Figure 1(a)). A slow expansion pace was found for independent producers with lesser access to credit and lesser capacity of investment (“Slow independent expansion” Figure 1(d)). One of the strongest trajectories we observed is “Fast plasma expansion” (Figure 1(c),(e))
combined with few or more independent plots. Most of these smallholders started with plasma plots, but a few also increased areas in plasma plots based on significant initial independent plots income in our sample (n°35) (Figure(c)). Income has plummeted with plasma accumulation making expansion even easier. Whether these trajectories may lead to further accumulation of independent plots, as is the case for the holding n°19, has yet to be proven. In these trajectories, there seems to be a trade-off between quantity and quality for plasma and independent plots (plasma plots being of better quality but independent plots being cheaper to accumulate). Some trajectories presented almost no expansion at all (Figure 1 (b)) for holdings which could have been expanded based on our analysis of available data. Therefore it will be interesting to deepen our understanding of these cases in order to know whether it was a strategic choice or a result of other constraints on the system.
The strategic pathways
Using holding size as a unique entry point would have led us to a classic classification between small and large scale holdings with a tendency to over emphasise a rather classical life cycle perspective (young households’ head being equivalent to smallholdings and older ones heading larger holdings), see for instance Ruf, Salem Taher and Yoddang (2004) for coffee farms in Southern Sumatra and Ruf and Schroth (2012) for a recent synthesis. Our analysis showed that there was no strict correlation between the size of the holding and the age of the household head (assimilated to the age of the holding). In our sample, most of the surveyed holdings were already at a “mature stage”, with farmers aged between 40-50 years old and installed for more than 12 years (palm trees >14 years). Only a few young holdings were characterised by young head of farm, recent installation date and usually younger palm trees (<8 years). But among these young holdings, some had already accumulated plots quicker that some older ones. Besides, for the same size of holding and the same stage of development, some holdings consisted exclusively of plasma plots while others exclusively of independent plots. It may have been due to more or less access to different options. These cases are interesting for they raise a number of issues regarding the choices made by the smallholder regarding his opportunities and the way they seize them or not. Our observations emphasised that neither the age or the size of the holding could be considered as a unique discriminating variable. We then needed to introduce factors that relate to smallholders’ strategies to develop a more comprehensive analysis of households’ strategies and holding organisation.
8
Bosc et al. (2012) suggested four sets of strategies: intensification/extensification, specialisation/diversification, concentration/dispersion, integration/autonomy that can be implemented at holding/household level but also at plot level and that are not systematically exclusive. These dynamics were relevant in our context but the lack of extensive data made it hard to define them for every holding. We still used them as tools to understand and handle the diversity of holdings in order to reduce it to a limited relevant number of holding types. These strategies are constructed by the researchers based on basic decision processes. They are rarely perceived or defined as such by the smallholders themselves. From there, what can be observed only is a partial result - at time “t” – so that the challenge was to capture through interviews the decision making processes and their rationales to explain the present situation (Yung and Zaslavski, 1992). Thus a strategy is not an object the researcher can directly observe; it is a crafted representation of the reality.
In particular, to help us understand the main logics represented in our sample we chose to emphasise several complementary key points: (i) diversification as a mean to reveal the rationale in choosing between different activities and/or within a sector oriented set of inter dependent activities, in this case within oil palm and palm oil production as opposed to specialisation, in oil palm; (ii) intensification/extensification according to the level of input used. The level of autonomy or on the contrary of dependency on companies appeared to be a consequence of the former behaviours. What came from our observations was rather a
combination in time and space (through access to different plots under contrasted management regimes) for a defined smallholding.
To understand the strategic behaviours, we first analysed qualitatively and relatively the various assets each household relied on. Because physical assets encompassed the plantations (regarding its surfaces, vegetal material quality and age of the trees), it increased a lot from small independent holdings to larger holdings with significant “plasma” production.
Accordingly to the observed positive relation between oil palm income and credit access, financial assets tended to follow the same pathway when other incomes were not consequent. Within our sample, natural assets appeared relatively homogeneous since the main
distinguishing criteria we used were relatively rough: peat soils versus mineral soils, topography, and access to fish ponds. As usual with the SRL approach, social and human assets were difficult to assess to differentiate households (Pesche 2004; Ravanera et al. 2010; Fine 2010), and this difficulty was increased by the short period dedicated to data collection. We used as proxies responsibilities such as cooperative coordinator or head of smallholders’ group which increased both assets and were usually higher in holdings integrated through plasma production. Non oil palm skills (higher level of human assets) within the household seemed more concentrated on holdings engaged in diversifying their production systems. Organisational differences between plasma and independent also encompass the type of workers and potential available advices. In plasma plots, smallholders rely on labour provided by the cooperative and technical advice from the company, whereas fully
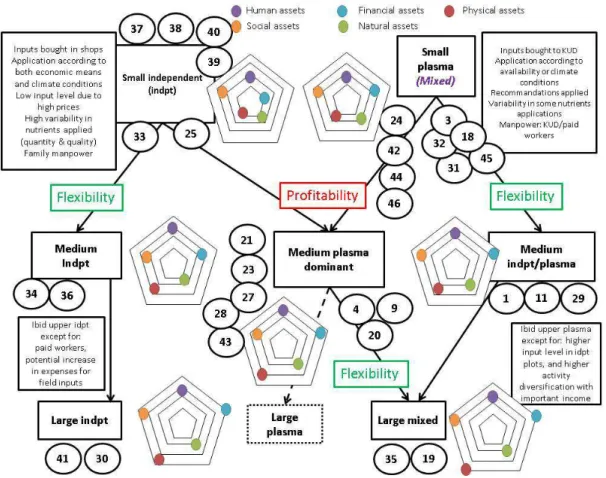
independent smallholders seem to rely preferentially on their social networks and assets6. All assets were thus quantified on a qualitative scale which enabled the definition of combination of assets for each type of holding presented below (see radar diagrams Figure 2 and Table 2).
6
This is a rather general statement and some of our results show the opposite regarding the performances of independent plot under smallholder management. This kind of situation would require further investigation.
9
Then, we investigated further the ways smallholders mobilised their assets and how these might be correlated to strategic choices. For example, to expand oil palm surfaces on plasma, the mobilisation of credits to buy these plots and the high level of inputs application may underline an intensification process. On the contrary, an extension on independent plots, with lower levels of fertilisers and large areas bought at once may traduce an extensification process. However, these dynamics are not exclusive within the holding life cycle. Indeed, a smallholder may alternate between extensification and intensification periods depending on his needs and opportunities. Another smallholder may want to buy large areas of land while prices are still relatively low and later improve their productivity through more intensive practices. As for the construction of the strategies, the analysis of current practices could not be fully understood without looking at the history of the whole holding. Eventually, the strategic pathways were based on both the analysis of the holdings’ history and choices and their repercussions onto the levels of the five assets.
Within the approach of the smallholders’ livelihoods, the role of oil palm production was assessed among the possible other activities developed by the households. Despite the variability in profitability across the plots, oil palm income was undoubtedly an important financial asset for smallholders and determined some potential of the holdings in terms of domestic investments (education, house, etc.), or new productive investments directly or through improved access to credit to acquire other oil palm plots. Because oil palm economy in the surveyed area tends to overpass all other activities, diversification outside oil palm related activities appeared to be very limited7. We could identify three main diversification activities: other vegetal or animal productions, off-farm palm oil related activities (wage labour for palm oil companies or for other smallholders, developing a transport activity to feed the mills), and tertiary activities (teacher, small scales commercial activities,
mechanics…). Our results showed that these diversification activities – accounting for
Diversification pathway - did not contribute much to household’s total income compared to
direct oil palm production income, except for newly established holdings8. Due to some data limitations, we could not specify the importance of previous savings and complementary activities at the time of installation for land investments. However, we can make the
hypothesis that previous tertiary activities and/or working in palm oil business could favour smallholder’s establishment strategies through possible direct purchase of land or access to loans. This could explain for instance how some smallholders can afford to buy wide oil palm areas already at first acquisition.
Based on our analysis, the pace of plasma plots acquisition indicated a specialisation and intensification strategy that we qualified as an “Intensification/Specialisation/Integration” (ISI) pathway (Figure 1(c),(e)). Smallholders taking this pathway are willing to invest in productive plots with high input levels in order to keep increasing their palm oil income and re-invest in the same sector. Both human and social assets are oriented towards palm oil activities. Palm oil related activities – outside direct involvement in production – are
considered to support specialisation strategies, notably when working for the cooperative or as head of smallholder’s group. In our sample, smallholders taking ISI pathway had a high return on investment. Besides, we defined another strategic pathway, which is characterised
7
This point has to be taken carefully since this influence could be less in areas with a lower influence of NES scheme. So in a methodological perspective, we need to keep our questionnaire as such to be able to capture diversification whenever useful (in areas with lower NES influence)
8
10
by mainly independent plots acquisition, the “Extensification/Diversification/Autonomy (EDA) pathway (Figure 1(a),(d),(f)). In this pathway, the pace of plot acquisition may be more or less rapid. The strategy is first to secure natural capital through land acquisition, and then to increase progressively physical capital through oil palm planting according to
available financial assets. The increase in physical capital will depend on the initial situation. Some smallholders may benefit from initial plasma incomes (Figure 1(a)), others may rely on other financial assets from previous activities (Figure 1(d),(f)). In both cases, the choice of independent plot can be correlated with the willingness to manage in autonomy their assets. In particular, smallholders have more freedom in terms of practices in the management of their independent plots. Diversification of activities beyond the palm oil sector also tended to underpin a willingness to reach more autonomy. Diversification and Specialisation may be intertwined pathways along the holding evolution. For instance, the oil palm specialised holdings may want to diversify their income sources out of direct oil palm production after experiencing a price crisis or being too old to work as a harvester.
Even if we were not able (due to data limitation) to provide for each surveyed
household/holding a combination of the specific strategies (Intensification, Specialisation and Integration [ISI] or Extensification, Diversification, and Autonomy [EDA]), it was possible to do so on a more generic level gathering these different combinations under two main
orientations towards either more profitability or more flexibility (Figure 2). These terms were inspired by Darnoffer et al. (2010) who highlighted the importance of flexibility to ensure capacities to adapt to changes in the environment. However, flexibility often requires using certain resources in a less efficient way which creates a trade-off between flexibility and profitability. This enabled us to emphasise the objectives of the holdings, and to look at smallholders’ strategies to achieve their goals. An orientation for ‘more profitability’ could mean more investment in plasma plots through an ISI type pathway. On the other side, an orientation for ‘more flexibility’ may imply investment outside the NES and a search for diversification in activities through an EDA type pathway, including non-farm activities. The smallholder may therefore aim at improving equilibrium and circulation between his various objectives, both domestic and productive, and the expected outputs of the activity system. Figure 2 combines the discriminating strategic pathways previously discussed and the
orientations of the holdings. We organised the smallholders in an evolutionary representation, depending on which orientation they may follow or may have followed. In this
representation, we considered that smaller holdings were the past of bigger ones; and bigger holdings were a potential future for smaller ones. Although these evolutions are hypothetical and the evolution of a specific holding is not carved in stone, this representation allows for identifying milestones in the development of a holding according to the strategic pathways taken. These milestones may be intermediary steps or final stages. As they are characterised by a combination of specific strategic behaviours and relative accumulation paces of various plantation areas, these milestones helped us to anticipate some preliminary typology of the holdings. We present a snap shot view of the typology with the current positions of our sampled holdings according to two axes which represent the oil palm production areas under plasma (ordinates) and independent (abscises) (Figure 3). Combining the information layers from Figures 2 and 3 allowed us to converge towards consistent types of smallholders. This preliminary typology of the holdings based on our current sample consisted of 5 types: “Large holdings”, “Medium ISI holdings”, “Medium EDA holdings”, “Young specialising holdings”, and “Mixed holdings” (Figure 3). “Large holdings” gathered Large independent and Large mixed smallholders identified in Figure 2. These holdings presented similarities in
11
their assets and are characterised by a dominancy of independent plots following an
orientation towards flexibility. In Figure 3, they could be furthermore strongly distinguished from the other types by the scale gap in total area. Regarding medium sized holdings
(between 4 and 12 ha of oil palm surface), we could distinguish between those that followed ISI or EDA pathways, i.e. “Medium ISI holdings”, “Medium EDA holdings”. These two types were either mostly plasma smallholders or mostly independent ones, respectively. Compared to Figure 2, we aggregated into “Medium EDA holdings”, Medium independent only and Medium plasma/independent because those two likely followed EDA pathways. Finally, looking at the smaller holdings, one important factor in common was their reliance mostly on exclusive family labour, whereas all the others mobilised a variable but structural amount of hired labour. Within this holding type, uncertainties were great though. These uncertainties were due to scarcer data and some young smallholders, whose strategies may not be yet settled. However, two types could be delineated. The first type consisted in
“Young specialising” independent smallholders. These ones could not have access to plasma through NES scheme. They relied totally on palm oil activities, combining income from own production on small areas and from labour on others’ palm plots. The last type gathering small holdings with plasma only or both plasma and independent plots was more
heterogeneous in terms of strategic orientations. We found some of them oriented towards ISI and other towards EDA. It was hence called “Mixed holdings”.
12
Figure 2: Representation of the potential strategic pathways taken or to be taken by the
holdings NB: The radars represent the level of the usual five assets defined in the SRL framework; the
further away from the centre the mark is on the radar, the higher the level of the defined asset is (see for each colour corresponding to an asset). Each number positions one household/holding surveyed
Figure 3: Representation of the different groups of holdings based on oil palm surfaces and potential strategies
13
As a conclusion, we were first able, through the analysis of the evolution of holdings’ areas, to identify original trajectories (Figure 1). It emphasised the strategic nature of
plasma/independent combination and the necessity of classifying holdings beyond life cycle and size assessments. Further understanding of holdings’ pasts and perspectives and
complementary activities (both palm oil related and non-palm oil) enabled the identification in Figure 2 of two generic orientations: more flexibility or more profitability combining various strategic pathways such as ISI or EDA. These evolutions were associated with a certain initial level of assets and led to further asset combinations. Figure 3 crystallised holding types according to a combination of sizes, ages and strategic pathways.
Structural indicators to delineate the type of holding
Based on the proposed typology of holdings accounting for both their starting points and strategic evolutions, we defined a set of structural indicators in order to discriminate between holding types (Table 2). These indicators may enable to classify and analyse holdings
wherever data to carry out a complete analysis of their trajectories is not available. These indicators are not stand alone and some may provide important insight on the understanding of the holding dynamics (constraints, capacities, risks, etc.) without being independently discriminating regarding the holding type. This is notably the case for some of the plot characteristics (such as peat or mineral) which may not be directly discriminating between two holding types but which may explain differences within a holding type in terms of performances and assets. Indeed, we were able to relate a certain combination of assets per type of holdings, assessing the capacities of the production system.
Strong threshold values for the diverse indicators could not be provided at this stage of the project due to insufficient data to carry out significant statistical tests. However, some insight may be given through the following examples (Table 2). The threshold values may have to be updated according to specific contexts, notably area criteria will be highly correlated to the land use availability in various countries. As well the dates of planting and the possibility to get involved in organised production schemes such as NES are very site-specific.
14 Table 2: Structural indicators
Structural indicators Large holdings Medium ISI holdings Medium EDA holdings Young specialising holdings Mixed holdings H ol di n g
Total OP planted area >= 25 ha 6-12 ha 6-12 ha <= 4 ha 2-4.5 ha Plasma area (ha) >= 12ha >= 4 ha <=2 ha 0 ha <=4 ha % of contractual production 0-53 (23) 48-100 (92) 0-44 (22) 0 62-100 (92) % of peat surface 0-46 (12) 21-86 (21) 0-100 (50) 0-100 (42) 0-100 (51) Average age of the trees
in years 4- 16 (9) 6-21 (14) 10-19 (13) 3-9 (6) 9-21 (17) OP starting year 1987-2002 1987-2001 1994-2001 1996-2008 1990-2005 Type of OP expansion Plasma or
independent
Plasma Plasma or independent
Independent Plasma or independent Importance of farm and
off-farm diversification
Medium to high
Low to medium
Low to high Medium to high None to medium % of OP income/ total income Almost 100 80-100 (83) 76-100 (92) 10-75 (37) 72-100 (81) % of debts reimbursement/annual income 4-26 (9) 0-86 (30) 0-31 (10) 0-6 (1) 0-35
% of non active people 20-67 (45) 25-75 (60) 0-60 (28) 0-50 (35) 33-60 (50) Size of the household
(depending on household’s income) 3-6 (4.75) 3-7 (4) 2-5 (3.25) 3-6 (4) 3-5 (4) Age of the head of the
holding 38-53 (47) 37-54 (44) 40-63 (52.25) 36-57 (39) 35-54 (47) Dominant type of labor Hired Hired Hired Family Family and
Hired
Level of assets
15
Assessing the 3D-performances of the various smallholders’ systems
Selected indicators of performanceIn order to answer the question whether the diversity in production systems is correlated with different economic, social and environmental performances, we designed a set of
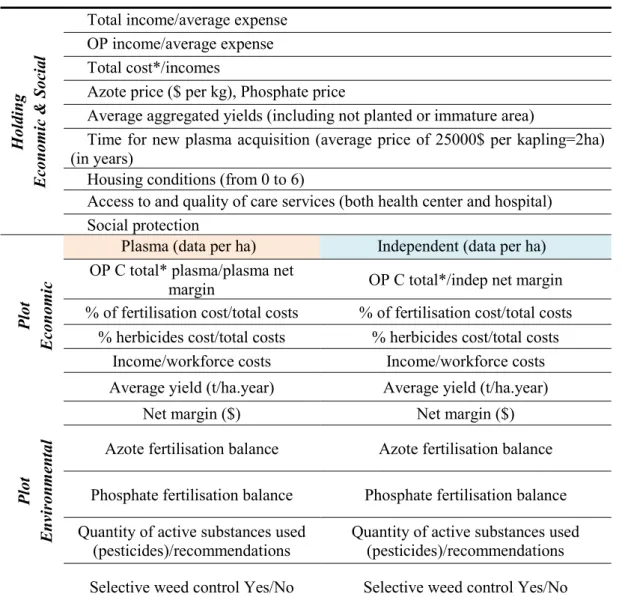
performance indicators relevant to our set of data. It combines both household level and plot level to be more accurate regarding the potential differences between plot performances within a given holding type. These indicators try to assess both the efficiency and the effectiveness of the system. Effectiveness refers to the capacity of meeting the goals, here is to cover the expenses of the family and ensure the exploitation survival. Efficiency refers to the adaptation of the means used towards reaching these goals; for example the income gained from the inputs expenses (Rastoin and Ghersi, 2010). We considered how households’ needs were covered, whether by oil palm only or through complementary activities, how the production costs were managed and the result of the whole system in terms of income, living conditions and environmental impacts. Many economic indicators focused on the return on investment of the various expenses: land, fertilisers, herbicides, and workforce. The various indicators of performance that were applied to each type of holding are listed in Table 3. The data were sometimes incomplete for the construction of the environmental indicators and improvements could be made through the evaluation of the plot needs in nutrients as a
reference. We focused the analysis on two main nutrients, nitrogen and phosphate, the first one being known for its influence on yields and several environmental impact categories (climate change, eutrophication, etc.) and the second for its potential scarcity in soils. Social indicators were evaluated through living conditions (housing), access and quality of health care and the access to social protection.
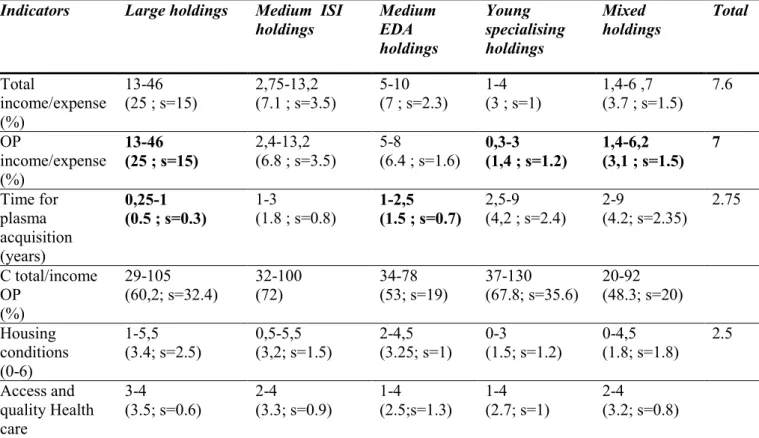
16 Table 3: Indicators of holding’s 3D performances
H ol di n g E con om ic & S oc ia l
Total income/average expense OP income/average expense Total cost*/incomes
Azote price ($ per kg), Phosphate price
Average aggregated yields (including not planted or immature area)
Time for new plasma acquisition (average price of 25000$ per kapling=2ha) (in years)
Housing conditions (from 0 to 6)
Access to and quality of care services (both health center and hospital) Social protection
Plasma (data per ha) Independent (data per ha)
Pl o t E con om ic
OP C total* plasma/plasma net
margin OP C total*/indep net margin
% of fertilisation cost/total costs % of fertilisation cost/total costs % herbicides cost/total costs % herbicides cost/total costs
Income/workforce costs Income/workforce costs Average yield (t/ha.year) Average yield (t/ha.year)
Net margin ($) Net margin ($)
Pl o t E n vi ro n m en ta l
Azote fertilisation balance Azote fertilisation balance Phosphate fertilisation balance Phosphate fertilisation balance Quantity of active substances used
(pesticides)/recommendations
Quantity of active substances used (pesticides)/recommendations Selective weed control Yes/No Selective weed control Yes/No
*Total costs include inputs costs, workforce costs, weighing and transportation costs and other costs relative to
KUD functioning (for plasma only). OP: Oil Palm Observations for each holding type
Despite the small number of smallholders per group of holdings, we tried our set of indictors on our sample. The main results are presented in Tables 4, 5 and 6. Not all the indicators could be calculated due to some incomplete data sets.
Table 4 provides indicator scores on the contribution of oil palm income to cover livelihood needs and allow for holding expansion. In our sample, the conditions of housing and the capacity to cover expenses and expand in plasma are significantly correlated with wider surfaces of cumulated oil palm plantations. One interesting result was the fact that Young specialising holdings may not cover their expenses with oil palm production alone, thus complementing with other palm oil related activities. These holdings had significantly poorer housing conditions than ISI and EDA holdings, mainly wood houses with lack of basics facilities. However no significant differences were found regarding the importance of costs
17
on income, which may be due to homogeneous practices on plasma and lack of data on independent plots.
Table 4: Indicator scores for the socio-economic performances of the holdings differentiated in our case study (averages)
Indicators Large holdings Medium ISI
holdings Medium EDA holdings Young specialising holdings Mixed holdings Total Total income/expense (%) 13-46 (25 ; s=15) 2,75-13,2 (7.1 ; s=3.5) 5-10 (7 ; s=2.3) 1-4 (3 ; s=1) 1,4-6 ,7 (3.7 ; s=1.5) 7.6 OP income/expense (%) 13-46 (25 ; s=15) 2,4-13,2 (6.8 ; s=3.5) 5-8 (6.4 ; s=1.6) 0,3-3 (1,4 ; s=1.2) 1,4-6,2 (3,1 ; s=1.5) 7 Time for plasma acquisition (years) 0,25-1 (0.5 ; s=0.3) 1-3 (1.8 ; s=0.8) 1-2,5 (1.5 ; s=0.7) 2,5-9 (4,2 ; s=2.4) 2-9 (4.2; s=2.35) 2.75 C total/income OP (%) 29-105 (60,2; s=32.4) 32-100 (72) 34-78 (53; s=19) 37-130 (67.8; s=35.6) 20-92 (48.3; s=20) Housing conditions (0-6) 1-5,5 (3.4; s=2.5) 0,5-5,5 (3,2; s=1.5) 2-4,5 (3.25; s=1) 0-3 (1.5; s=1.2) 0-4,5 (1.8; s=1.8) 2.5 Access and quality Health care 3-4 (3.5; s=0.6) 2-4 (3.3; s=0.9) 1-4 (2.5;s=1.3) 1-4 (2.7; s=1) 2-4 (3.2; s=0.8) In bold: significant data, Student test (risk at 5%); OP: Oil Palm
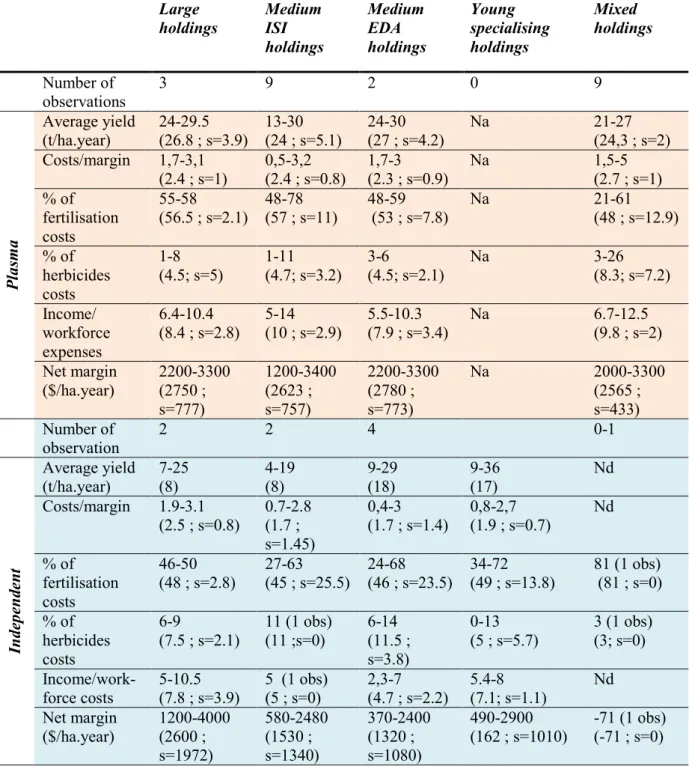
Table 5 illustrates the variations of performances between plasma plots and independent ones among the identified types of holdings. Regarding plasma economic efficiency, the highest margins were achieved by the large holdings while small holdings seemed to have lower margins. There was little difference among the holdings on the structure of costs and their returns on investment, this can be explained by the fact that plasma management is usually very specific and homogenised, and some smallholders may not even work on their plots. The results regarding independent plots were more heterogeneous, notably due to more missing data. Margin and yields were however lower in our sample for independent plots of ISI and EDA compared to their plasma results. There was no difference in our sample in the returns on investment of production costs (ratio cost/income). Mixed holdings tended to have least efficient practices, which could be due either to our approximation or the fact that garden plantations were less intensively (or actively) managed. On the contrary, young specialising holdings seemed to have reached a certain level of efficiency with satisfying margin for non-selected vegetal material. Indeed, it is interesting to notice that there were little differences between young independent cost efficiency and cost efficiency on plasma plots from the other groups.
18
Table 5: Indicator scores for the technico-economic performances of the holdings at the plot level (averages) Large holdings Medium ISI holdings Medium EDA holdings Young specialising holdings Mixed holdings Number of observations 3 9 2 0 9 P la sma Average yield (t/ha.year) 24-29.5 (26.8 ; s=3.9) 13-30 (24 ; s=5.1) 24-30 (27 ; s=4.2) Na 21-27 (24,3 ; s=2) Costs/margin 1,7-3,1 (2.4 ; s=1) 0,5-3,2 (2.4 ; s=0.8) 1,7-3 (2.3 ; s=0.9) Na 1,5-5 (2.7 ; s=1) % of fertilisation costs 55-58 (56.5 ; s=2.1) 48-78 (57 ; s=11) 48-59 (53 ; s=7.8) Na 21-61 (48 ; s=12.9) % of herbicides costs 1-8 (4.5; s=5) 1-11 (4.7; s=3.2) 3-6 (4.5; s=2.1) Na 3-26 (8.3; s=7.2) Income/ workforce expenses 6.4-10.4 (8.4 ; s=2.8) 5-14 (10 ; s=2.9) 5.5-10.3 (7.9 ; s=3.4) Na 6.7-12.5 (9.8 ; s=2) Net margin ($/ha.year) 2200-3300 (2750 ; s=777) 1200-3400 (2623 ; s=757) 2200-3300 (2780 ; s=773) Na 2000-3300 (2565 ; s=433) Number of observation 2 2 4 0-1 In d ep en d en t Average yield (t/ha.year) 7-25 (8) 4-19 (8) 9-29 (18) 9-36 (17) Nd Costs/margin 1.9-3.1 (2.5 ; s=0.8) 0.7-2.8 (1.7 ; s=1.45) 0,4-3 (1.7 ; s=1.4) 0,8-2,7 (1.9 ; s=0.7) Nd % of fertilisation costs 46-50 (48 ; s=2.8) 27-63 (45 ; s=25.5) 24-68 (46 ; s=23.5) 34-72 (49 ; s=13.8) 81 (1 obs) (81 ; s=0) % of herbicides costs 6-9 (7.5 ; s=2.1) 11 (1 obs) (11 ;s=0) 6-14 (11.5 ; s=3.8) 0-13 (5 ; s=5.7) 3 (1 obs) (3; s=0) Income/work-force costs 5-10.5 (7.8 ; s=3.9) 5 (1 obs) (5 ; s=0) 2,3-7 (4.7 ; s=2.2) 5.4-8 (7.1; s=1.1) Nd Net margin ($/ha.year) 1200-4000 (2600 ; s=1972) 580-2480 (1530 ; s=1340) 370-2400 (1320 ; s=1080) 490-2900 (162 ; s=1010) -71 (1 obs) (-71 ; s=0)
No significant distinctions were detected between holding groups in terms of plasma and independent environmental performances. However, results regarding environmental
performances (Table 6) seemed to indicate better nutrient management on plasma plots than on independent ones, which may be explained by either a better access to inputs and/or advices or more available cash. As a consequence, holdings mainly based on plasma plots tended to perform better for nutrients balance in our sample (balance based on
recommendations per palm tree of the amount of nutrient to be applied, regardless on when and how, from Fairhurst and Härdter (2003). It also seems that there is a wider gap between groups on phosphate balance, the more accurate practices being those of the ISI holdings.
19
This observation can also be made for independent plots of holdings relying mainly on independent production (EDA and young specialising) where herbicides quantities were the highest compared to official recommendations (Pers com, Levang, 2013). These results may be partly explained by the high share of plots on peat lands, usually requiring more pests’ management.
Table 6: Indicator scores for the environmental performances of the holdings at the plot level (averages) Large holdings Medium ISI holdings Medium EDA holdings Young specialising holdings Mixed holdings Number of observations 3 9 0 9 P la sma Nitrogen fertilisation balance 1-1.3 (1.2 ; s=0.2) 0,2- 2 (0.9 ; s=0.5) 0,9-1 (0.95 ; s=0.1) na 0.4-1.5 (0.9 ; s=0.35) Phosphate fertilisation balance 0,7-1 (0.8 ; s=0.2) 0,4-2,8 (0.9 ; s=0.7) 0,5-0.8 (0.7 ; s=0.2) na 0,1-1 (0.7 ; s=0.35) Quantity of paraquat substance/ recommandations 0,5-0.9 (0.7 ; s=0.3) 0,7-5 (2.3 ; s=2) 1-1.3 (1.2 ; s=0.2) na 0.9-5 (3; s=1.6) Selective weed control 50% Yes
50% No
83% Yes 17% No
100% Yes na 86% Yes
14% No
Number of observations 1-2 1 1-4 obs 6 1 obs
In d ep en d en t Nitrogen fertilisation balance 0,7 (1 obs) (0.7 ; s=0) 0,2 (0.2 ; s=0) 0.9 (0.9 ; s=0) 0-1.4 (0.7; s=0.5) 1.3 (1.3 ; s=0) Phosphate fertilisation balance 0.5 (1 obs) (0.5 ; s=0) 1 (1 ; s=0) 0.5 -0.7 (0.6 ; s=0.1) 0,1-1 (0.6; s=0.3) Na Quantity of PD substance/ recommandations 0.65 (0.65 ;s=0) 1.7 (1.7 ; s=0) 0.75-6 (2.4 ; s=2.4) 3.6-6,7 (5; s=1.5) 1.3 (1.3 ; s=0) Selective weed control 100% Yes 50% Yes
50% No 75% Yes 25% No 50% Yes 50% No 100% Yes
Conclusions on the typology and performances of the holdings
We have presented a typology that goes beyond the linear evolution of holding. We added an evolutionary and strategic dimension which should have an impact on holdings’
performances. This declination emphasised the diversity of holdings ‘organisation even though oil palm income seems to overweight all other income sources. Taking into account this margin of action regarding smallholders’ investment in oil palm, we identified two main orientations: EDA or ISI, although these may not be relevant for all stages of the holding (young ones being mostly specialising and facing many constraints). As a result, we suggested five types if holdings, which need further confirmation. To replicate our methodology and further describe each type, we suggested a set of structural indicators aiming at locating the holding within our typology and at better understanding its dynamics.
20
It seems that our set of indicators was relevant to evaluate the diversity of performances across types of holdings, despite the small sample and lacking data. With stronger results, it may enable the analysis of strengths and weaknesses of each type thus better understanding the holding dynamics.
DISCUSSIONS AND PERSPECTIVES
Achievements
In the study site in Riau province, where oil palm cultivation tends to standardise the landscape, overwhelm the local economy and polarise the households’ activity systems, we could identify a significant heterogeneity at holding and households’ levels. The choice of the study area was consistent in order to explore the diversity of the systems while having a long-term historical retrospective to try to analyse its origin. We may then further assume that this diversity will increase when reaching the margins of the companies’ influences or in regions where the oil palm development is more recent. But this would need to be further
investigated.
We identified a wide range of oil palm productive systems – ranging from 2 ha to 110 ha embedded in a diverse setting of activity systems. This highlights the social rapid
differentiation associated with the spread of income generation through oil palm production development. This, however, does not undermine potential unequal development and the huge gaps this rapid process of accumulation may induce.
In a first attempt to better understand the choices made by the smallholders, we proposed to distinguish a combination of rationales between “profitability” associated to plasma plots and flexibility associated to “independent” plots, which aims can be reached adopting various strategic pathways. The decision making for investing in an oil palm plantation will highly depend on the life cycle situation and the economic (income, savings) and institutional conditions (access to land, access to credit and technical package) that will orient towards plasma or independent plot.
This diversity of the production systems was the baseline assumption of the SPOP research project that aims to bring out this feature of the local production system in order to lay out a basis for an in-depth analysis linking structural characteristics and 3D performances. Our approach and tools were suitable to characterise the diversity of holdings and households’ activities and strategies. The questionnaire and survey guide were appropriate to identify the structural characteristics of the holdings and the activity system of the households. However, there is still room to reduce the size and length of the questionnaire and to improve its ergonomics in order to gain efficiency in implementation. At plot level, the structure of the questionnaire was also adequate. In this survey, we chose to limit data collection to two plots in the case of mixed production systems (plasma and independent) and sometimes it was not possible to get information on both plots due to time constraints or the unavailability of information.
To consolidate
The time constraint for field work and the choice to cover the diversity of systems led us to base our typology on a limited number of interviews and questionnaires. By spotlighting the
21
diversity of situations and the more consolidated holdings, we certainly underestimate the bulk of real smallholders below 4 ha for instance. Moreover, some missing data in the surveys prevented us from strengthening our analysis (in precision and statistical validation) and the suggested typology does require further validation through a wider set of holdings. Therefore we would need to increase the number of holdings in our sample and complete the data to strengthen the typology and characterise the trajectories. In order to be efficient and optimise the work on primary data, our sample would need to match with a statistical coverage of the area. This complementary work would enable better knowledge of the structural differentiation in oil palm production.
This differentiation process needs to be better understood to identify the set of constraints and opportunities that orient smallholders towards such differentiated trajectories. More insight on the perceptions and projections of the smallholders regarding their practices, associated constraints, risks or opportunities also is crucial. To do so, qualitative analyses based on a comprehensive approach bringing into the picture life cycles, evolution of assets and subsequent evolutions of holding strategies are needed. This must be deepened on a limited number of “robust” trajectories9 (as we started in this preliminary work).
The collection of more accurate information at the plot level would necessitate a permanent survey mechanism on a limited number of holdings in order to document the practices within a given type of productive structure. This would allow for testing the robustness of the relation between the type of structure and the type of performances based on the relevant indicators identified here.
This combination (identification of a limited number of trajectories and linkage with a permanent plot survey) would provide useful results for smallholders to improve their knowledge on the efficiency and adapt both their strategies and agricultural practices.
ACKNOWLEDGEMENTS
The authors want to thank the French National Research Agency (ANR) which supports the SPOP project (http://spop.cirad.fr/) within the frame of the Agrobiosphere programme. They are also very grateful to PT SMART and Cifor Indonesia for helping with the field work logistics.
9
By « robust trajectories » we mean a limited number of types of trajectories that would be valid for a large number of holdings represented by a reduced core set of structural indicators as identified in this paper.
22
REFERENCES
Bosc, P.-M., Bélières J.-F., George H., Loyat J. and Even M.-A. (2012) Agricultural
transformations: Their diversity and the challenges they pose. Communication at the 10th European IFSA Symposium, July 1-4, 2012 Aarhus, Denmark.
Chambers R. and Conway G. (1992) Sustainable rural livelihoods: practical concepts for the 21st century. Vol 296. Brighton, UK.
Colchester, M., Norman Jiwan, Andiko, Martua Sirait, Asep Yunan Firdaus, A. Surambo, et Herbert Pane (2006) Palm Oil and land Acquisition in Indonesia: Implications for Local Communities and Indigenous Peoples. Forest Peoples Programme, Sawit Watch.
Darnhofer, Ika, Stéphane Bellon, Benoît Dedieu, and Rebecka Milestad (2010) “Adaptiveness to Enhance the Sustainability of Farming Systems. A Review.” Agronomy for Sustainable Development 30 (3): 545–55. doi:10.1051/agro/2009053. Duryat (2011) « dynamic of Plantation and Yield Analysis in oil Palm Smallholdings ».
Mémoire d’ingénieur de Supagro, Montpellier.
Fairhurst, T.H, and Härdter,R. (2003) “Oil palm: Management for Large and Sustainable Yields” PPIC, IPI
FAO (2012) World Agriculture Watch. Methodological Framework. Summary Version 2.6. Rome. FAO. April 2012, 60 p.
Feintrenie, Laurène, Wan Kian Chong, and Patrice Levang (2010) « Why do Farmers Prefer Oil Palm? Lessons Learnt from Bungo District, Indonesia ». Small-scale Forestry 9 (3) (juillet 1): 379‑396. doi:10.1007/s11842-010-9122-2.
Fine B. (2010) Social Capital: The World Bank fungible friend. Journal of agrarian change, 3 (4): 586-603
Lé Karine (2013) “Analysis of Smallholders oil palm production Systems”, Kampar district Indonesia. Mémoire
McCarthy, John F., Piers Gillespie, and Zahari Zen (2010) « Swimming Upstream: Local Indonesian Production Networks in “Globalized” Palm Oil Production ». World Development 40 (3) (mars): 555-569. doi:10.1016/j.worlddev.2011.07.012.
Pesche D. (2004) Le « capital social » est-il capital ? Synthèse bibliographique, Note interne Cirad, Septembre 2004, 6 pages.
Rastoin J.-L. and Ghersi G. (2010) Le système alimentaire mondial. Concepts et méthodes, analyses et dynamiques. Paris, Quae, 565 p.
Ravanera Z. R., Rajulton F. (2010) Measuring Social Capital and Its Differentials by Family Structures. Soc Indic Res, 95: 63-89.
23
Ruf F. Taher S, and Yoddang (2004) Replanting coffee farms in Southern Sumatra. In: From Slash and burn to replanting. Green Revolution in the Indonesian Uplands, F. Ruf and F. Lançon (Eds).
Ruf, F., Schroth, G. (2012) Enjeux économiques et écologiques de la diversification. Collection Update Sciences & technologies, Quae, Paris, 312 pages.
Scoones (2009) Livelihoods perspectives and rural development. Journal of Peasant Studies, 36 (1) : 171-196
Yung J;-M., Zaslavski J. (1992) Pour une prise en compte des stratégies des producteurs. Cirad, Montpellier Collection DSA, n°19