HAL Id: halshs-01965653
https://halshs.archives-ouvertes.fr/halshs-01965653
Submitted on 26 Dec 2018HAL is a multi-disciplinary open access archive for the deposit and dissemination of sci-entific research documents, whether they are pub-lished or not. The documents may come from teaching and research institutions in France or abroad, or from public or private research centers.
L’archive ouverte pluridisciplinaire HAL, est destinée au dépôt et à la diffusion de documents scientifiques de niveau recherche, publiés ou non, émanant des établissements d’enseignement et de recherche français ou étrangers, des laboratoires publics ou privés.
Impact of Decentralized Electrification Projects on
Sustainable Development: A Meta-Analysis
Jean-Claude Berthélemy, Arnaud Millien
To cite this version:
Jean-Claude Berthélemy, Arnaud Millien. Impact of Decentralized Electrification Projects on Sus-tainable Development: A Meta-Analysis. 2018. �halshs-01965653�
Documents de Travail du
Centre d’Economie de la Sorbonne
Impact of Decentralized Electrification Projects on
Sustainable Development: A Meta-Analysis
Jean-Claude B
ERTHELEMY, Arnaud M
ILLIENImpact of Decentralized Electrification Projects on Sustainable
Development: A Meta-Analysis
Jean-Claude Berthelemy, Professor at Paris 1 University Pantheon-Sorbonne, Centre d’Economie de la Sorbonne (CES), Programme Director at FERDI - France. Email: [email protected]
Arnaud Millien, PhD candidate at Paris 1 University Panthéon-Sorbonne, Centre d’Economie de la Sorbonne (CES), consultant at FERDI - France. Email: [email protected]
19 december 2018.
Abstract
This paper is the first product of a project which aims at building a Collaborative Smart Mapping of Mini-grid Action (CoSMMA), whose principal objective is to identify best practices of decentralized electrification projects.
Using evaluations of 421 projects, from published research papers, we built a pilot CoSMMA which proves its feasibility. Its relevance is demonstrated by a meta-analysis, which reveals the principal characteristics of decentralized electrification projects which have positive impacts on sustainable development.
Four main characteristics were considered: technology (source or energy), system size (power), decision level (from local to country level), geographic location. When searching for best practices, technology and system size must be considered together, because the chosen technology may constrain the power, which is provided by the system. We find that the most popular projects, which are based on Solar Home Systems (SHS) are not the most effective. The problem with SHS is not the use of solar energy, but the small system size often chosen for SHS. Mini-grids, of larger size, especially those which use hybrid renewable sources of energy, have more positive impacts, because these systems combine the benefits of sustainability and flexibility. In terms of decision level, we find that both top-down and bottom-up approaches have advantages, with the observation of a U-shaped curve for the influence of the decision level on the probability of obtaining positive impacts. Geographical location matters, as it is very often the key to system feasibility. We find that DEPs are more effective in Latin America than in Asia, and more effective in Asia than in Africa.
We also attempted to study the type of effects resulting from DEPs. Descriptive data suggest that for some types of effects, positive impacts are more likely than for others. Decentralized electrification projects have a more positive impact on Lifestyle & NICT or Household agenda than on Economic transformation or Community life. However, this pilot CoSMMA does not contain
enough information to study precisely the types of effects, because some types of effects have not been studied frequently in the existing literature. This is the case, for instance, for environmental effects, which have been rarely measured scientifically.
Finally, we attempted to broaden our information set by including expert data, which was entered into the CoSMMA meta-analysis. We define expert data as data that are not supported by statistical tests with measures of significance, whereas the evaluations based on scientific data were supported by statistical tests of significance. The expert data may be valid, but our attempt to include it in the analysis failed at this stage. The determinants of unproven effects appear to be quite different from the determinants of proven effects in our meta-analysis, and using expert data would imply merging proven and unproven effects, which would totally blur the conclusions.
Acknowledgments
The authors thank Thomas André, Christophe Angely, Rémi Bazillier, Jean-Bernard Châtelain and Josselin Thuilliez for useful comments and discussions on this project; Fatou Cisse for her key support for data collection and data quality control; Olivier Santoni for his expertise dealing with geographical data. Both authors gratefully acknowledge support from Fondation pour les Etudes et Recherches sur le Développement International (Ferdi) and the French National Research Agency under program ANR-10-LABX-14-01.
JEL : L93, O13, O18, O22
Keywords :
Decentralized electrification, sustainable development, impact assessment, meta-analysis.Table of contents
Abstract ... 1 Acknowledgments ... 3 Table of contents ... 3 List of Tables ... 5 List of figures ... 5 List of Annexes ... 51. Introduction: The CoSMMA project ... 6
2. Research question and literature review ... 7
2.1. Definition of DEPs ... 7
2.2. The need to identify best practice of DEPs ... 7
2.3. The potential contribution of a meta-analysis ... 8
2.4. Previous mapping of DEP effects ... 8
2.5. Previous meta-analyses ... 10
3. Sources of data ... 13
3.1. Methods used to build the CoSMMA ... 13
3.2. Descriptive statistics ... 17
4. Methodology for a meta-analysis of DEP impacts ... 18
4.1. Objects of the meta-analysis ... 18
4.2. Source of heterogeneity across control variables ... 19
4.3. Specification and estimation strategy ... 20
5. Which characteristics of electricity projects yield positive impacts on sustainable development? 22
5.1. Role of source of energy ... 22
5.2. Role of system size ... 24
5.3. Role of project decision level ...25
5.4. Role of location ...25
5.5. Significant pairs of size and technology ... 26
5.6. Factors of success by type of effects ... 28
5.7. Extending knowledge of effects with expert data ... 31
6. Discussion ... 33
6.1. Possible selection bias ... 33
6.2. Cycle between funding and evaluation ... 34
7. Concluding remarks ... 34
References ... 36
List of Tables
Table 1 - Previous studies adressing a mapping of the socio-economic effects of electricity ... 10
Table 2 - Review of literature or meta-analysis about electricity economics (as of Oct 12th 2018) ... 12
Table 3 – Listed studies in electricity economics (as of 12th Oct 2018) ... 13
Table 4 - Project inclusion criteria ... 15
Table 5 - Scientific vs. Expert data ... 19
Table 6 – Effectiveness characteristics of DEPs - Average Marginal Effects (AME) ... 23
Table 7 – AME of impacts - Highest Significant Pairwise Comparisons ... 27
Table 8 - Distribution of effects by type (scientific data) ... 28
Table 9 - Distribution of impacts by effect type (scientific data) ... 28
Table 10 - AME - Impacts - scientific data - separated regressions by subset of Effect Type ... 29
Table 11 - AME- with expert data (N >= 0) ... 32
List of figures
Figure 1 - Number of papers by publication period (4 years) ... 14Figure 2 Map of DEPs registered in CoSMMA ...17
List of Annexes
Annex 1 - Methods used by research to evaluate DEP effects ... 38Annex 2 Distribution of scientific data ... 39
Annex 3 - Distribution of effects by direction and significance of effects ... 40
Annex 4 – Distribution of subsets of positive impacts ... 41
1. Introduction
:
The CoSMMA project
Decentralized Electrification Projects (DEPs) are booming in developing countries as a response to the deficiencies of on-grid electrification in many parts of the developing world, particularly in rural areas, and due to the new possibilities offered by technological progress in renewable sources of energy. This process potentially has a lot of promise for sustainable development in developing countries, but it may be curbed by a lack of visibility of what works and what does not work, which may in turn become an obstacle to financing such projects.
This paper is part of a project to build a collaborative database on decentralized electrification, named CoSMMA (Collaborative Smart Mapping of Mini-grid Action), with the objective of identifying best practice from the point of view of sustainable development (i.e. to identify the project characteristics that maximize positive impacts on sustainable development).
To this end, DEPs are described in the CoSMMA in several dimensions:
Basic technical characteristics of the project, such as the energy source and system size (electrical power)
Project goal and expected impact Ex-post evaluated effects
Additional types of information include conditions of evaluation and document sources.
At the current stage of our project, we have built a pilot CoSMMA, with the objective of testing its feasibility and proving its relevance. We used information on 421 DEPs available in published research papers, which we analyzed and coded into variables describing the projects and their effects. This information was gathered by a structured search from 4 principal academic sources - Academic Search Premier, Business Source Complete, EconLit, and GreenFILE. The information was then processed through a meta-analysis regression, whose results shape the core of this paper. Our principal tool is a multi-probit meta-regression, which shows which factors led to which effects of DEPs on sustainable development. We also attempt to break down the analysis by type of effect, but at this stage the available information limits our analysis. Only a few types of effect of DEPs have been sufficiently explored in the papers registered in the CoSMMA to allow uncovering their specific determinants. Finally, we attempted to enlarge the data base used in the meta-regression by including so-called expert data (i.e. evaluations provided by experts but not supported by statistical tests of validity). However, we were unsuccessful in this attempt, because statistically proven effects and unproven effects appear to have quite different determinants.
In section 2, we develop in more detail our research question and relate it to the existing literature. In section 3 we document our sources of data and methods used to build the CoSMMA and we report descriptive statistics on project characteristics and project effects registered in the CoSMMA.
In section 4, we describe the econometric methodology used to perform our meta-analysis. In section 5, we discuss our empirical results and their possible extensions. Section 6 is devoted to a discussion of the possible bias that could affect our results, section 7 concludes and proposes some possible areas for further research.
2. Research question and literature review
2.1. Definition of DEPsDefining decentralized electrification is not simple, because many field practitioners and scientists refer to decentralized project as an obvious notion, although to the best of our knowledge, no clear criteria has been established so far.
CoSMMA is limited to off-grid or individual solutions, with no connection to the national grid. Our definition also includes a size limitation: any project above 100 MW is not considered as decentralized, because it could be involved in clearing price exchanges (Dillig et al, 2016) .
2.2. The need to identify best practice of DEPs
A variety of DEP projects have been implemented and evaluated so far, with a focus on solar nano solutions, the so-called SHS (Solar Home Systems). This focus comes from a convergence of interest between funders and developers, as they offer a low-commitment solution for the funder, and a low-cost market test for the developer. This focus does not imply that SHS represent the best practice in terms of positive impact on sustainable development. Institutions working in the sector frequently face the reality of economic or technical failures (Ikejemba et al, 2017). Failures are also repeatedly reported by NGOs promoting DEPs, with estimates of failure rates of project commonly being above one third. Clarifying the question of DEP performance and identifying best practice is thus important.
The development of DEPs faces three major challenges:
Because projects are not connected to the grid, they show a large heterogeneity of economic and technical design
So far, no unified framework of knowledge and data on DEPs can offer a complete vision on the variety of field experiments, and qualify their ability to yield sustainable favorable impacts
There is no clear consensus on the types of effects that matter and the primary types of impacts that a DEP should address first
In this study, "best practice" is defined as the project characteristics that produce significant favorable effects on sustainable development. Significant favorable effects are also called "positive impacts" in this study.
2.3. The potential contribution of a meta-analysis
Identifying best practice in DEPs requires an innovative methodology, because the focus on energy in Sustainable Development Goals (SDGs) is recent. Few DEPs have been assessed in a rigorous evaluation framework, although many observations of DEP effects are available in other areas of research. Using these observations is complex given their heterogeneity, however it can provide an approach to delivering an early assessment of DEP strategic choices.
A meta-analysis adds to the understanding of a phenomena by combining results obtained by researchers using a variety of data and methods (Stanley, 2001). In conducting a meta-analysis with published results for DEP effects, we expect, like Carré et al (2015), to have more robust conclusions than a mere review of separate regressions. Using a systematic selection from research databases, a meta-analysis avoids the classic pitfalls of a literature review, which could be unbalanced due to selection bias, or reflect the beliefs of authors who might tend to reject papers that run against their convictions (Stanley, 2001).
To the best of our knowledge, this study is the first meta-analysis which attempts to relate DEP characteristics to their impact on sustainable development, and hence which addresses clearly the question of best practice in decentralized electrification.
In order to base our contribution on previous literature, we review below two branches of research: first we consider what has been proposed so far in terms of mapping DEP effects. Second, we analyze the methodological references for meta-analysis.
2.4. Previous mapping of DEP effects
To the best of our knowledge, there is no previous study which proposes a complete mapping of DEP effects in developing countries. Several studies have been done with more specific research questions, as shown in Table 1. The CoSMMA offers an original contribution, mapping a wide scope of DEP effects in developing countries with observed data.
Special attention must be paid to SE4ALL (2017) and Katre and Tozzi (2018).
SE4ALL (2017), Why wait?, was the first study to assess the effects of access to electricity appliances in developing countries on SDGs, using the multi-tier framework defined by ESMAP (2015). There was a similarity with our objectives, although CoSMMA covers more countries (69) and indicators (765). Furthermore, by considering DEP effects published by researchers, we evaluate DEP impacts without any preconceived assumption about which impact should be evaluated first or might be expected to arise initially. Effects in the CoSMMA were collected for 157 dimensions, grouped in 15 topics and 8 types.
Katre and Tozzi, (2018)propose a complete comprehensive scorecard for DEP evaluation, but do not use field data. Using observed or reported effects of DEPs, we are able to feed a large
comprehensive framework with effects of various dimensions, and gather observational or experimental data in a common database.1
1 Some data are experimental, yielded by evaluations of DEPs in a natural experiment (Randomized Control Trial) or in
Table 1 - Previous studies adressing a mapping of the socio-economic effects of electricity Reference Converging feature Differentiating feature
Kanagawa and Nakata (2008)
Socio-economic impact of access Macro study, no project
Hayn et al 2014) Socio-demographic factors In Europe
Bell et al (2015) Electricity effect on sociability 131 customers in United Kingdom Marszal-Pomianowska et al
(2016) 35 electrical appliances In Denmark. Looking at the impact of appliances on the system, not on socio-economic household behaviors
Thopil and Pouris (2015) Externalities on environment, health
and employment, in South Africa 1 country, 3 types of effects, 9 indicators Holtorf et al (2015) Consider success criteria of SHS Technology constrained (SHS only)
No data (a comprehensive framework) SE4ALL (2017) Quantify the access dividends
according to the multi-tier framework of appliances. Relate tiers of appliances and research on effects
3 countries (Bangladesh, Ethiopia, Kenya), 21 indicators
Katre and Tozzi, (2018) Build a scorecard relating tiers of appliances with dimensions of yielded effects.
No field data.
Calibration made with data from individual assessment by other researchers.
2.5. Previous meta-analyses
Frequently used in medical studies, meta-analyses were popularized in social science (Carré et al (., 2015), and were widely used as a quantitative method of research synthesis to calibrate structural models, examine patterns of publication bias, and explain differences in the results of individual studies (Frequently used in medical studies, meta-analyses were popularized in social science (Carré et al, 2015), and were widely used as a quantitative method of research synthesis to calibrate structural models, examine patterns of publication bias, and explain differences in the results of individual studies (http://meta-analysis.cz/).
In a seminal work, Stanley (2001) provides clear and comprehensive advice on the steps to follow and pitfalls to avoid, when conducing a meta-analysis that "employs conventional statistical methods and criteria to summarize and evaluate empirical economics". We follow this methodology, especially in the important step of defining the objective of the meta-analysis.
Doucouliagos and Paldam (2009) conducted a referral meta-analysis for development economics, in which they assessed the publication bias in aid effectiveness evaluation. More details on the methodology and meta-equations. They used 97 research papers on aid effectiveness, from 4 databases. Their main research questions were to determine whether aid increases accumulation in the recipient country, and if so, by how much? The spirit of our research question is similar to this approach because we are examining whether the theoretical favorable effects of DEP on sustainable development have been proven by the literature.
However, classical meta-analyses like these, address only one parameter of interest at a time (aid effectiveness in Doucouliagos and Paldam (2009), Ricardian equivalence in Stanley (2001)), and usually a continuous parameter. We propose an original extension to these classic approaches, by testing simultaneously a relatively large number of parameters, related to the contribution of project characteristics
To clarify to what extent our study fills a gap, we investigated 4 sources specialized in conducting international meta-analysis, a website http://meta-analysis.cz/ and reviews of Journal of Economic literature, Journal of economic perspective, Journal of economic surveys.
As shown in Table 2 there is no meta-analysis about access to electricity (“electrification”). Our research shows that our paper is the first meta-analysis on electrification effects.
We found 12 meta-analyses about “electricity”, which proves the growing importance of the electricity economics field, as each meta-analysis is based on a populated set of underlying studies. Those studies address topics so different from CoSMMA, that we can hardly use them as reference, but we can highlight 2 findings:
Meta-analyses about electricity economics are feasible CoSMMA fills a gap in off-grid electrification assessment.
It is worth noting that 6 of the existing meta-analyses are about USA electricity economics, 2 about developing countries, and 1 about renewable electricity.
Several literature reviews about energy economics were also investigated. Table 3 shows the number of articles reviewed. These numbers are small compared to the number of papers used in the CoSMMA (123).
Table 2 - Review of literature or meta-analysis about electricity economics (as of Oct 12th 2018)
Review Key words Response/reference Title Qualification with respect to CoSMMA objectives
Journal of Economic
Literature “electrification” 0 Journal of Economic
Perspectives “electrification” 0 Journal of Economic
Surveys “electrification” 2. Of which, responses to consider : 0 Off-topic: railroad electrification and cliometrics
http://meta-analysis.cz/ Havranek et al (2018) Does Daylight Saving Save Electricity? A Meta-Analysis Off-topic and reverse causality: the authors study the impact of daylight saving time on electricity consumption (44 studies) Journal of Economic
Literature “electricity” (Zheng and Kahn (2013) Zheng and Kahn (2013) Understanding China's Urban Pollution Dynamics Off-topic: on-grid analysis and only one dimension studied. Underlying studies unclear (an assembly of datasets). Authors study the impact of electricity consumption on environmental externalities, notably air quality Journal of Economic
Perspectives
“electricity” 8
Joskow (2003) Creating a Smarter U.S. Electricity Grid Off-topic: US
Davis (2012) Prospects for Nuclear Power Off-topic: US, Nuclear Power Borenstein (2012) The Private and Public Economics of Renewable Electricity
Generation
The author aims to evaluate the pricing of (positive) externalities from renewable electricity generation.
Off-topic: Discussion in the literature.
Wolfram et al (2012) How Will Energy Demand Develop in the Developing World? Off-topic: Impact of growing energy demand on the grid Borenstein (2002) The Trouble With Electricity Markets: Understanding
California's Restructuring Disaster Off-topic: US Bazelon and Smetters
(1999) Discounting Inside the Washington D.C. Beltway Off-topic: US Winston (1998) U.S. Industry Adjustment to Economic Deregulation Off-topic: US Joskow (1997) Restructuring, Competition and Regulatory Reform in the
U.S. Electricity Sector Off-topic: US Journal of Economic Surveys “meta-analysis electricity” 18. Of which, responses to consider: 2
Note: retrieved papers strongly orthogonal to our research (i.e. not in electricity economics field) are not shown.
Stern (2012) Interfuel Substitution: A Meta-Analysis Off-topic: underlying studies are macro-economics The author studies inter-fuel substitutability (47 studies) Heshmati (2014) Demand, Customer Base-Line and Demand Response in the
Table 3 – Listed studies in electricity economics (as of 12th Oct 2018) Reference Number of listed studies Praktiknjo et al (2011) 16
Jamasb et al (2017) 18 Bonan et al (2014) 20 Brenneman and Kerf (2002) 402 Peters and Sievert (2015) 9 Thopil and Pouris (2015) 15 (van Gevelt (, 2014) 90
3. Sources of data
3.1. Methods used to build the CoSMMA
Research papers used to document DEPs in the CoSMMA were taken from 4 economic research academic databases: Academic Search Premier, Business Source Complete, EconLit, GreenFILE. The studies on the impact of electrification show a wide scope of methodologies, data, and projects. Following Stanley (2001), "differences in quality, data or methods do not provide a valid justification for omitting studies. Rather, such difference provide the underlying rationale for doing a meta-regression analysis in the first place."
A systematic collection of research papers was made, with no ex-ante exclusion, but the topic relevance (Stanley, 2001) : "after reducing the sample of studies to those that contain some relevant empirical estimate, test or finding"). Off-topic studies (e.g. electrification of railways), macroeconomic studies, studies focused only on potential and barriers, ex-ante cost/benefit analyses, or technical feasibility studies) were not used for the CoSMMA. Papers with a developed country in the title were excluded. Only papers with a publication date later than 1980 were selected. This time span was set to avoid missing any important precursor publications about decentralized electrification. However, because the growing interest in decentralized electrification is recent, papers before 1990 are scarce (see Figure 1).
Publication conditions were also checked. Documents had to use a common language (English) and be peer-reviewed, or designed for such a process (e.g. working papers of research institutions). A few economic reports (from financing institutions or companies) were included because they had been through a quality control process before public dissemination. They represent 7% of the current primary sources of the CoSMMA.
Figure 1 - Number of papers by publication period (4 years)
A key sentence containing words usually used to analyze decentralized electrification projects was defined and parsed through EBSCO for the 4 databases. Keywords were automatically reweighted by a smart text mining function in EBSCO. Some variants were also used. Finally 6 main queries were defined which gave 6 sets of documents, called "packs". For the most complex queries, a common set of additional keywords was used in order to limit the study more closely to decentralized electrification projects.
Reweighted queries were saved to keep track of the search, allowing for possible external replication.
Being keyword-based and systematic, this methodical sampling aims to define a neutral collection of papers, which is not influenced by the researcher’s knowledge or a specific direction of research. The keyword-based sampling approach warrants provides a random selection of papers related to the DEP effectiveness field of research. However, the ability of an algorithm to fit accurately to a field of research cannot be guaranteed, and so ex-post human checks were performed on the EBSCO selection results. Possible duplicates were eliminated, and a final check of the application of ex-ante selection criteria was made (e.g. residual macroeconomic studies or other off-topic papers were eliminated).
Within each of the 6 packs, keywords defined specific branches. Inside each branch, some articles with large bibliography were used to define sub-branches, in which some of the papers quoted in the bibliography of the head article were collected as well. However, the bibliographies of initial articles were used with parsimony, because too many papers from sub-branches could have introduced a
1 1 1 7 13 8 9 34 55 9 1981 1985 1989 1993 1997 2001 2005 2009 2013 2017
No. of articles (4 years) Current period (2017-2018)
bias toward the past into the meta-analysis, and also a direction bias: at a given point in time, a researcher can only cite previously published papers, and papers strongly related to his or her own research direction.
For reasons related to the research project’s origin, 32 articles were used in addition, following a classic approach based on research about the econometric evaluation of decentralized electrification. These articles did not duplicate the EBSCO extraction. They constitute an additional pack in the meta-base. Additional papers (from sub-branches or historical pack) are 18% of all collected papers.
After this selection process, the dataset ready for statistical analysis contains 421 projects, evaluated in 123papers, with a total of 2605 effects.
The inclusion criteria applied to project characteristics are presented in Table 4 below. Note that the number of exclusions results from the simultaneous application of criteria, and the number of exclusions is thus not the total number resulting from each individual criterion.
Figure 2 shows the geographical distribution of DEPs registered in the CoSMMA, showing that CoSMMA is based on a wide variety of experiences.
Table 4 - Project inclusion criteria
Projects in sample must - Initial number of observations - 2818
effects Number of excluded observations be operative (or eventually have been
operative) Projects must have a commission date before 2018. Defaulted projects are accepted.
105
not be in OECD and must have an understandable continental location
Effects from projects in OECD countries or with unclear continental location ("worldwide" studies) are excluded
15
deliver capacity below 100 MW Application of Dillig et al (2016) criteria : projects with capacity below 100 MW are not involved in balancing, nor in market exchanges nor in clearing
3
use a clear specified technology Effects from studies based on existing energy mix are excluded 85 be deployed in rural area Effects from projects in urban area
are excluded 1
be evaluated with samples that do not show unusually high extreme values
Observations above 5 times the usual threshold for Dfbeta were excluded 2 be evaluated with samples of normal
size
Samples with observation number larger than the 99% quantile of this number were excluded. The threshold was 352,800 observations
2
Number in large sample – 2,605
observations
Total number of deleted observations (effects) - 213
Figure 2 Map of DEPs registered in CoSMMA
3.2. Descriptive statistics
The CoSMMA covers a variety of evaluations of DEPs, from well-identified econometric estimations to mere descriptive observations.
Annex 1 lists the various effects by quality of estimation. About two-thirds of the reported effects were submitted to statistical tests by their authors. We call scientific data the data associated with tested effects. We call the remaining data expert data. For reasons explained later, our conclusions from the meta-analysis are based only on scientific data. For this reason, we restrict at this stage our description of CoSMMA data to the sub-sample of scientific data.
Annex 2 describes the distribution of this sub-sample by technology, system size, decision level, and continent. Solar systems account for the vast majority (over 70%) of the DEPs in this subsample; other sources are mainly renewables, and there is a small number of DEPs which use fuel.
The system size of DEPs can vary from less than 1 kW to 100 MW. Our classification by size is based on the following definitions:
Nano: < 1 kW Micro: 1 to 100 kW Mini: 100 kW to 100 MW
The most frequent decision levels are at country level or at local (municipality) level. This corresponds to two vastly different approaches: top down or bottom up.
As for geographical distribution, approx. 50% of projects are in Africa, approx. 40% are in Asia, and 10% are in Latin America.
Annex 3 describes the distribution of effects by direction. Some effects are qualified as favorable to sustainable development (e.g. they increase energy availability, develop income generating activities, save time for households, improve health or education, reduce environmental damage). Some are qualified as unfavorable. About 2/3 are favorable and 1/3 are unfavorable (with a small proportion of inconclusive studies). This ratio of 2 to 1 corresponds to anecdotal evidence reported by NGOs on their success rates with DEPs. However, the most striking observation is that whatever the direction of the effects, a majority of effects are unproven: the usual statistical tests show that the probability that reported evidence is false is above 5%. Only about 20% of reported effects are proven, this proportion is a little higher for favorable effects than for unfavorable effects. As a consequence, out of the sample of 1,486 effects measured with scientific data, only 225 are proven favorable effects, which we call henceforth “positive impacts”, and 81 are proven unfavorable effects, which we call “negative impacts”.
Annex 4 shows the distribution of characteristics associated with positive impacts. Comparing this distribution with the distribution of observed effects in Annex 2 gives a primary assessment of where the best practices are. We observe that there are, relatively speaking, more positive impacts in projects using hybrid technology with renewables and less positive impacts in projects using fuel or hybrid technology with fuel. There are also a few more solar-based projects with positive impact than in the full sample. We observe also that there are more positive impacts in projects based on nano size systems. The proportion of positive impacts is the highest at provincial decision level. Finally, there are more positive impacts in Africa than in Asia. These descriptive conclusions may however be misleading, because the different characteristics considered one by one are actually correlated. For instance, most solar systems are SHS, of nano size. We will show in section 5 that the predominance of hybrid and renewable technologies is confirmed by a multivariate analysis, but that nano size systems are not best practice, and that the provincial decision level is not as effective as the country decision level. As for geographical considerations, the multivariate analysis will not confirm the better performance of Africa than Asia suggested by simple descriptive statistics.
4. Methodology for a meta-analysis of DEP impacts
4.1. Objects of the meta-analysisBecause our meta-analysis does not use directly data from the field, it is important to define what are the objects of the analysis. As pointed out by Glass (1977) : "the design of a study is a complex
judgmental process that produces as many different studies as there are researchers and settings in which they work".
The objects of this meta-analysis are the effects of DEPs observed from previous published evaluation studies, which used experimental or observational data. An evaluation study of electrification project is a document that:
Describes the characteristics of the project Describes the general purpose of the project Documents or measures the effects of the project
4.2. Source of heterogeneity across control variables
A meta-study aims to exploit the variance along a common dimension across a set of various studies; but because each research is unique, it seems paradoxical to pretend to identify a common dimension from all the features that make every study unique. As noted by Stanley (2001), "because [...] most studies entail a unique combination of techniques, independent variables, data, time periods and other research choices, not every study characteristic can be coded and analyzed. Nor should a researcher wish to do so. Variation due to minor modeling choices may be treated as part of the random study-to-study background."
To achieve this separation between genuine sources of heterogeneity and heterogeneity that arises from modeling choices, we attempted to establish a clear distinction between a measured phenomenon (effects of a DEP), and the measurements performed to capture this phenomenon (estimation methods), or measurement conditions (Number of observations).
Some meta-analyses capture the number of observations, others capture the T-statistic (Doucouliagos and Paldam, 2006b) or standard error (Havranek et al, 2015), some even include the date of collection, which gives a panel of studies (Havranek et al, 2018).
First, in this study, we controlled for the number of observations (N) when it was available. A clear distinction is made between using scientific data (N>1) and studies using expert data (N ≤ 1), as illustrated in Table 5.
Table 5 - Scientific vs. Expert data
Denomination Type Number of obs. (N) Scientific data Quantified effect with variance n >1
Expert data Quantified effect without variance n=1 Expert data Documented effect from Research n=0 Expert data Unmeasured effect n=0
Second, we controlled for the methodology of evaluation. A large variety of research methodologies
has been used by researchers to gather evidence of DEP effects (as reported in Annex 1), from the
least sophisticated ones (citing others’ results) to the most advanced ones (robust econometric evaluations which permit statistical inference).
The use of expert data merits a specific discussion. As shown by the dataset used in Havranek et al (2018), the absence of statistical tests in some studies, though infrequent, is not necessarily an obstacle to conducting a rigorous meta-regression, although it might be expected that introducing too high a proportion of studies without significance testing could weaken the ability to arrive at conclusions. Carré et al (2015) also conducted a meta-regression using data without variance of the estimates, which confirmed that the methodology is feasible with expert data. They introduced a dummy for the quality level of observations.
In this study, we initially conducted a baseline meta-regression using scientific data only, reproducing the classic framework of meta-analysis. Then we introduced expert data in an attempt to enlarge the estimation sample, using the pool of expert knowledge on DEPs. However, as discussed later, this attempt to include expert data was inconclusive, because we observed large differences in best practice revealed by regressions to separate proven and unproven effects, and by regressions mixing them.
Third, we controlled for the time lag between the year of implementation of the system and the year of publication of its evaluation. This time lag may reflect the short term vs. long term nature of effects, but may also reflect other factors such as the difficulty to collect data which relies on the memory of survey respondents.
4.3. Specification and estimation strategy
As noted by Stanley (2001), "the independent variables -often called "moderator variables"- are those study characteristics that are thought to be consequential". In this meta-analysis, project specifications are expected to be the essential channel of DEP impact. First, this is in line with our objective of exploring best practice in DEPs. Second, DEPs show highly different characteristics, because in decentralized electricity there is no grid playing a structuring role in terms of balancing, interconnection standards, or demand response. The heterogeneity of DEP characteristics is higher across projects chosen for research evaluation, because evaluated projects are often the most innovative ones, either in terms of technological features or in terms of socio-economic environment and organizational features.
The outcome variable is the direction of the effect of a DEP, which is a categorical variable; we aim to explore the determinants of the probability of observing a given direction of effect. Basically, we could consider a dichotomous outcome, i.e. whether evaluated DEPs had favorable effects on sustainable development or not. However, given the large number of studies reporting unproven directions of the effects (Annex 3), our set of information would be too fuzzy in the absence of a
distinction between proven and unproven conclusions. In an attempt to avoid this shortcoming, we considered 5 distinct categories of effect directions, as reported in Annex 3, in which proven and unproven effects are separated.
The baseline estimation links a set of project characteristics and of methodological control of evaluations to the probability of achieving a given outcome. The possible outcomes are defined by the combination of the direction of the effects (favorable or unfavorable) and their nature (proven or unproven). The parameters are estimated with a multi-probit estimator, which yields simultaneously all equations, one for each direction and nature of outcome.
P(outcomeip = k) = constant + c.EvalCondip + s.ProjectSpecp + error-termip
Where:
p is a project
i is an observed or reported effect
outcome = k is one of 5 possible outcomes
EvalCondip is a vector of control variables of an evaluation’s conditions, as developed in the
next section ;
ProjectSpecp is a vector of a project’s specifications
This equation provides an assessment of best practice by evaluating s, a vector of parameters which describes the influence of project specifications (ProjectSpec) on the probability of obtaining a positive impact, after controlling for conditions of evaluation in underlying studies (EvalCond). Although our interest is focused on the positive impact outcome, estimating the full set of parameters associated with all 5 outcomes in a multi-probit regression provides a way to enrich our estimation, because estimating the determinant of other outcomes conveys indirectly information about the DEP characteristics that limit their ability to have positive impacts.
Most of the variables in the vector ProjectSpec are categorical. We consider 4 different types of characteristics:
Technology: the sources of energy and technics used to produce electricity System size: electric power available for users connected to the system
Organization: decision level - from local to country or multi-country, at which the DEP was conceived
Geographical location.
The variance estimator uses clusters by project objectives, whose classification is described in Annex 5.
In the same way as controls were introduced ex-ante in the estimation strategy, some essential robustness checks were performed before the estimation, to exclude the worst cases that could have spoiled the estimation. These checks correspond to the bottom 2 criteria in Table 4.
The most atypical observations were excluded from the estimation sample, because they could have a too high influence on the meta-estimation, and hide other more frequent relationships. Atypical data appear from uncheckable errors during the collection process, or due to abnormal observations at the extreme end of the variables’ distributions.
The outliers were filtered based on a Dfbeta estimation and a quantile-based filter. Outliers above a limit for Dfbeta were excluded: from a simple LPM using all candidate covariates, Dfbeta were computed for all observations. Observations with a Dfbeta more than 5 times the usual threshold (5 x 2/ N) were dropped. Observations above the 99% quantile of their distribution were also dropped.
5. Which characteristics of electricity projects yield positive impacts on sustainable
development?
Table 6 shows the role of the characteristics in project effectiveness, after controlling for conditions of evaluation. This table presents average marginal effects (AME) of the probability of generating the different outcomes. As our variables of interest are categorical, estimated AMEs represent the difference between the probability that a given category generates the outcome and the probability associated with a reference category, which is denoted as "ref. =".
Below, we discuss the role of source of energy, system size (power), decision level, and location
5.1. Role of source of energy
Many different sources of energy can be utilized in DEPs. The different sources of energy have different unit costs, intermittence, reliability, or maintenance requirements. At this stage we can only measure the average performance of the different sources, and we cannot compare them because in practice performance is conditioned by many other factors such as geography.
We chose as reference hydroelectric power projects, which were historically among the first DEPs based on renewable energy deployed in developing countries.
Solar power based on photovoltaic panels is by far the most popular technology for DEPs. Solar projects have +12.3 percentage points (pp) higher chance of generating positive impacts than hydroelectric power projects (Table 6 col 1). It is also interesting to note that the risk that solar-based DEPs create negative impacts is significantly lower (- 10.7 pp) than for hydroelectric power projects.
Table 6 – Effectiveness characteristics of DEPs - Average Marginal Effects (AME) Positive Unproven
favorable Proven unfavorable Negative Inconclusive No. of Observations (N) -0.000 0.000** -0.000*** 0.000* -0.000*** Delay of evaluation -0.010*** -0.013 0.021*** 0.001 0.002* Method (ref. = Econometrics without
inference)
Identification 0.335*** -0.242* -0.012 -0.040 -0.041 Econometrics without inference 0.000 0.000 0.000 0.000 0.000 No inference -0.158*** 0.307 -0.128*** 0.039 -0.060
Technology: (ref. = Hydroelectric)
Hydroelectric power source 0.000 0.000 0.000 0.000 0.000 Solar 0.123*** -0.107* 0.027 0.027 -0.070*** Hybrid with Fossil fuel 0.320*** -0.176* 0.017 -0.119*** -0.042 Hybrid renewables 0.418*** -0.177* -0.015 -0.157*** -0.069***
Biomass (and related tech.) 0.212*** 0.035* -0.029 -0.133*** -0.086***
Fossil Fuels 0.238*** -0.352 -0.040 0.241 -0.086*** Power : (ref. = Nano)
Nano: <1 kW 0.000 0.000 0.000 0.000 0.000 Micro: 1 to 100 kW 0.365*** -0.188** -0.051*** -0.102 -0.025***
Mini: 100 kW to 100 MW 0.319*** -0.162*** -0.059*** -0.086 -0.012***
Programme Decision Level (ref. = Local)
Country 0.086*** -0.099*** -0.008** 0.058* -0.037** Province -0.173*** 0.034** 0.014 0.155*** -0.031 County -0.089*** -0.237*** 0.109*** 0.251*** -0.034**
District -0.011** 0.050* -0.029*** 0.030 -0.041**
Local 0.000 0.000 0.000 0.000 0.000
Geographical Area (ref. = Asia) :
Africa -0.139** 0.074 -0.000 0.084 -0.019
Asia 0.000 0.000 0.000 0.000 0.000
Latin America 0.059*** -0.038 -0.014 -0.038 0.031
Total number of obs. in Mprobit 1,486 1,486 1,486 1,486 1,486 Obs. number of outcomes 225 797 81 356 27
However solar energy is not necessarily best practice. All technologies have a higher chance to bring positive impacts than hydroelectric power projects, between +41.8 pp (hybrid renewables) and +12.3 pp (solar) (Table 6, col 1). Hydroelectric power projects are highly constrained by resource location; other technologies used for DEPs could be more flexible and mobile, with a better ability to adapt accurately the energy supply to population needs, combining supplied power with local network of distribution. Hydroelectric power projects are constrained by the topography of hydrological basins, which can increase the cost of local power lines due to mountainous terrain and distance to local populations, and make a substantial difference between the theoretical potential of Small Hydro Power (SHP) and a feasible answer to electricity needs UNIDO (2010).
The most promising solutions appear to be hybrid renewables, suggesting positive combined roles played by sustainability and flexibility. However, hybrid renewable projects are very innovative, and for this reason could result in more attention being paid to the project’s inclusion in its socio-economic environment. Technology could thus hide other unobservable factors of project organization and governance, with which they might be correlated.
The fact that fossil fuel technologies also have a significantly high positive impact (higher than solar projects) suggests that flexibility is a major determinant of positive impact. Although environmental negative impacts could be expected, diesel generators are highly mobile: they have the capacity to fill a missing link in energy supply networks, and provide short term solutions in emergency situations. They prove here to bring positive impacts to populations, basically by bringing missing energy: 62% of effects observed with fuel technology are related to the Energy & energy market type of effect.
Renewable technologies cover a much broader scope of socio-economic and environmental effects, with 76% of effects appearing in all types of effects except Energy & energy market, with also a relatively small number of effects on environment (4.1%). This suggests the importance of taking into account the type of effects in further analysis (see section 5.6).
Biomass technology has mixed results for development: projects using biomass technology have 21.2 pp more chance of having positive impacts than hydroelectric power (Table 6, col. 1). But projects based on biomass also show a higher risk of having negative impacts (+3.5 pp). As a matter of fact, theThe dependency of biomass solutions on the availability of biomass resource limits their ability to respond to energy demand.
5.2. Role of system size
As reference we use the nano size, which is the system size most commonly associated with SHS. All projects bigger than nano size have a high chance of generating positive impacts. Micro-grids have the highest chances to generate positive impacts (+36.5 pp, Table 6, col. 1)
The difficulty for nano size solutions to bringhave positive impacts may come from the observation that many projects based on nano systems fail, because they do not generate enough new income
to cover their cost Roche and Blanchard (2018). However, this observation may be wrong due to a lack of accurate evaluation of such projects. As shown by Table 6, col 2, favorable effects of nano projects have a significantly higher probability of remaining unproven than those of other project sizes.
5.3. Role of project decision level
DEPs can be decided at many different levels, from the local to the country level (or even the multi-country level, which we aggregated with the multi-country level, due to lack of sufficient number of observations of multi-country projects).
The level of project decision could have different types of consequences. On the one hand, a locally decided project might take population needs better into account; it might also be based on a governance structure attentive to promoting cooperation in resource management, thereby preventing the emergence of free-riding issues. On the other hand, projects decided at country level, or at multi-country level, could benefit from a higher degree of expertise, experience, and scalability. Economies of scale in knowledge accumulation and a higher level of expertise can help to find, at least from a technical point of view, the most efficient solutions; public management and supervision systems provide country authorities with accurate feedback from the field, which can be used to identify good and bad practices in the project cycle.
The combination of these two sets or arguments suggests that both bottom-up approaches and top-down approaches can trigger positive impacts, which may lead to a U-shaped relationship between the level of decision and the probability of obtaining positive impacts. This is what we observe in Table 6, col 1. Taking the local level as reference, we observe that the farther the decision level is from the local level, the lower the probability of a positive impact when we compare decision levels from local level to county level. Above the county level, the probability of obtaining positive impacts increases again, and reaches its maximum at the country (or multi-country) level (+8.6 pp as compared to the reference local level). However, this last result could be biased, because country or multi-country programs may have more resources to implement proper ex-post evaluations. The probability of obtaining unproven favorable effect is significantly lower at country level than at local level (Table 6, col 2). The higher probability of positive impacts at country level could thus result from a higher probability of conclusive evaluation.
5.4. Role of location
Location is considered at the scale of continents and introduced as a broad control of project context.
An important issue of DEP deployment is to know whether the local context can alter the effectiveness of technical features. Addressing this question, for small geographic areas would be affected by many unobservable variables, which have been identified in the literature as important
factors. Factors like distance to raw material, cost of resource transportation, light intensity, solar incidence, wind speed, cost of local power line extension according to the morphology of terrain, and population density may influence the total costs of production and/or system performance. We do not mean that these geographical factors are unimportant, they are important, but we cannot disentangle them from other unobservable factors that affect the outcome of DEPs.
Continental location gives some information about the area of economic influence. For instance, the literature shows a genuine know-how of rural electricity development in China, where 400,000 villages have been electrified using small hydroelectric power (SHP) systems NRGExpert (2013) and UNIDO (2010)). This experience is spreading into neighboring countries. Also, experts and engineers are different on different continents, and this difference might lead to different practices in electrification projects.
Asia was chosen as the reference location, due to its long experience in developing rural electricity based on DEPs.
Our model shows that projects in Latin America have a significantly higher probability to of having positive impacts (+5.9 pp, Table 6 col 1) than those in Asia, Projects in Africa have a significantly lower probability of having positive impacts (-13.9 pp, Table 6, col 1).
5.5. Significant pairs of size and technology
Table 7 shows the most contrasted interactions of system size and technology, by replacing the variables technology and size from Table 6 with their interaction. Only interactions with more than 30 observations were kept, and only the most contrasted pairs are shown. A positive value means that the interaction on the left has a higher probability of impact than the one on the right.
The two biggest contrasts are when comparing mini hybrid fossil projects with nano solar projects (+42.5 pp) and micro fuel projects with nano solar projects (+41.9 pp). As suggested from the separated effects in Table 6, solar per se may have a positive impact (although moderate), but solar projects are less efficient when the power is delivered through nano systems (i.e. in SHS), as compared to other combinations of size and technology of off-grid electricity production. The lower probability of positive impacts of nano solar projects is due to their size limitation: a too low supplied power does not permit access to all types of electrical appliances.
Half of the biggest contrasts between interactions of size and technology involve hybrid projects, with or without fuel. Deploying a micro size project with hybrid renewable technologies has +40.4 pp higher chance of generating positive impacts than a nano solar solution, and + 28.5 pp more than a micro hydroelectric power project. Even nano projects based on hybrid renewable electricity have a higher probability of having a positive impact than micro projects based on a hydroelectric power source (the “classic” SHP) (+24.8 pp)%) or nano projects based on solar source (+36.7 pp).
Table 7 – AME of impacts - Highest Significant Pairwise Comparisons
Pairwise delta p-value Hybrid with Fossil Mini 100 kW to 100 vs Solar Nano <1 kW 0.425 0.000 Fossil Fuels Micro 1 to 100 kW vs Solar Nano <1 kW 0.419 0.000 Biomass and related Micro 1 to 100 kW vs Solar Nano <1 kW 0.411 0.000 Hybrid renewables Micro 1 to 100 kW vs Solar Nano <1 kW 0.404 0.000 Hybrid renewables Nano <1 kW vs Solar Nano <1 kW 0.367 0.000 Solar Micro 1 to 100 kW vs Solar Nano <1 kW 0.329 0.000 Hybrid with Fossil Mini 100 kW to 100 vs Hydropower source Micro 1 to 100 kW 0.306 0.000 Fossil Fuels Micro 1 to 100 kW vs Hydropower source Micro 1 to 100 kW 0.300 0.000 Biomass and related Micro 1 to 100 kW vs Hydropower source Micro 1 to 100 kW 0.292 0.000 Hybrid renewables Micro 1 to 100 kW vs Hydropower source Micro 1 to 100 kW 0.285 0.000 Hybrid renewables Nano <1 kW vs Hydropower source Micro 1 to 100 kW 0.248 0.000 Solar Micro 1 to 100 kW vs Hydropower source Micro 1 to 100 kW 0.210 0.000
5.6. Factors of success by type of effects
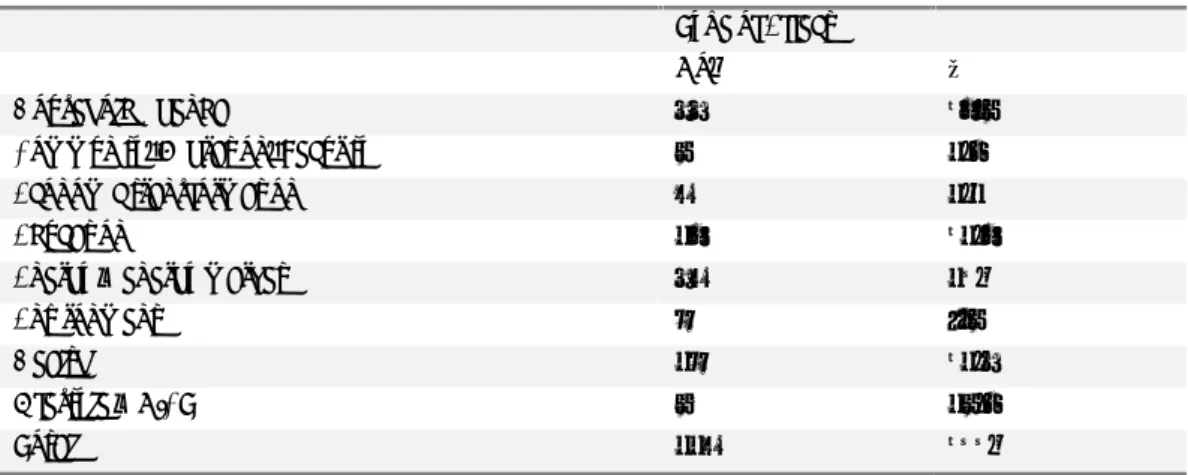
The distribution of effects observed with scientific data by type of effect is shown in Table 8. The highest concentration is for Energy & energy market and the lowest is for Environment. The relatively low number of scientific measurement of effects on the environment may be due to the relatively recent emphasis in development policies on this core aspect of sustainable development. Economic transformation is also an effect for which observations are relatively few, perhaps due to the concentration of observations on SHS, which do not target productive uses of electricity.
Table 8 - Distribution of effects by type (scientific data)
Type of Effect
No. %
Household Agenda 185 12.4
Community, Migration, Security 104 7.0
Economic transformation 105 7.1
Education 225 15.1
Energy and energy market 377 25.4
Environment 68 4.6
Health 206 13.9
Lifestyle & NICT 216 14.5
Total 1,486 100.0
A comparison with the distribution of positive impacts by type reported in Table 9 suggests that the effect types that are the most likely to result in success of DEPs are Lifestyle & NICT and Household Agenda: the proportion of positive impacts in observed effects is respectively 28% and 24%. For Community, Migration, Security, and Economic transformation the positive impacts account for 6% and 5%, respectively. For the other effect types the proportion of positive impacts is a little below the average (15%).
Table 9 - Distribution of impacts by effect type (scientific data)
Type of Effect
No. %
Household Agenda 44 19.6
Community, Migration, Security 6 2.7
Economic transformation 5 2.2
Education 29 12.9
Energy & energy market 45 20.0
Environment 8 3.6
Health 28 12.4
Lifestyle & NICT 60 26.7
As a consequence of this structure of effects by effect type, identifying factors that lead to positive impacts on the various types of effects is constrained by the small number of available observations for most of the types. Table 9 shows that only three effect types have more than 30 positive impacts in the CoSMMA. Due to the peculiar heterogeneity of these impacts in each effect type, estimates could be computed for only two types of effect: Energy & energy market, and Lifestyle & NICT. Table 10 shows separated regression results. For each type of effects, only observations with effects of this type were selected, thereby defining separated multi-probit estimations. Only parameters related to the probability of positive impacts are reported.
Table 10 - AME - Impacts - scientific data - separated regressions by subset of Effect Type Energy and energy market Lifestyle and NICT No. of Observations (N) 0.000 -0.000***
Method (ref. = Econometrics without inference)
Identification 0.521*** 0.000
Econometrics without inference 0.000 0.000
No inference -0.211*** 0.000
Technology : (ref. = Hydro) :
Hydroelectric power source 0.000 0.000
Solar -0.103 0.000
Hybrid with Fossil fuel 0.076 0.000
Hybrid renewables 0.007 0.000
Biomass (and related tech.) 0.038 0.000
Fossil Fuels 0.077 0.000
Power : (ref. = Nano)
Nano: <1 kW 0.000 0.000
Micro: 1 to 100 kW 0.066 -0.288*** Mini: 100 kW to 100 MW 0.237*** -0.303***
Decision Level (ref. = Local) :
Country 0.008 0.000
Province -0.048*** 0.000
County -0.159*** 0.000
District 0.305*** 0.000
Local 0.000 0.000
Geographical Area (ref. = Asia) :
Africa -0.139*** -0.221***
Asia 0.000 0.000
Latin America 0.025 -0.085
Total number of Obs. in Mprobit 377 216 Obs. Number of positive impact outcome 45 60
Due to the limited number of observations, the set of controls was restricted to two essential controls, the number of observations (N) and the method of estimation.3
3 The diagnosis of colinearity was made with the sub-sample of effects in Energy market, which is the largest sub-sample
(384 observations before estimation).). The number of observations (N) had a first occurrence at second rank in the Condition Number matrix for the set of explanatory variables: it should thus not be dropped in first intention. The delay of evaluation was previously used as a qualification variable, not as a strong control: it was thus preferably dropped, as compared to and the variable Method was used.
The parameters associated with technology in the Lifestyle & NICT effect type could not be computed. They were estimated in the Energy & energy market effect type, but none were significant.
The effects of system size are in opposition depending on the effect type: mini-grids have a higher chance of yielding impacts in Energy & energy market (+23.7 pp, col1), but in Lifestyle & NICT, there is a higher probability of obtaining positive impacts with nano solutions (+30.3 pp) as compared to mini-grids or micro projects (+28.8 pp).
For effects for Energy & energy market, decisions at local and district levels have higher chances of generating positive impacts than intermediate levels of decision, partly confirming the U-shaped pattern for this type of effect. The parameters for the decision level could not be estimated for Lifestyle & NICT.
Projects which impacted Energy & energy market and Lifestyle & NICT were more efficient in Asia than Africa (+13.9 pp and +22.1 pp, col 1 and 2)
Finally, the negative sign of a number of observations for Lifestyle & NICT suggests that these results could be affected by a publication bias.
5.7. Extending knowledge of effects with expert data
Given the shortage of information based on scientific data, it is tempting to try to expand our information base with expert data. Expert Data (ED) has two levels of data quality: effects that rely on observations without variance (N=1) (i.e. without confidence interval), and effects that are solely documented from other research papers, or simply mentioned in institutional reports (N=0).
In both cases, including ED in the estimation does not allow the separation of proven favorable (unfavorable) outcomes and unproven favorable (unfavorable) outcomes, as ED do not provide confidence intervals.
Hence the use of ED in a model, which enlarges the observation sample, limits the precision of the model because the number of possible outcomes is reduced to 3 (favorable, unfavorable, inconclusive). This modifies the results. Merging proven and unproven favorable effects hides the specific information provided by proven favorable effects. In our data unproven favorable effects are more numerous (940 versus 225), and Table 6 shows that proven and unproven favorable effects have different explanatory factors. As a result, as shown by the differences between Table 6 and Table 11, with Expert Data included, the unproven favorable effects dominate and lead to a totally different picture of DEP effectiveness.
Table 11 - AME- with expert data (N >= 0)
Favorable Unfavorable Unknown direction Delay of evaluation -0.003 0.003 -0.000 Method (ref. = Econometrics without
inference)
Identification 0.026 -0.051 0.025**
Econometrics without inference 0.000 0.000 0.000 No inference 0.079 -0.073 -0.007 No measurement 0.187 -0.203 0.016 Technology (ref. = Hydro):
Wind -0.395** 0.290 0.104
Geothermal/Tidal 0.108*** -0.131*** 0.024
Hydroelectric power source 0.000 0.000 0.000
Solar -0.137*** 0.129** 0.008
Hybrid with Fossil fuel -0.058 0.056 0.002 Hybrid renewables 0.037* -0.019 -0.018*
Biomass (and related tech.) -0.078*** 0.072*** 0.007***
Fossil Fuels -0.198 0.223 -0.026** Power (ref. = Nano)
Nano: <1 kW 0.000 0.000 0.000 Micro: 1 to 100 kW -0.063* 0.046 0.017 Mini: 100 kW to 100 MW -0.029 -0.024 0.054***
Programme Decision Level (ref. = Local)
Country -0.075* 0.087* -0.012
Province -0.116* 0.135** -0.019 County -0.362*** 0.394*** -0.032*** District 0.101*** -0.068*** -0.033
Local 0.000 0.000 0.000
Geographical Area (ref. = Asia)
Other non-OECD 0.261*** -0.218*** -0.043***
Africa -0.018 0.032 -0.013*
Asia 0.000 0.000 0.000
Latin America 0.026 0.009 -0.035***
Europe non-OECD -0.734*** -0.176** 0.909*** Total number of obs. in Mprobit 2,532 2,532 2,532 Obs. Number of outcomes 1,854 586 92
As shown on Table 11, Solar technology would be beaten by most alternatives, except Wind (whose parameter could not be estimated in Table 6). The most effective technologies for development would be Geothermal, whose parameter also could not be estimated in Table 6 (+10.8 pp, Table 11, col1) and Hybrid renewables (+3.7 pp).
Nano solutions would be a significantly better choice than Micro-grids (+6.3 pp, col 1) and would have a similar performance to Mini-grids.
Local decisions (whether from municipalities or districts) would be more efficient than any other level (col 1), and country levels of decision would bring more unfavorable effects (col 2).
These results are in contrast to the conclusions reached from Table 6. They are however fragile, as the significance of parameters is very sensitive to sample changes. When estimated on the sub-sample of scientific data, parameters associated with sources of energy and system size become non-significant (table not shown).
6. Discussion
6.1. Possible selection bias
The selection procedure with EBSCO ensures that no bias from a focus in search of a specific research frontier, which would result in a narrowly oriented selection of papers, remains. However, some selection bias could still occur.
First of all, impacts of DEPs can be evaluated only under 3 conditions: - Effects arise from implemented projects
- Researchers tested these effects
- Effects were measured with observed data with heterogeneity.
Effects are not observable if researchers have not considered evaluating them: some effects were not considered relevant, or not of interest, at the time of evaluation, or not surveyed due to budget constraints on the collection of field data. This might be the case for environmental effects, which are rarely measured with field data in the papers entered in the CoSMMA. Some effects are only documented from other pieces of research, or quantified without any sample of observations. In both cases, the significance of an effect is not computable, and whether the reported effect is an evidence of impact remains unknown. Our results suggest that evaluations without statistical tests may lead to conclusions at odds with conclusions obtained from evaluations with statistical tests. Resolving this issue is beyond the scope of this paper, but future developments of the CoSMMA, whose aim is to broaden the scope and depth of DEP evaluations, could contribute to the solution. In addition, research on DEP impacts can be affected by publication bias, because research publications are driven by the need to show innovation and tend to favor significant positive results. In our case, the relatively small proportion of positive impacts reported in evaluations may suggest that this publication bias is limited.
The publication bias can also be magnified by the possible lack of independence of the project assessor. Organizations implementing funded projects need to demonstrate ex-post that positive impacts occur, and might be tempted to resort to assessors dedicated to showing positive impacts. This may explain why a large proportion of papers that we have collected in the CoSMMA report