HAL Id: hal-02357317
https://hal.archives-ouvertes.fr/hal-02357317
Submitted on 9 Nov 2019
HAL is a multi-disciplinary open access
archive for the deposit and dissemination of
sci-entific research documents, whether they are
pub-lished or not. The documents may come from
teaching and research institutions in France or
abroad, or from public or private research centers.
L’archive ouverte pluridisciplinaire HAL, est
destinée au dépôt et à la diffusion de documents
scientifiques de niveau recherche, publiés ou non,
émanant des établissements d’enseignement et de
recherche français ou étrangers, des laboratoires
publics ou privés.
Activation of the interferon type I response rather than
autophagy contributes to myogenesis inhibition in
congenital DM1 myoblasts
Milena Rizzo, Pascale Beffy, Renata Carratore, Alessandra Falleni, Virginia
Pretini, Romina D'aurizio, Annalisa Botta, Monica Evangelista, Andrea
Stoccoro, Fabio Coppedè, et al.
To cite this version:
Milena Rizzo, Pascale Beffy, Renata Carratore, Alessandra Falleni, Virginia Pretini, et al.. Activation
of the interferon type I response rather than autophagy contributes to myogenesis inhibition in
con-genital DM1 myoblasts. Cell Death and Disease, Nature Publishing Group, 2018, 9,
�10.1038/s41419-018-1080-1�. �hal-02357317�
A R T I C L E
O p e n A c c e s s
Activation of the interferon type I response
rather than autophagy contributes to
myogenesis inhibition in congenital DM1
myoblasts
Milena Rizzo
1,2, Pascale Beffy
3, Renata Del Carratore
1, Alessandra Falleni
4, Virginia Pretini
5, Romina D
’Aurizio
6,
Annalisa Botta
7, Monica Evangelista
1, Andrea Stoccoro
8, Fabio Coppedè
8, Denis Furling
9and Marcella Simili
5Abstract
Congenital myotonic dystrophy type 1 (CDM1) is characterized by severe symptoms that affect patients from birth, with 40% mortality in the neonatal period and impaired skeletal muscle development. In this paper, we examined the relationship between autophagy and abnormal myogenic differentiation of CDM1 myoblasts. We investigated these pathological features at both ultrastructural and molecular levels, utilizing two CDM1 foetal myoblasts, CDM13 and CDM15, with 1800 and 3200 repeats, respectively. The congenital nature of these CDM1 myoblasts was confirmed by the high methylation level at the DMPK locus. Our results indicated that abnormal autophagy was independent of myogenic differentiation, as CDM13 myoblasts differentiated as well as control myoblasts but underwent autophagy like CDM15, displaying impaired differentiation. miRNA expression profiles revealed that CDM15 myoblasts failed to upregulate the complex network of myo-miRNAs under MYOD and MEF2A control, while this network was
upregulated in CDM13 myoblasts. Interestingly, the abnormal differentiation of CDM15 myoblasts was associated with cellular stress accompanied by the induction of the interferon type 1 pathway (innate immune response). Indeed, inhibition of the interferon (IFN) type I pathway restores myogenic differentiation of CDM15 myoblasts, suggesting that the inappropriate activation of the innate immune response might contribute to impaired myogenic
differentiation and severe muscle symptoms observed in some CDM1 patients. Thesefindings open up the possibility of new therapeutic approaches to treat CDM1.
Introduction
Myotonic dystrophy type 1 (DM1; MIM#160900) is a debilitating form of muscular dystrophy due to an abnormal increase of CTG repeats in the 3′ UTR region of the dystrophia myotonica protein kinase gene (DMPK). The disease is autosomal dominant, located on chromo-some 19, and shows genetic anticipation, meaning that
the disease symptoms tend to be more severe and to appear at an earlier age as the disorder is passed from one generation to the next. Indeed, both disease severity and age of onset correlate with the number of CTG repeats, ranging from about 100 to 1000 units in adult patients, and from 1000 to more than 3000 units in the congenital form (congenital myotonic dystrophy type 1 (CDM1)) that affects patients from birth and is characterized by severe hypotonia and respiratory insufficiency, with mortality reaching 40% in the neonatal period1. The mechanism by which the trinucleotide repeats expansion determines the complex phenotype of this disease has
© The Author(s) 2018
Open Access This article is licensed under a Creative Commons Attribution 4.0 International License, which permits use, sharing, adaptation, distribution and reproduction in any medium or format, as long as you give appropriate credit to the original author(s) and the source, provide a link to the Creative Commons license, and indicate if changes were made. The images or other third party material in this article are included in the article’s Creative Commons license, unless indicated otherwise in a credit line to the material. If material is not included in the article’s Creative Commons license and your intended use is not permitted by statutory regulation or exceeds the permitted use, you will need to obtain permission directly from the copyright holder. To view a copy of this license, visithttp://creativecommons.org/licenses/by/4.0/.
Correspondence: Marcella Simili (marcella.simili@ibf.cnr.it)
1
Institute of Clinical Physiology (IFC), CNR, Pisa, Italy
2Istituto Toscano Tumori (ITT), Firenze, Italy
Full list of author information is available at the end of the article. These authors contributed equally: Milena Rizzo, Pascale Beffy Edited by G. M. Fimia 1234567890() :,; 1234567890( ):,; 1234567890() :,; 1234567890( ):,;
recently been partially clarified. One of the most accepted theories is that the CUG expansion induces abnormal nuclear accumulation of the mutant mRNA into foci, which in turn sequester the RNA-binding protein MBNL, thereby disrupting the normal alternative splicing and polyadenylation of many mRNAs involved in muscle cell metabolism (trans-dominant effect)2. However, splicing changes do not completely explain the DM1 phenotype, especially the congenital form, as they are shared by other muscular dystrophies, which do not have the same symptoms3. In a previous work, we found a profound impairment in the early steps of muscle differentiation of DM1 myoblasts with a high number of triplets, accom-panied by major alterations of signal transduction path-ways involved in differentiation4. Electron microscopy and molecular analysis revealed that these myoblasts were subject to increased autophagy after transfer into differ-entiating medium, suggesting that autophagy might be an escape mechanism for myoblasts unable to differentiate and partially responsible for muscle loss.
In this work, we investigated whether abnormal differ-entiation and autophagy could be related, and studied the molecular mechanisms that cause these pathological fea-tures using two congenital DM1 foetal myoblasts, CDM13 with 1800 and CDM15 with 3200 CTG repeats.
Our results indicated that aberrant autophagy is char-acteristic of both CDM1 myoblasts independently of their capacity to differentiate. miRNA profiles showed that CDM15 myoblasts with impaired myogenic differentia-tion failed to upregulate myo-miRNAs that are under the control of MYOD and MEF2A. We showed that an abnormal activation of the interferon (IFN) type 1 path-way in defective CDM15 myoblasts contributes to altered myogenesis.
Results
Increased autophagy characterizes both congenital DM1 myoblasts independently of their ability to differentiate
In this study, we used in vitro cell cultures of two DM1 foetal myoblasts (DM15 and DM13) with more than 1000 repeats, and control foetal myoblasts (CON). The repeats number of DM15 was 3200 CTG;4 DM13 was character-ized by a combination of LR-PCR and TP-PCR analyses5 as having a 1800 CTG expansion without interruption at the 5′ or 3′ ends of the repeated array (Supplementary Fig. 1). As congenital forms of DM1 correlate with high levels of methylation of the CpG islandsflanking the CTG repeats rather than simply the repeat number,6,7 we determined the methylation of these regions by the high-resolution melting (HRM) technique (Fig. 1a, Supple-mentary Fig. 2). High levels of methylation were found in the region upstream of the CTG repeats (UR1, UR2, and UR3 amplicons) of both DM13 and DM15 (see schematic representation in Fig.1a), but no methylation was seen in
CON. The amplicons downstream of the CTG repeats (DR1 and DR2) were hypomethylated in CON and DM1 myoblasts. The methylation and high number of CTG repeats indicate both DM1 myoblasts to be congenital and they are henceforth designated as CDM13 (1800 repeats) and CDM15 (3200 repeats).
Myoblasts were induced to differentiate by shifting sub-confluent cultures into differentiating medium: CDM13 differentiated as well as CON (about 70% and 80% of myotubes, respectively, at day 3), while CDM15 myoblasts differentiated poorly (about 30% of myotubes) (Fig.1b, c). We previously hypothesized that autophagy activation could be the consequence of abnormal differentiation;4 for this reason, CDM13, CDM15, and CON myoblasts were analyzed by electron microscopy. We found a low level of autophagy in all analyzed myoblasts both at day 0 and day 3 (Fig.2g). However, under differentiating con-ditions (day 3), autophagy increased significantly in both CDM1 myoblasts compared to CON (Fig. 2a–f),
mea-sured as the number of autophagic vacuoles per cell in both well-differentiated CDM13 and poorly differentiated CDM15 myoblasts (Fig. 2g). This is clearly visible in Fig.2c, where CDM13 myoblasts showed an abundance of myofibrils, concomitant with numerous autophagic vacuoles. These results do not support the hypothesis of a causative association between autophagy and abnormal differentiation4. Some vacuoles have the typical double membrane characteristic of autophagosomes (Fig. 2d, f, black arrow heads), while other more mature autopha-gosomes, which contain black material, do not show double membranes8. The small increase of AV diameter observed at day 3 in comparison to day 0 in all types of myoblasts (Table 1) could be a reflection of a
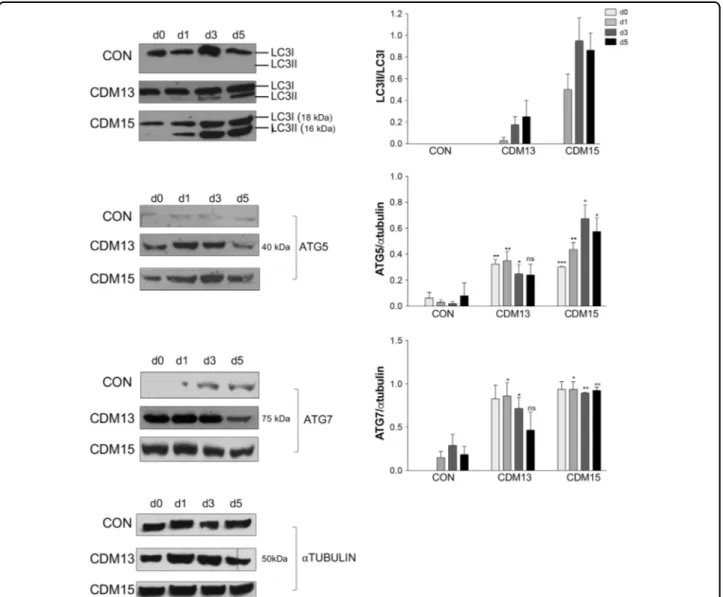
physiolo-gical increase of autophagy, necessary for differentiation as reported by Fortini et al.9. However, LC3 activation and a significant ATG5/ATG7 upregulation were found in CDM13/CDM15 shifted to differentiation medium, but not in CON (Fig.3).
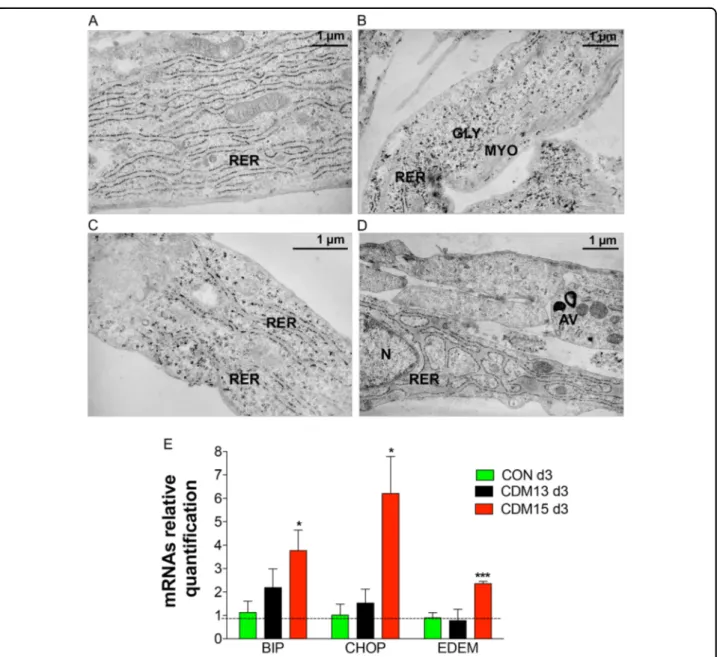
An abnormal rough endoplasmic reticulum (RER) with enlarged cisternae, indicative of cellular stress,10 was found in CDM15 myoblasts at day 3 (Fig. 4d), unlike either CDM13 or CON, showing normally shaped RER (Fig. 4a–c). This result was confirmed by analysis of the ER stress molecular markers BIP, CHOP, and EDEM (Fig.4e), whose mRNA levels only increased significantly
at day 3 in CDM15 cells.
Altered expression of MYOD, MEF2A, and muscle differentiation-related miRNAs in CDM15 myoblasts
To identify molecular pathways involved in defective myogenic differentiation of CDM15 myoblasts, we pro-filed global expression of miRNAs (miRNome, data available at GEO NCBI, GEO accession number GSE97019) of CON, CDM13, and CDM15 myoblasts
before (day 0) and after 3 days in differentiating medium (day 3). The overall relationship among the miRNomes was investigated by PCA analysis (Supplementary Fig. 3), which indicated that CDM13 and CON miRNomes were similar to one another but differed from CDM15 miR-Nomes, especially at day 3.
We analyzed miRNAs differentially expressed at both day 0 (Fig.5a, Supplementary Table 1) and day 3 (Fig.5d, Supplementary Table 2) in CDM15 versus CON and found 24 miRNAs (9 upregulated and 15 downregulated miRNAs, |log2FC| > 1, padj≤ 0.05) at day 0 (named CDM15vsCON(d0)-miRNAs), and 48 miRNAs (23 upre-gulated and 25 downreupre-gulated miRNAs, |log2FC| > 1, padj≤ 0.05) at day 3 (named CDM15vsCON(d3)-miR-NAs). We also checked the expression levels of CDM15vsCON(d0)- and CDM15vsCON(d3)-miRNAs in
CDM13 at day 0 (Fig.5a, third column) and day 3 (Fig.5d, third column) miRNomes and found that the expression level of CDM15vsCON-miRNAs in CDM13 was com-parable to that found in CON, suggesting that the miRNAs altered in CDM15 were normally expressed in CDM13.
To clarify the possible functional role of CDM15vsCON-miRNAs we examined the pathways in which their target genes are involved.
For the CDM15vsCON(d0)-miRNAs, we focused only on the validated targets from well-annotated databases (e.g. MirTarBase, miRecords) and found that 124 KEGG pathways were significantly enriched (p ≤ 0.05, Supplementary Table 3). Interestingly, some of the CDM15vsCON(d0)-miRNA targets belonged to pathways necessary for differentiation. Thus, the upregulation of
Fig. 1 Characterization of CDM1 myoblasts. a High-resolution melting analysis of the DMPK locus. Percentage of methylation in the region upstream (UR1-UR3, left side) and downstream (DR1-DR2, right side) of the CTG repeats at the DMPK locus of CON, CDM13, CDM15 (upper panel), and schematic representation of the regions analyzed at the DMPK locus (lower panel). b Images of control (CON) and of the two CDM1 myoblasts, CDM13 (1800 repeats) and CDM15 (3200 repeats) after 3 days in differentiation medium (Giemsa staining). c Percentage of myotubes obtained by dividing the number of myotubes (cells with more than three nuclei) by the number of counted nuclei (at least 1000 nuclei for each time point). The average number of nuclei per myotube, evaluated by counting a total of 500 myotubes, is reported in brackets above each column
Fig. 2 Analysis of autophagic vacuoles by transmission electron microscopy. Representative micrographs of autophagic vacuoles (AV) in CON (a, b), CDM13 (c, d), and CDM15 myoblasts (e, f) after 3 days in differentiation medium. g Average number mean (±SE) of AV/cell determined by counting the AV in at least 50 myoblasts. The significance was calculated with the multifactor analysis of variance, MANOVA (***p < 0.001). GLY glycogen particles, MYO myofibers, AV autophagic vacuoles, N nucleus, RER rough endoplasmic reticulum. Arrow heads indicate the vacuole double membranes
miR-10b-5p and miR-143-3p, which target PI3K and IGF1R/AKT, respectively, as well as that of miR-10b-3p and miR-145-5p, which target IGF1R (Fig. 5b), could contribute to the inhibition of the mTOR pathway, whose activation is required for differentiation11(Supplementary Table 4). Indeed, the AKT level of CDM15 at day 0 is slightly but significantly lower than in control myoblasts, supporting the hypothesis that miR-143-3p upregulation might be involved in AKT decrease (Fig. 5c). In accor-dance with this result, p-S6K1 phosphorylation level is lower in CDM15 both at day 0 and day 3 in comparison to CON and CDM13 (Supplementary Fig. 4) as previously shown4. It is worth noting the miR-206, required for differentiation12,13, was downregulated in CDM15 myo-blasts compared to CDM13/CON myomyo-blasts, supporting the hypothesis of an early commitment of CDM13 toward differentiation that is lacking in CDM15 myoblasts.
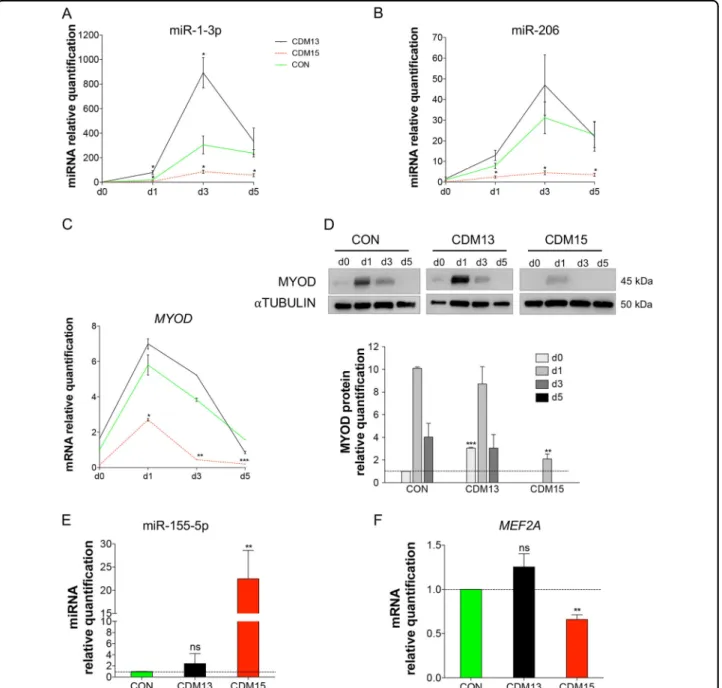
As expected, many of the CDM15vsCON(d3)-miRNAs play a major role in muscle differentiation (the so-called myo-miRNAs, Fig. 5d, underlined miRNAs)12. We vali-dated two important myo-miRNAs, 1-3p, and miR-206, by qRT-PCR (Fig.6a, b): as expected, both miRNAs were poorly induced in CDM15, while they progressively increased in CON/CDM13, reaching a peak at day 3. Since these miRNAs are regulated by MYOD12,13, we verified the relative MYOD expression. As expected (Fig.1), MYOD was poorly induced in CDM15 (Fig.6c, d) while it increased in both CDM13 and CON myoblasts with a time course matching that of 1-3p and miR-206. To investigate whether other deregulated miRNAs could play a role in myogenesis, we identified the vali-dated targets of all CDM15vsCON(d3)-miRNAs and searched for those belonging to the myogenesis pathway (id: R-HSA-525793) present in the REACTOME db
(http://www.reactome.org/) (Supplementary Table 5).
This approach highlighted the downregulation of miR-433, miR-495-3p, and miR-410-3p belonging to the Gtl2-Dio3 miRNA mega cluster, fundamental for skeletal muscle regeneration14and controlled by MEF2A, and the upregulation of miR-155-5p, known to target MEF2A15. Indeed, we found that MEF2A was significantly down-regulated (Fig. 6f), while miR-155-5p was upregulated (Fig. 6e), at day 3 in CDM15 versus CON/CDM13. Overall these results indicated that the expression of a number of miRNAs involved in myogenesis was impaired in CDM15 myoblasts.
Activation of IFN type 1 response in CDM15 myoblasts Analysis by electron microscopy revealed that CDM15 myoblasts showed not only autophagic vacuoles but also a remarkably stressed RER (Fig.4d) compared to CDM13/ CON. p53 increase16 in CDM15 (Supplementary Fig. 5) also suggested the presence of a marked cellular stress in these myoblasts not present in CDM13. Different toxic stimuli could be the basis of CDM15 cellular stress: it has been shown that toxic RNAs containing CUG repeats accumulate in the nuclei of DM1 myoblasts (foci)2,17, and that this RNA can give rise to dsRNA structures18. It is known that dsRNA elicits IFN type 1 (IFN1) production, which activates the innate immune response in an auto-crine fashion19. We hypothesized that dsRNA structures, produced by transcription of the mutant DMPK allele, might induce an IFN response, as previously proposed20, and inhibit muscle differentiation21.
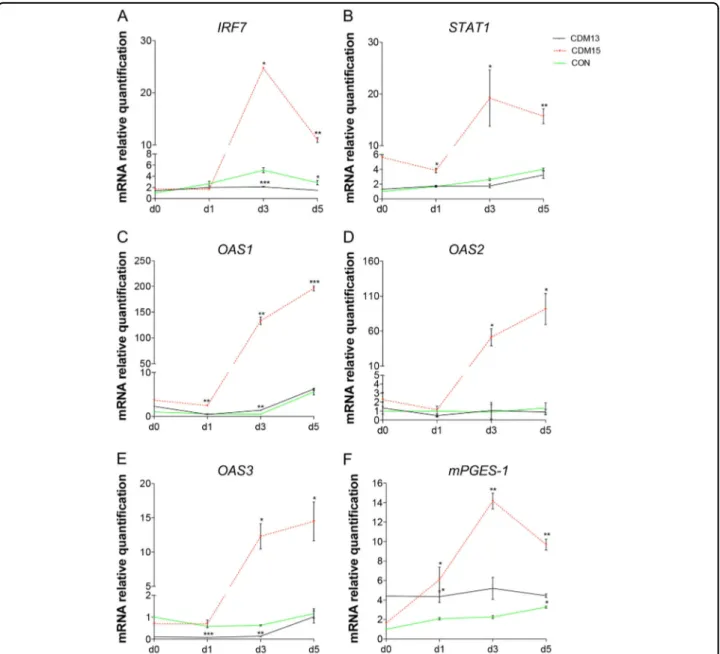
For this reason we analyzed IRF7, one of the first induced IFN1-positive regulators22, as well as some of the IFN1-upregulated genes such as STAT123, and the three 2′–5′ oligoadenylate synthetase genes (OAS 1, OAS 2, and OAS 3)24, and found that their levels markedly increased in CDM15 versus either CON or CDM13 myoblasts (Fig.7a-e). Finally, as IFN1 is known to induce the release of inflammatory cytokines25, we measured mPGES-1 and found a marked increase in CDM15 myoblasts shifted to differentiation medium (Fig.7f), as previously published26. Altogether, these results suggest that CDM15, upon exposure to differentiation medium, undergo a marked upregulation of the IFN1 pathway, which could be directly or indirectly causatively correlated with the inhibition of differentiation observed in these myoblasts.
It has recently been reported that an increase of the sense DMPK transcription coupled with the reduction of DMPK antisense transcription was responsible for the enhanced production of toxic dsRNA formation in patients with severe CDM27. We checked the levels of the two transcripts in all three myoblasts and found that the level of DMPK sense transcript appeared to be higher than that of the antisense transcript in CDM13/CDM15 myoblasts (day 3), with the ratio sense/antisense being Table 1 Diameter (mean±SD) of autophagic vacuoles
(AV) AV diameter (µm) CON Day 0 0.68 ± 0.23 Day 3 1.13 ± 0.32 CDM13 Day 0 0.90 ± 0.25 Day 3 1.33 ± 0.55 CDM15 Day 0 0.66 ± 0.33 Day 3 1.16 ± 0.44
very similar in both CDMs and higher than in control myoblasts (Supplementary Fig. 6). These results, while in keeping with the hyper-methylation of the upstream CTG region in CDM1 patients, do not explain the different degree of differentiation observed in CMD13/CDM15 myoblasts.
As the upregulation of the IFN1 pathway in CDM15 myoblasts correlated with impaired myogenesis, we silenced two genes known to control this pathway at two different levels: (i) Toll-like receptor 3 (TLR3), which is part of a family of receptors28that recognize dsRNA and as such controls one of the early steps of the pathway; (ii) IRF7, considered to be one of the master regulators of
IFN1, acting downstream of TLR329and markedly upre-gulated in CDM15 at day 3 (Fig. 7a). We transfected CDM15/CON myoblasts with siRNAs against IRF7 or TLR3 and then shifted them in differentiating medium for 3 days: at this time point the IRF7 and TLR3 mRNA levels were strongly reduced (Supplementary Fig. 7). The silen-cing of IRF7 and, to a lesser extent, TLR3 partially rescued the defective CDM15 differentiation as shown by the sig-nificant increase of myotubes formation in terms of number of myotubes and nuclei per myotube (Fig.8b) at day 3. Restored myogenesis of CDM15 myoblasts was accompanied by an increase of MYOD (Fig. 8c) and MEF2A (Fig.8e) and a strong decrease of OAS1 (Fig.8d).
Fig. 3 Analysis of proteins involved in autophagy. Representative LC3, ATG5, and ATG7 protein quantifications by immunoblot analysis of CON, CDM13, and CDM15 myoblasts before and after exposure to differentiation medium (days 0–5). LC3 activation was determined by calculating the ratio between the cleaved active LC3-II form and the non-active LC3-I form. The levels of ATG5 and ATG7 were normalized to that ofαtubulin. All data were reported in the corresponding histogram. Results are expressed as mean (SD) and data analyzed by Student’s t-test (*P < 0.05, **P < 0.01, ***P < 0.001). The significance was calculated in CDM13 or CDM15 versus CON for each day
We also tested the miR-155-5p levels, as this miRNA could be under the control of IFN1. Although miR-155-5p tended to decrease after TLR3 or IRF7 silencing in CDM15 myoblasts, the variations were not significant (Fig. 8f); this suggests that in this context miR-155-5p is neither controlled by IFN1 nor controls MEF2A.
Discussion
We had previously shown that CDM15 foetal myoblasts with high number of repeats (> 3000) did not differentiate
properly and underwent autophagy, but the molecular mechanisms underlying this behavior were not fully investigated, nor was it clear whether autophagy was causatively related to aberrant differentiation4. To better investigate these aspects we included in our study another congenital foetal DM1 myoblast, CDM13, containing 1800 repeats and found that their behavior, concerning differentiation, were totally different: CDM15 differ-entiated poorly (as previously reported4), whereas CDM13 differentiated like control myoblasts.
Fig. 4 Analysis of the rough endoplasmic reticulum (RER). Representative micrographs of normal RER observed with transmission electron microscopy at day 3 in CON (a, b) and CDM13 (c), and of very enlarged RER present in CDM15 myoblasts (d). GLY glycogen particles, MYO myofibers, AV autophagic vacuoles, N nucleus, RER rough endoplasmic reticulum. e Relative BIP, CHOP, EDEM mRNA expression levels, quantified by qRT-PCR, in CON, CDM13, and CDM15 on day 3. Data were normalized using the geometric mean of three reference genes (GUSB, TBP, and RPS18). Results are expressed as mean (SD) of at least three independent experiments and data analyzed by Student’s t-test (*P < 0.05, **P < 0.01, ***P < 0.001). The significance was calculated in CON, CDM13, or CDM15 day 3 versus the corresponding day 0
Because miRNA expression plays a major role in muscle development and dysfunction12, a global miRNA expres-sion profile (miRNome) was performed for the first time on foetal CDM1 and control myoblasts.
The miRNA profiles showed a severe deregulation of the miRNAs, that control myogenesis (myo-miRNAs), reflecting the defective differentiation observed in CDM15 myoblasts. Moreover, miRNA deregulation might
be an early event present at the time of commitment toward differentiation since some of the miRNAs deregulated at day 0 in CDM15 can predict the inhibition of the differentiation program. For instance, miR-10b-5p, miR-145-5p, and miR143-3p, which target important mediators of the mTOR pathway essential for myogen-esis11, were upregulated, while miR-206, one of the most important myo-miRNAs12,13, was downregulated. As
Fig. 5 miRNA profile and validation. Heat map of miRNAs differentially expressed in CDM15 versus CON at day 0 (CDM15vsCON(d0)-miRNAs) (a) and at day 3 (CDM15vsCON(d3)-miRNAs) (d): the expression level of these miRNAs was also checked in CDM13 (third column). Relative miR5p, -10b-5p, -143, -145-5p (b) and AKT protein (c) expression levels in CON, CDM13, and CDM13 at day 0 . Data were normalized using U6 or αtubulin for miRNAs and AKT protein, respectively. Results are expressed as mean ± SD of at least three independent experiments and data analyzed by Student’s t-test (*P < 0.05, **P < 0.01, ***P < 0.001) . The significance was calculated in CDM13 or CDM15 day 0 versus CON day 0
expected, the most significant differences between CDM15 and CDM13/CON were found at day 3, when the differentiation program is fully activated and many of the so-called myo-miRNAs were induced in the two types of differentiating myoblasts (CON/CDM13) but not in CDM15 (Fig. 5d). In line with these results, CDM15 myoblasts shifted to differentiation medium were unable to upregulate MYOD, one of the master myogenic
transcription factors that controls miR-1-3p, miR-133a-3p, miR-133b, and miR-206 expression. Interestingly, Amack et al.30 reported that defective myogenic differ-entiation of C2C12 murine myoblasts expressing expan-ded CTG repeats was associated with an absence of MYOD at the protein level although MYOD mRNA expression was normal. On the contrary, we found that in CDM15 MYOD was poorly induced both at the protein
Fig. 6 Expression analysis of miRNAs and genes related to differentiation. Relative expression level quantification determined by qRT-PCR of miR-1-3p (a), miR-206 (b), MYOD mRNA (c), and protein (d) during the exposure to differentiation medium (days 0––5) and of miR-155-5p (e) and MEF2A (f) at day 3. The relative expression was evaluated with respect to CON at day 0 for (b–d) and with respect to CON at day 3 for (e) and (f). Data were normalized using U6, αtubulin or the geometric mean of three reference genes (GUSB, TBP and RPS18) for miRNAs, proteins and MYOD/MEF2A mRNAs respectively. Results are expressed as mean ± SD of at least three independent experiments and data analyzed by Student’s t-test (*P < 0.05, **P < 0.01, ***P < 0.001). The significance was calculated in CDM13 or CDM15 versus CON for each day
and mRNA levels, possibly due to increased mRNA decay, although inhibition of transcription cannot be ruled out.
Some of the miRNAs (Fig.5d) belonging to the Gtl2-Dio3 miRNA mega cluster, fundamental for skeletal muscle regeneration14 and controlled by MEF2A, were downregulated, suggesting that, along with MYOD, the MEF2A transcription network of CDM15 myoblasts might also be altered. Finally, we wish to point out that 10 out of 23 upregulated miRNAs in CDM15vsCON(d3) (miR-199a, -145, -143, -28, -221-3-p, -221-5-p, -222-3p, -222-5p, -100, -155) were also found upregulated in many primary muscular disorders including Duchenne mus-cular dystrophy31.
Our data indicate that a marked increased autophagy and aberrant differentiation are not necessarily connected. Indeed, CDM13, which differentiated as well as control myoblasts, underwent increased autophagy to the same extent as CDM15 myoblasts. We wish to point out that in our system two levels of autophagy induction were evi-dent: a physiological and an aberrant one. In all tested myoblasts, we found autophagic vacuoles at day 0 undergoing an enlargement by day 3, indicating that a certain increase of autophagy takes place as a “physiolo-gical” mechanism necessary for differentiation9. As far as LC3 activation is concerned we did not observe any activation in CON myoblasts at day 3, as previously
Fig. 7 Analysis of interferon type 1 pathway. Relative expression level quantification of IRF7 (a), STAT1 (b), OAS1 (c), OAS2 (d), OAS3 (e), and mPGES-1 (f) after the exposure to differentiation medium (days 0–5). The relative expression was evaluated with respect to CON at day 0. Data were normalized and analyzed as described infigure 6, and were expressed as mean ± SD of at least three independent experiments
Fig. 8 Myogenic differentiation after IRF7 and TLR3 silencing. (a) Images of CON, CDM13, and CDM15 myoblasts exposed to three days of differentiation medium after IRF7 (siIRF7), TLR3 (siTLR3), and control (siCT) silencing (dd3) (Giemsa staining). (b) Percentage of myotubes and average number of nuclei per myotube in CON and CDM myoblasts at dd3 evaluated as described in Fig.1. Relative expression level of MYOD (c), OAS1 (d), MEF2A (e), and miR-155-5p (f) in CON, CDM13, and CDM15 myoblasts dd3 versus the respective dd0 (dd0 is the time point after the end of transfection and before the exposure to differentiation medium). Normalization and statistical analysis were done as described in Fig.6. The significance was calculated in siIRF7 dd3 and siTLR3 dd3 samples versus siCT dd3
reported in another human control foetal myoblast4. LC3 activation was only visible in CDM1 myoblasts con-comitant with an abnormal increase of autophagy, which appears to be independent from differentiation as it also occurs in aberrantly differentiating CDM15. This patho-logical increase of autophagy could contribute to the marked reduction of muscle mass observed in CDM1 patients, a feature that has been also reported in DM1 patients32.
Finally, our study indicated that the abnormal differ-entiation observed in CDM15 myoblasts was associated with p53 upregulation, the presence of a stressed RER, and the activation of the IFN1 pathway. Thefindings that the IFN1-positive regulator IRF7, the downstream effector STAT1 and the IFN1-regulated genes OAS 1, OAS 2, and OAS 3, increased many fold in CDM15 compared to CON/CDM13 indicated a marked upregulation of IFN1 pathway (innate immune response). The product of the induced OAS enzymes is the small oligonucleotide 2′–5′ oligo A, which in turn activates the latent endor-ibonuclease RNase L, leading to degradation of RNA including cellular mRNAs33. Therefore, the activation of the interferon pathway and the consequent upregulation of the OAS gene family in CDM15 myoblast, could be responsible for the poor induction of MYOD mRNA. Interestingly, the activation of the 2′–5′ oligoadenylate/ RNase pathway has been shown to delay C2C12 myo-blasts differentiation via degradation of MYOD mRNA34. Activation of interferon-regulated genes has been observed in lens epithelium from DM1 patients35. These authors hypothesized that toxic dsRNAs containing expanded CUG repeats might trigger the IFN1 response, analogously to RNA viruses. Although mutant mRNA is usually localized in foci within the nucleus of DM1 cells2,17, these foci undergo dynamic changes during the cell cycle (mitosis), resulting in cytoplasmic localiza-tion20where dsRNA could be detected by dsRNA-specific receptors (such as the Toll-like receptor 3, TLR3)36and induce the IFN1 pathway. As the activation of IFN1 response in CDM15 appeared to be causatively correlated to myogenesis inhibition, we tried to inhibit this response by silencing two genes acting at different levels of the IFN1 pathway, namely TLR3 and the downstream master regulator of IFN1 IRF729, strongly upregulated in CDM15. Interestingly, the transient silencing of the two genes before shifting CDM15 into differentiating medium sig-nificantly ameliorated myogenesis, measured as the numbers of myotubes, without detectable effects in CON myoblasts. It is noteworthy that IRF7 silencing induced a number of myotubes comparable to control and a sig-nificant increase of MYOD and MEF2A mRNAs, the two transcription factors essential for myogenesis; con-comitantly, there was a drastic reduction of OAS1, as expected if IFN1 was inhibited. These data confirm the
powerful contribution of the IFN1 pathway activation to the impairment of myogenesis in CDM15 myoblasts. However, while the silencing of both IRF7 and TLR3 appear to be efficient, the rescue of differentiation was more pronounced after IRF7 inhibition. A possible explanation is that TLR3 is not the only member of the Toll-like receptors family responding to dsRNA37 and hence its inhibition may not result in the total reduction of dsRNA sensors. Finally, the inhibition of the IFN1 pathway did not significantly change miR-155-5p level, suggesting that in this context this miRNA is neither controlled by the IFN1 pathway nor does it regulate MEF2A.
Interestingly, the hyper-methylation of the CTCF I regions of CDM15/CDM13 myoblasts correlated with decreased DMPK antisense transcription in both CDM, suggesting that in our case, unlike the report of Nakamori et al.27, the transcriptional deregulation of sense/antisense transcription does not explain the more severe phenotype of CDM15.
At present, we can only speculate why CDM13 myo-blasts do not activate the IFN1 response. We did notfind any interspersed repeats in the CTG tract of CDM13 that could have explained the less severe phenotype. However, these myoblasts did not show signs of cellular stress during differentiation (enlarged RER and p53 upregula-tion) as found in CDM15. One possible explanation is that the 1800 GUG sequence in CDM13 does not form stable toxic dsRNA structures. The other possibility is that the majority of dsRNAs remain localized in the nucleus, never reaching the cytoplasm to activate the innate immune response.
In conclusion, our data show for the first time the miRNA profile of human CDM1 and control foetal myoblasts, and confirm the relevance of miRNAs in myogenesis. Our results suggest that the congenital phenotype, ascertained by triplet numbers and methylation pattern, could be more complex than expected to the extent that IFN1 activation might play a role in severe muscle pathogenesis, while yet unclarified mechanisms might lead to a less severe phenotype than predicted by current criteria (see CDM13). The results of silencing the IFN1 pathway are significant as they show rescue of aberrant myogenesis in CDM1 myoblasts; hopefully these in vitro results may lead to a better understanding of the molecular basis of this disease and identify potential targets in the search for innovative therapies.
Methods
Cell culture
Human myoblasts isolated from muscle biopsies obtained during autopsies of fetuses were obtained according to previously described methods38. Control and
CDM1 myoblasts with 1800 CDM13 and 3200 CDM15 repeats, respectively, were utilized at early passages (p 4) in order to avoid senescence. Myoblasts were seeded at a density of 12,000 cells/cm2 in HAM’s/F10 medium sup-plemented with 50 µg/ml fetuin, 5 µg/ml insulin, 10 ng/ml EGF, 0.5 mg/ml BSA, and 20% FBS (Euroclone). Medium was changed every day. When cells reached about 80% confluence (40,000–50,000 cells/cm2), differentiation to myotubes was induced by incubating the cells into a serum-free MEM (Euroclone) supplemented with 10 µg/ ml insulin and 0.5 mg/ml BSA. The number of myotubes (i.e. myoblasts with more than three nuclei) and the number of nuclei per myotube were evaluated after Giemsa staining.
Genotyping of the CDM13 myoblasts
Genomic DNA was extracted from myoblasts using a salting-out procedure. (CTG)n repeat expansion sizes were determined by long-PCR (LR-PCR), followed by hybridization with a (CTG)5 radioactively labelled probe39. Primers used for LR-PCR are indicated in Sup-plementary Table 6. Bidirectional TP-PCR analysis was also performed to exclude the presence of interruptions at the 5′ and 3′ ends of the CTG array5.
Methylation-sensitive high-resolution melting (MS-HRM) Two hundred nanograms of DNA isolated with DNAeasy blood and tissue kit (Qiagen) were treated with EpiTech Bisulfite kit (Qiagen) according to the manufacturer's instruction. The high-resolution melt-ing analysis was performed usmelt-ing the CFX96 thermal cycler (Biorad). The primers used for the HRM analysis were described in Santoro et al.6 with some modifica-tions (Supplementary Table 6). The reaction mix (total volume 10 µl) contained 0.5 µM primers (Eurofin), 5 µl EpiTect HRM master mix (Qiagen), and 10 ng of treated DNA. The PCR conditions were as follows: an initial denaturation at 95 °C for 12 min, 60 cycles of 30 s denaturation at 95 °C, 30 s of annealing, and 30 s of extension at 72 °C, followed by an HRM step of 95 °C for 10 s, 50 °C for 1 min, 65 °C for 15 s, and continuous acquisition to 95 °C at one acquisition per 0.2 °C. Annealing temperatures used for UR1, UR2, UR3, DR1, and DR2 MS-HRM analyses were 63.3, 59, 63.3, 55, and 55.7 °C, respectively. For the UR3 region the HRM protocol was applied after a pre-amplification step performed with GoTaq DNA polymerase (Promega) using 20 ng bisulfite-treated DNA in 25 µl final volume with the following PCR conditions: 5 min of an initial denaturation step at 95 °C, 40 cycles of 30 s 95 °C, 30 s 58 °C, 30 s 72 °C and afinal step at 72 °C for 5 min. Fully methylated and unmethylated DNA (EpiTect methy-lated and unmethymethy-lated human control DNA, bisulfite converted, Qiagen) was mixed to obtain the following
ratios of methylation: 0%, 12.5%, 25%, 50%, 100%. In order to obtain single methylation percentage values from MS-HRM assays, rather than a range, we applied an interpolation method developed in our laboratory40.
Western blot analysis
Cell lysates were prepared as previously described4. Samples were loaded on 10–12% polyacrylamide gels and then transferred to nitrocellulose membranes (Amersham Biosciences). The blots were blocked with 5% skimmed milk (Amersham) in TBST. Anti-ATG5 (A0856) (1:2000), anti-ATG7 (A2856) (1:1000), anti-LC3I-II (L8918) (1:1500), anti-αtubulin (T5168) (1:8000) obtained from Sigma, and anti-p53 (DAKO, M1001) (1:2000), anti-p-p70S6 kinase (p-S6k1) (Santa Cruz, sc-7984-R) (1:500) and anti-AKT (Cell Signalling, 9272) (1:1000) were used. Incubations were performed overnight at 4 °C and bands were revealed, after incubation with the recommended secondary antibody by the chemiluminescence method (Amersham) with X-OMATfilm (Kodak). Densitometric analysis of developed blots was performed with the Quantity One program. Results are expressed as mean ± SD of at least three independent experiments and data analyzed by Student’s t-test (*P < 0.05, **P < 0.01, ***P < 0.001).
Electron microscopy analysis
Myoblasts from each experimental group were fixed in 2.5% glutaraldehyde in 0.1 M phosphate buffer, pH 7.3, for 20 min at room temperature, washed in the same buffer, and postfixed in 1% osmium tetroxide in 0.1 M phosphate (pH 7.3) for 1 h at room temperature, and dehydrated in graduated series of ethanol. During the last dehydration step, the cells were scraped and the cell suspensions were centrifuged to obtain pellets. These pellets were then transferred into propylene oxide and embedded in PolyBed 812 (Polyscience Inc., Warrington, PA, USA) and polymerized at 60° for 72 h. Ultrathin sections (60–80 nm), obtained with a Reichert-Jung Ultracut E (Austria) equipped with a diamond knife, were collected on 200-mesh formar/ carbon-coated copper grids, double stained with aqu-eous uranyl acetate and lead citrate, and examined with a Jeol 100 SX transmission electron microscope oper-ating at 80 kV.
Morphometric analysis: assessment of autophagic vacuoles
In our experimental setting, we took advantage of cellular pellets because ultrathin sections contain ran-domly oriented cells, which is an appropriate condition for quantitative calculation41,42. For ultrastructural morphometry non-serial ultrathin sections were
obtained for each experimental group as described above. Ultrathin sections were examined directly at the transmission electron microscopy at 5000X magnifica-tion in order to estimate the number of autophagic vacuoles (AV) per cell. AVs were identified as double-membraned structures (compartments) containing altered cytoplasmic organelles or cytosolic material43. At least three grids were examined for each experi-mental group and 50 cells were scored for each sample. For the diameter evaluation, a minimum of 100 vacuoles were examined at each time point. The comparison among groups was performed with the multifactor analysis of variance, MANOVA. The vacuole diameter (Table 1) was determined using ImagJ. A minimum of 25 myoblasts were selected and at least 100 vacuoles were examined. The significance was determined by ANOVA.
siRNAs transfection
CON, CDM13, and CDM15 myoblasts were transfected in six-well plate format with lipofectamine RNAiMAX (Life Technologies) using siTLR3 (TLR3 silencer selected validate siRNA, s235, Ambion), siIRF7 (IRF7 silencer selected pre-designed siRNA, s194563, Ambion), and siCT (silencer negative control, 4390843, Ambion) as control. Cells were transfected with 6 µl of lipofectamine and 25 pmol of siRNAs following the manufacturer's instruction. After 10 h (dd0) the medium was changed and cells exposed to differentiation medium for 3 days (dd3).
Quantification of miRNAs and mRNAs (qRT-PCR)
Total RNA was extracted from 1 × 10⁶ myoblasts using the miRNeasy mini kit (Qiagen) following the manufacturer’s recommendations. One microgram of total RNA was retrotranscribed using either the miS-cript II RT kit (Qiagen) or the SuperSmiS-cript-VILO cDNA Synthesis Kit (Invitrogen) for miRNAs or mRNAs quantification, respectively. The reverse tran-scription was performed following the manufacturer’s instructions. miRNAs and mRNAs were quantified with Rotor-Gene Q 2plex (Qiagen), using the miScript SYBR Green PCR Kit (Qiagen) according to the pro-tocol indicated by the manufacturer. The relative quantification was performed using the Rotor-Gene Q Software, normalizing to the internal controls: U6 was used for miRNAs and the geometric mean of three reference genes (GUSB, TBP, and RSP18)44,45, whose expression did not change significantly during myo-blasts differentiation, was used for mRNAs. Results are expressed as mean ± SD of at least three independent experiments and data analyzed by Student’s t-test (*P < 0.05, **P < 0.01, ***P < 0.001). The primers used are shown in Supplementary Table 6.
The quantification of DMPK sense/antisense tran-scripts level was performed as described by Michel et al.46 with some modifications. Briefly, total RNAs were retrotranscribed with QuantiTect Reverse Transcription kit (Qiagen) using specific primers for sense and antisense retrotranscription. The relative levels of sense or antisense transcripts were normalized to the mean of three reference genes as explained above.
miRNA profiling with next generation sequencing (NGS) technology (smallRNA-seq)
NGS was performed on RNA extracted from two bio-logical replicates of CON, CDM13, and CDM15 myo-blasts at day 0 and at day 3, before and after shift into differentiation medium. The cDNA libraries were con-structed using TrueSeq Small RNA kit (Illumina) according to the manufacturer’s suggestions. cDNA libraries were loaded at six-plex level of multiplexing (~4 million reads per sample) into a V3 flow cell, and sequenced in single-reads mode (50 bp) on a MiSeq sequencer (Illumina).
NGS data analysis
Pre-miRNA sequences from miRBase v.21 (http://www.
mirbase.org/) were identified from raw sequences as
previously described47 using miRExpress tool v.2.1.348. The miRNomes of each sample were analyzed using Bioconductor’s package DESeq249. Specifically, the
origi-nal raw count data werefirst scaled for library size factors and regularized log transformed (rlog function) for the principal component analysis, then they were used to test for differential expression after per gene dispersion esti-mation. A fold change (FC) of 2 was used to select modulated miRNAs, with P-adjusted for multiple testing < 0.05 (Benjamini and Hochberg procedure).
Target genes and pathways analysis
To identify genes that are targets of modulated miRNAs and to investigate altered pathways in CON, CDM13, and CDM15 myoblast cells we exploited the miRNet web-based tool (http://www.mirnet.ca)50. MiRNet includes a comprehensive collection of high-quality and experi-mentally validated miRNA-target interaction data from 11 databases. We identified targets of modulated miRNAs and performed their functional enrichment analysis for KEGG and Reactome pathways using the more suitable empirical sampling-based approach described by Bleazard et al.51and implemented by miRNet. This method is more suitable for miRNAs-target genes since it takes into account the fact that each miRNA has the potential to target hundreds of different genes, while common enrichment analysis methods assume that genes are selected uniformly at random from afinite population. A
p-value ≤ 0.005 was considered statistically significant in this case.
Acknowledgements
We would like to thank Drs. Letizia Pitto and Michael Anthony Minks for critical reading and editing of the manuscript. This work was supported by AFM Telethon project number 16215 (PI Dr. Marcella Simili) and partially by Tuscany Region (ITT grant 2013-Dr. Rizzo). We are also grateful to Dr. Vittoria Carnicelli for helping in the DMPK methylation profile. M.S. would like to dedicate this paper to the late Prof. Corrado Baglioni and his Interferon group of the seventies (SUNY Albany) in which she developed a lifelong interest in interferon action, which shaped the focus of this paper.
Author details
1Institute of Clinical Physiology (IFC), CNR, Pisa, Italy.2Istituto Toscano Tumori
(ITT), Firenze, Italy.3Department of Translational Research and New
Technologies in Medicine and Surgery, University of Pisa, Pisa, Italy.
4
Department of Clinical and Experimental Medicine, Unit of Experimental Biology and Genetics, University of Pisa, Pisa, Italy.5Institute of Biophysics (IBF),
CNR, Pisa, Italy.6Laboratory of Integrative Systems Medicine (LISM), Institute of Informatics and Telematics (IIT) CNR, Pisa, Italy.7Department of Biomedicine
and Prevention, Medical Genetics Section, Tor Vergata University of Rome, Rome, Italy.8Department of Translational Research and New Technologies in
Medicine and Surgery, Laboratory of Medical Genetics, University of Pisa, Pisa, Italy.9Sorbonne Université, INSERM, Association Institut de Myologie, Centre de
Recherche en Myologie, F-75013 Paris, France
Conflict of interest
The authors declare that they have no conflict of interest. Publisher's note
Springer Nature remains neutral with regard to jurisdictional claims in published maps and institutional affiliations.
Supplementary Information accompanies this paper at (https://doi.org/ 10.1038/s41419-018-1080-1).
Received: 5 March 2018 Revised: 21 August 2018 Accepted: 22 August 2018
References
1. Ho, G., Cardamone, M. & Farrar, M. Congenital and childhood myotonic dystrophy: current aspects of disease and future directions. World J. Clin. Pediatr. 4, 66–80 (2015).
2. Turner, C. & Hilton-Jones, D. Myotonic dystrophy: diagnosis, management and new therapies. Curr. Opin. Neurol. 27, 599–606 (2014).
3. Bachinski, L. L. et al. Most expression and splicing changes in myotonic dys-trophy type 1 and type 2 skeletal muscle are shared with other muscular dystrophies. Neuromuscul. Disord. 24, 227–240 (2014).
4. Beffy, P. et al. Altered signal transduction pathways and induction of autop-hagy in human myotonic dystrophy type 1 myoblasts. Int. J. Biochem. Cell. Biol. 42, 1973–1983 (2010).
5. Santoro, M., Masciullo, M., Silvestri, G., Novelli, G. & Botta, A. Myotonic dys-trophy type 1: role of CCG, CTC and CGG interruptions within DMPK alleles in the pathogenesis and molecular diagnosis. Clin. Genet. 92, 355–364 (2017).
6. Santoro, M. et al. Expansion size and presence of CCG/CTC/CGG sequence interruptions in the expanded CTG array are independently associated to hypermethylation at the DMPK locus in myotonic dystrophy type 1 (DM1). Biochim. Biophys. Acta 1852, 2645–2652 (2015).
7. Barbe, L. et al. CpG methylation, a parent-of-origin effect for maternal-biased transmission of congenital myotonic dystrophy. Am. J. Hum. Genet. 100, 488–505 (2017).
8. Fornai, F. et al. Methamphetamine produces neuronal inclusions in the nigrostriatal system and in PC12 cells. J. Neurochem. 88, 114–123 (2004).
9. Fortini, P. et al. Thefine tuning of metabolism, autophagy and differentiation during in vitro myogenesis. Cell Death Dis. 7, e2168 (2016).
10. Ozcan, L. & Tabas, I. Role of endoplasmic reticulum stress in metabolic disease and other disorders. Annu. Rev. Med. 63, 317–328 (2012).
11. Ge, Y. & Chen, J. Mammalian target of rapamycin (mTOR) signaling network in skeletal myogenesis. J. Biol. Chem. 287, 43928–43935 (2012).
12. Horak, M., Novak, J. & Bienertova-Vasku, J. Muscle-specific microRNAs in ske-letal muscle development. Dev. Biol. 410, 1–13 (2016).
13. Alteri, A. et al. Cyclin D1 is a major target of miR-206 in cell differentiation and transformation. Cell Cycle 12, 3781–3790 (2013).
14. Snyder, C. M. et al. MEF2A regulates the Gtl2-Dio3 microRNA mega-cluster to modulate WNT signaling in skeletal muscle regeneration. Development 140, 31–42 (2013).
15. Seok, H. Y. et al. miR-155 inhibits expression of the MEF2A protein to repress skeletal muscle differentiation. J. Biol. Chem. 286, 35339–35346 (2011).
16. Kruiswijk, F., Labuschagne, C. F. & Vousden, K. H. p53 in survival, death and metabolic health: a lifeguard with a licence to kill. Nat. Rev. Mol. Cell Biol. 16, 393–405 (2015).
17. Pettersson, O. J., Aagaard, L., Jensen, T. G. & Damgaard, C. K. Molecular mechanisms in DM1 - a focus on foci. Nucleic Acids Res. 43, 2433–2441 (2015). 18. Sobczak, K., de Mezer, M., Michlewski, G., Krol, J. & Krzyzosiak, W. J. RNA structure of trinucleotide repeats associated with human neurological dis-eases. Nucleic Acids Res. 31, 5469–5482 (2003).
19. Schoggins, J. W. Interferon-stimulated genes: roles in viral pathogenesis. Curr. Opin. Virol. 6, 40–46 (2014).
20. Xia, G. & Ashizawa, T. Dynamic changes of nuclear RNA foci in proliferating DM1 cells. Histochem. Cell. Biol. 143, 557–564 (2015).
21. Multhauf, C. & Lough, J. Interferon-mediated inhibition of differentiation in a murine myoblast cell line. J. Cell Physiol. 126, 211–215 (1986).
22. Honda, K. et al. IRF-7 is the master regulator of type-I interferon-dependent immune responses. Nature 434, 772–777 (2005).
23. Antao-Menezes, A., Turpin, E. A., Bost, P. C., Ryman-Rasmussen, J. P. & Bonner, J. C. STAT-1 signaling in human lung fibroblasts is induced by vanadium pentoxide through an IFN-beta autocrine loop. J. Immunol. 180, 4200–4207 (2008).
24. Hovanessian, A. G. & Justesen, J. The human 2′–5′ oligoadenylate synthetase family: unique interferon-inducible enzymes catalyzing 2’-5’ instead of 3′–5′ phosphodiester bond formation. Biochimie 89, 779–788 (2007).
25. Fuse, A., Mahmud, I. & Kuwata, T. Mechanism of stimulation by human interferon of prostaglandin synthesis in human cell lines. Cancer Res. 42, 3209–3214 (1982).
26. Beaulieu, D. et al. Abnormal prostaglandin E2 production blocks myogenic differentiation in myotonic dystrophy. Neurobiol. Dis. 45, 122–129 (2012). 27. Nakamori, M. et al. Aberrant myokine signaling in congenital myotonic
dys-trophy. Cell Rep. 21, 1240–1252 (2017).
28. Kawai, T. et al. Interferon-alpha induction through Toll-like receptors involves a direct interaction of IRF7 with MyD88 and TRAF6. Nat. Immunol. 5, 1061–1068 (2004).
29. Ning, S., Pagano, J. S. & Barber, G. N. IRF7: activation, regulation, modification and function. Genes Immun. 12, 399–414 (2011).
30. Amack, J. D., Reagan, S. R. & Mahadevan, M. S. Mutant DMPK 3′-UTR transcripts disrupt C2C12 myogenic differentiation by compromising MyoD. J. Cell Biol. 159, 419–429 (2002).
31. Eisenberg, I. et al. Distinctive patterns of microRNA expression in primary muscular disorders. Proc. Natl Acad. Sci. USA 104, 17016–17021 (2007). 32. Loro, E. et al. Normal myogenesis and increased apoptosis in myotonic
dys-trophy type-1 muscle cells. Cell Death Differ. 17, 1315–1324 (2010). 33. Brennan-Laun, S. E., Ezelle, H. J., Li, X. L. & Hassel, B. A. RNase-L control of cellular
mRNAs: roles in biologic functions and mechanisms of substrate targeting. J. Interferon Cytokine Res. 34, 275–288 (2014).
34. Bisbal, C. et al. The 2′–5′ oligoadenylate/RNase L/RNase L inhibitor pathway regulates both MyoD mRNA stability and muscle cell differentiation. Mol. Cell. Biol. 20, 4959–4969 (2000).
35. Rhodes, J. D. et al. Activation of the innate immune response and interferon signalling in myotonic dystrophy type 1 and type 2 cataracts. Hum. Mol. Genet. 21, 852–862 (2012).
36. Liu, L. et al. Structural basis of toll-like receptor 3 signaling with double-stranded RNA. Science 320, 379–381 (2008).
37. Kawai, T. & Akira, S. Toll-like receptors and their crosstalk with other innate receptors in infection and immunity. Immunity 34, 637–650 (2011).
38. Furling, D. et al. Defective satellite cells in congenital myotonic dystrophy. Hum. Mol. Genet. 10, 2079–2087 (2001).
39. Botta, A. et al. Italian guidelines for molecular analysis in myotonic dystrophies. Acta Myol. 25, 23–33 (2006).
40. Migheli, F. et al. Comparison study of MS-HRM and pyrosequencing techni-ques for quantification of APC and CDKN2A gene methylation. PLoS One 8, e52501 (2013).
41. Yla-Anttila, P., Vihinen, H., Jokitalo, E. & Eskelinen, E. L. Monitoring autophagy by electron microscopy in Mammalian cells. Methods Enzymol. 452, 143–164 (2009).
42. Lenzi, P. et al. A subcellular analysis of genetic modulation of PINK1 on mitochondrial alterations, autophagy and cell death. Arch. Ital. Biol. 150, 194–217 (2012).
43. Levine, B. & Klionsky, D. J. Development by self-digestion: molecular mechanisms and biological functions of autophagy. Dev. Cell 6, 463–477 (2004).
44. Tatsumi, K. et al. Reference gene selection for real-time RT-PCR in regenerating mouse livers. Biochem. Biophys. Res. Commun. 374, 106–110 (2008).
45. Krainova, N. A. et al. Evaluation of potential reference genes for qRT-PCR data normalization in HeLa Cells. Appl. Biochem Micro+ 49, 743–749 (2013).
46. Michel, L., Huguet-Lachon, A. & Gourdon, G. Sense and Antisense DMPK RNA foci accumulate in DM1 tissues during development. PLoS One 10, e0137620 (2015).
47. Bascetta L., et al. The prostate cancer cells resistant to docetaxel as in vitro model for discovering microRNAs predictive of the onset of docetaxel resis-tance. Int. J. Mol. Sci. 18, 1512 (2017).
48. Wang, W. C. et al. miRExpress: analyzing high-throughput sequencing data for profiling microRNA expression. BMC Bioinforma. 10, 328 (2009).
49. Love, M. I., Huber, W. & Anders, S. Moderated estimation of fold change and dispersion for RNA-seq data with DESeq2. Genome Biol. 15, 550 (2014).
50. Fan, Y. N. et al. miRNet - dissecting miRNA-target interactions and functional associations through network-based visual analysis. Nucleic Acids Res. 44(W1), W135–W141 (2016).
51. Bleazard, T., Lamb, J. A. & Griffiths-Jones, S. Bias in microRNA functional enrichment analysis. Bioinformatics 31, 1592–1598 (2015).