HAL Id: halshs-01619436
https://halshs.archives-ouvertes.fr/halshs-01619436
Submitted on 19 Oct 2017HAL is a multi-disciplinary open access archive for the deposit and dissemination of sci-entific research documents, whether they are pub-lished or not. The documents may come from teaching and research institutions in France or abroad, or from public or private research centers.
L’archive ouverte pluridisciplinaire HAL, est destinée au dépôt et à la diffusion de documents scientifiques de niveau recherche, publiés ou non, émanant des établissements d’enseignement et de recherche français ou étrangers, des laboratoires publics ou privés.
Multilayer dynamics of complex spatial networks: The
case of global maritime flows (1977–2008)
César Ducruet
To cite this version:
César Ducruet. Multilayer dynamics of complex spatial networks: The case of global mar-itime flows (1977–2008). Journal of Transport Geography, Elsevier, 2017, 60, pp.47-58. �10.1016/j.jtrangeo.2017.02.007�. �halshs-01619436�
Multilayer dynamics of complex spatial networks: the case of
global maritime flows (1977-2008)
César Ducruet, PhD
Research Director, French National Centre for Scientific Research (CNRS)
UMR 8504 Géographie-cités, 13 rue du Four, F-75006 Paris, France
This is the draft version of the article published in Journal of Transport Geography, Vol.
60, pp. 47-58.
Abstract
This article investigates the degree of overlap among the different layers of circulation composing global maritime flows in recent decades. Mobilizing several methods originating from complex networks allows us to shed new light on specialization and diversification dynamics affecting the evolution of ports and shipping. The principal confirm the strong and path-dependent influence of multiplexity on traffic volume, range of interaction and centrality from various perspectives, such as matrices correlations, homophily, assortativity, and single linkage analysis. While the network grows and concentrates around large hubs over time, traffic distribution is also place-dependent due to the reinforced position of already established nodes.
Keywords: assortativity; homophily; maritime transport; path-dependency; port; spatial
1. Introduction
One of the most challenging issues of current network science is to better understand the structure and evolution of multiplex networks, namely complex systems made up of several layers (D’Agostino and Scala, 2014; Garas, 2016). The basic definition of a multiplex network is the possibility for nodes to be connected by two or more links of a different nature. One typical example in transport studies is the multimodal network comprising various combinations of transport modes between terminals or cities (i.e. road, rail, air, sea), such as a corridor, but other examples can be found in other contexts such as in social networks (i.e. friendship and professional ties). Whereas the analysis of multiplex networks had been the focus of numerous studies in past decades and across all scientific disciplines, geographers have long remained focused on single (or uniplex) networks, such as roads and railways, despite early advances in the field back in the 1960s, when Gunnar Törnqvist, for instance, modeled a network made of both physical and information flows (see a review by Peris, 2016).
As seen in Table 1, recent works on multiplex spatial networks in geography predominantly focused on transport flows and networks, notwithstanding the inclusion of more informal or virtual relationships such as Internet or banking linkages among cities. These works widely differ in geographic scope, from national to global, and in methodology, from the use of vector or raster information in a Geographic Information System (GIS) to the application of graph theory, complex networks and simulation techniques to determine the interdependencies at stake among the different layers and nodes. Such diversity echoes the synthetic works by Boccaletti et al. (2014) and Kivelä et al. (2014) which underlined the lack of a comprehensive approach to multiplex networks and the corresponding terminology. Some recent advances about multiplex networks were made in the field of air transport (Cardillo et al., 2013)
This paper proposes to further develop our understanding of the multiplex properties of spatial networks, based on the analysis of maritime flows. It innovates in several ways in the broader
field of multiplex and spatial network research. First, it provides a dynamic empirical analysis of 32 consecutive years of network structure, while the majority of existing studies remain theoretical, based on simulation due to lack of data, and rather static. While the vast majority of maritime network analyses focused on container shipping (see Ducruet, 2015 for a review of the field), Table 1 points to a number of earlier studies of maritime networks from a multiplex perspective, but mainly as one of the different layers under consideration (Nelson, 2008; Parshani et al., 2010; Ducruet et al., 2011; Tavasszy et al., 2011). This paper adopts another perspective, namely the decomposition of the global maritime network as a multiplex entity in itself and its disaggregation across several layers, based on the fact that maritime transport relies on the circulation of diverse types of vessels and cargoes linking ports around the world. Maritime transport networks may thus be defined as one single network made of complementary layers or as a multiple networks having their own rationale. Such a perspective is rarely found in earlier studies. Kaluza et al. (2010) compared the network topologies of three different maritime layers created by the movements of tankers, cargo ships and containerships respectively but without examining their overlaps and interdependencies. Ducruet and Itoh (2015) confronted the specialization, topology, and complementarity of several maritime transport layers to the socio-economic features of the connected subnational regions in the Asia-Pacific area. The current paper is closer to an earlier article by Ducruet (2013) who investigated the interdependence of the five different layers composing maritime flows, thereby demonstrating the strong influence of multiplexity on port centrality and network topology. However, these works remained static and could not account for a dynamic view on the evolution of multiplexity.
Investigating the dynamics of multiplex networks in the context of shipping and ports raises a number of questions specific to this area that also have the potential to foster progress in other research domains. In terms of layers, maritime transport is often seen as an aggregate of
incompatible logics, from passenger flows using cruise or ferry ships to the transport of minerals, oil, containers or automobiles by bulk ships. Such layers serve different trades, use different handling facilities and related technologies, and therefore different ships and terminals, notably since the period of specialization (Mayer, 1973). In addition, these layers behave differently as they are based either on tramp shipping for bulks, with on-demand voyages from origin to destination market, or on regular schedules for containers (liner shipping). These differences are thus reflected in the respective geographic coverage of their network patterns (Kaluza et al., 2010) and reinforced by the geographic scope of their activity; ferries, for instance, travel shorter distances within seas or basins while bulks and containers are more transoceanic and deep-sea. Yet, the ocean-space where ships move remains constrained by the shape of coastlines and the location of ports, which forces maritime flows to converge at certain passages and corridors, such as canals and straits. The global maritime network can thus be defined as one composite system serving trade and mobility through different albeit complementary technological means. This motivates the search for interdependencies among its various layers, notably from an evolutionary perspective, and questions the effects of specialization and technological change on maritime network design. In other words, each layer (bulk, containers) can be seen as a transport system on its own, namely an individual network, from an operational perspective in terms of shipping and cargo handling technologies. Yet, this paper adopts a broader economic geography perspective to the maritime network as one single transport system composed of interdependent and complementary layers serving world trade and mobility, and as one segment only within the broader value chain (Robinson, 2002).
When it comes to ports, the question of research takes another meaning. As in all spatial networks, such nodes cannot grow and multiply their connections ad infinitum due to lack of space for infrastructure expansion, cost, and related congestion issues. Ports went through
successive phases of adaptation to changing shipping technologies, resulting in a spatial distribution of separated port functions based on the construction of specialized terminals and new ports. Yet, the limited number of easily accessible port sites (Rodrigue et al., 2013) and the economic gains fostered by economies of scale motivated certain nodes to keep concentrating maritime traffic and become multifunctional, sometimes at the expense of smaller and more specialized ones. Traffic diversity, or the ability of ports to capture a great variety of flows, can thus be seen as an essential component of port competitiveness. However, this dimension has rarely been addressed per se, despite the early recognition that larger ports often exhibit a diversified portfolio as a reflection of their wider overseas linkages and more complex local economic structure (Carter, 1962; Kenyon, 1970). Through attracting diverse maritime flows, ports capture value through jobs and related companies, and reduce their exposure to market and trade fluctuations (Ducruet et al., 2010; Ducruet and Itoh, 2016). In turn, diversification is not the sole strategy of ports; some of them were proactive in adopting containerization, which is considered to be the most valuable traffic, while others strived for specialization in their core function, such as automobile imports (Hall, 2004). Many factors, such as location and hinterland accessibility, influence such strategies as not every port can become a multifunctional hub, a typical case being ports fully dependent on the exploitation of a particular natural resource.
Throughout academic and professional literature, it remains unclear whether port specialization or diversification as processes are path-dependent and place-dependent (see Neffke et al., 2011 on the case of regions); in other words, we need to further understand how port nodes are embedded in diverse maritime layers and if so, how this evolves over time. Existing literature on complex networks, which suggests a high probability of new links connecting already established and larger nodes through a preferential attachment process (Barabasi and Albert, 1999), is well reflected in the case of port system evolutionary models, where shipping flows
become increasingly concentrated at the main pivotal hub along a given range, which is often the best candidate for adopting technological innovations (Wand and Ducruet, 2013). This recalls in many ways the innovation diffusion processes modeled by Hägerstrand (1952) based on the key factors of proximity and hierarchy. However, diseconomies of scale are likely to appear in such load centers (Hayuth, 1981) for the reasons cited above, encouraging traffic de-concentration and relocation to smaller or new ports, which grow through specialization and may later diversify. The goal of this paper is not to fully explain traffic variety per se, but rather, to observe its distribution and evolution from a network perspective.
[Insert Table 1 about here]
This paper continues as follows: the next section introduces the data necessary to analyze global maritime flows and their evolution over 32 years in the form of a graph or network. The subsequent section is the core of the analysis, where we test a number of methods to describe the changing distribution and interdependency of six maritime layers by looking at both nodes and links. The conclusion discusses the outcomes of this study and its contribution to both transport and network studies.
2. Data and methodology of multiplex network construction
The primary source of data on the changing distribution and pattern of global shipping flows is
Lloyd’s List Intelligence (LLI), a world leader in maritime insurance and information. This data
consists in daily merchant vessel movements among ports of the world, including arrival and departure dates, vessel capacity in deadweight tons (DWT), and vessel type. The study period of 32 consecutive years (1977-2008) permits the examination of the stability of the results over time and the verification of how traffic variety has evolved alongside major economic,
geographic, and technological changes affecting global maritime trade. The year of its commencement preceded the opening up of China and the operation of Hong Kong’s first container terminal, as key economic and technological events, while its final year preceded the global financial crisis and its immediate effects on world economy and shipping. For each year, four months of daily vessel movements were retained, namely March, June, September, and December, as a representative portion of total annual maritime activity. Our results thus correspond to the aggregation of these four complete months. Vessel movement data is different than trade data, so that its analysis focuses on the transport modes (vehicles) rather than exact products and commodities.
The original 159 vessel types were redistributed across six main categories (containers, general cargo, liquid bulks, passengers, solid bulks, and vehicles), excluding non-cargo vessels such as training, research, naval, dredger, buoy, cable, tug, depot, exhibition, hospital, mission, safety, patrol and mission ships1. The tonnage capacity of mixed type vessels was split accordingly
into two categories, such as bulk carriers, cargo ships, and roll on roll off carriers with container capacity, passenger ro-ro ferries, combined bulk and oil carriers, and combined ore and oil carriers. Traffic volumes correspond to the sum of vessel capacities for each movement and they concur with official figures published by the United Nations on world seaborne trade (UNCTAD, 2015), with a 0.99 correlation between the time series 1980-2008. While total tonnage had regularly grown over time, certain categories evolved differently. In absolute terms, bulks and general cargo accounted for the heaviest traffic in the early period, while containers went through rapid growth especially since the mid-1990s, ending up as the leading form of traffic in 2008. General cargo regularly declined, followed by vehicles and passengers.
1 All vessel types and their flows were measured in deadweight tons, which correspond to the cargo-related
capacity of the ships. This allowed for the inclusion of passenger vessels (cruise, ferry) to avoid the issue of unit differences (tons vs. people). One drawback is the underestimation of passenger volumes since passenger ships carry limited cargo amounts. Using Gross Registered Tons instead would have, on the contrary, overestimated such flows as this takes into account the entire ship volume in cubic meters, including all non-cargo spaces.
Such trends are particularly visible in relative terms, as containers expanded their share from 9% in 1977 to 35% in 2008, and general cargo declined from 17% to 4%. This can be explained by a double trend with container traffic literally exploding in this period, in line with growing global demand for moving manufactured goods, and more recently, due to the increasing containerization of general cargo, but also of bulks and even vehicles (Pelletier and Alix, 2004). Therefore, our approach based on vessel movements has the advantage of highlighting technological change, but with the drawback of overlooking the exact nature of the actual commodities being transported. Other categories have a stable share in comparison, except for liquid bulks, which also declined from 49% in 1977 to 32% in 2008. While the competition with pipelines is one possible explanation, other factors include the rise of nuclear and renewable energies.
[Insert Figure 1 about here]
Another important aspect of our methodology has been the construction of origin-destination matrices connecting world ports by vessel movements. Such adjacency matrices are defined by direct inter-port linkages created by the circulation of vessels, as defined by the Space-L in the work of Hu and Zhu (2009) and the graph of direct links (GDL) in that of Ducruet and Zaidi (2012). Ports are thus connected if they are adjacently called at by one or more vessels along their voyage, such as Rotterdam-Alexandria and Alexandria-Dubai, but excluding indirect linkages, such as Rotterdam-Dubai. The global maritime network is weighted by the cumulated vessel traffic capacity measured in nodes (ports) and links (inter-port flows). Such a perspective allows for the application of conventional network-analytical methods ensuing from graph theory and complex network research, with both global-level and node-level measures of
connectivity and centrality. In addition, links are differentiated according to their physical length or orthodromic distance in kilometers, based on the geographic coordinates of ports along each pair and taking into account the spatial dimension of flows. Such nodes and links are characterized by their number of traffic categories, and it is the main goal of this paper to test the influence of specialization or diversity on traffic distribution and network structure.
3. Main results
3.1 Traffic distribution
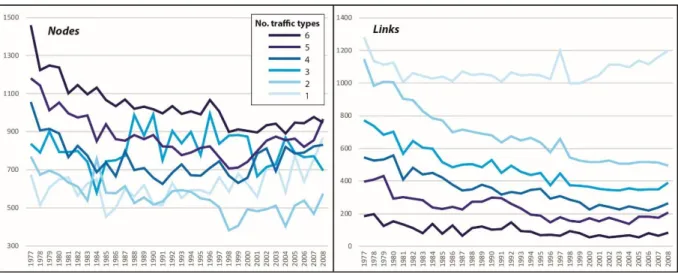
Before examining the effects of traffic diversity and specialization on its distribution, it is important to verify the evolution of traffic structure itself. The evolution of the average number of traffic types per node and link shows very interesting trends (Figure 2, left). Such a measure is coined global overlap in the case of links and local overlap in the case of nodes (Halu et al., 2014). A continuous process of diversification until the late 1990s is followed by a process of specialization, i.e. a declining average number of traffic types handled by the same nodes or links. A similarly close result was obtained by applying the method of Halu et al. (2014), that is the proportion of overlapped layers per node and per link. The percentage of nodes and links presenting at least two traffic types increased from 71% in 1977 to 73% in 2008, after reaching peak values of 78-79% in the late 1990s. This confirms that following a phase of specialization (Mayer, 1973), ports have become more multifunctional over time, either by adopting containerization across successive stages of innovation diffusion across the world (Guerrero and Rodrigue, 2014) or by entering other markets, such as cruise shipping or automobile manufacturing. Examples include a number of Mediterranean ports traditionally specialized in bulks serving local heavy industry complexes and being developed as transshipment hubs in the mid-1990s in a context of shipping line concentration and rationalization. In parallel,
already diversified ports have maintained a highly varied traffic mix, with the capacity to handle all sorts of commodities, such as large, global ports like Rotterdam or Singapore. The slowdown and stagnation of this process since the 2000s is due to a phase of specialization caused by two combined factors. The first corresponds to diseconomies of scale in large load centers, where lack of space for further port expansion forced them to get rid of certain traffic and focus on fewer cargo types, such as the growth of containers in Antwerp at the expense of general cargo. The second factor is the emergence of new ports and terminals dedicated to one specific mode of traffic, such as transshipment ports for containers, which did not attract other commodities and often locate far from main markets so that their hinterland is limited. Counter-examples exist, however, such as Tanger-Med handling containers and energy flows.
[Insert Figure 2 about here]
Despite these changes, complementary results show that the level of traffic specialization remains very stable (Figure 2, right), on the basis of initial 1977 values. Nodes and links that start out as very specialized or diversified tend to remain so over time. While initially specialized ports (1-2 traffic types) diversified more than others, initially diversified ports (4-6 traffic types) maintained their profile over time. In terms of links, a similar evolution occurred, but initially diversified links witnessed a gradual decrease. Such strong path-dependency is accompanied nevertheless by narrower gaps among the different categories of nodes and links at the end of the period studied. A redistribution of layers had taken place in the network, but without a deep transformation of its overall structure.
Layer distribution measured by tonnage, either by nodes or links, also exhibited a great stability over time (Figure 3). Although this does not appear in the figure, the most specialized ports
(one layer only) always constituted the most populous category, and their number increased rapidly (after a gradual drop until 1995) from 599 in 1996 to 849 in 2008. This confirms the previous analyses pointing to the emergence of dedicated ports and terminals in a context of load center congestion and port system de-concentration. The most diversified ports are the least populous and their share had only grown from 10.8% to 14.2% over the period, but they persistently occupied the world’s largest traffic share, which even increased from 49.8% in 1977 to 55.7% in 2008. In turn, the most specialized nodes had only grown from 2.3% to 3.6% of world traffic. One exception is ports handling three layers, whose share remained inferior to those handling only two.
The evolution of links is similar, the most specialized ones being the most numerous, but with a noticeable decline from 68% in 1977 to 59.2% in 2008, while all other categories have increased. Yet, while the most specialized links are also the most voluminous, the respective traffic share of one- and two-layer links decreased from 40.3% to 38% and from 24.1% to 15.5%, respectively. Such results confirm the aforementioned idea of a decreasing overlap between layers across the global network, due to operational and other matters affecting the changing distribution of maritime flows.
[Insert Figure 3 about here]
3.2 Link and node correlations
The extent to which network distribution is stable over time can be verified by linear (Pearson) correlations applied to nodes or links on the basis of their initial traffic weight in 1977 (Figure 4). Interestingly, layers exhibit contrasted evolutions. The container subnetwork had been the most stable, especially for links. This underlines the strong path-dependency of liner shipping
networks, since their distribution in 2008 remains somewhat comparable with that of 1977 (0.543), despite numerous changes occurring during the period in this rapidly growing sector. In comparison, other layers have gone through profound transformations, the earliest changes affecting liquid bulks, vehicles and passengers, especially from the perspective of nodes. General cargo and solid bulks maintained their distribution in the early period but rapidly changed from the late 1980s onwards. There are noticeable differences between links and nodes. For the latter, the correlation drop has not been as severe as for links: networks have evolved faster and deeper than the port hierarchy itself. This behavior is typical of non-planar networks where links may appear or disappear in more flexible ways than for planar (e.g. road, railway) networks, while the physical infrastructure of the nodes is more likely to remain stable. A feature common to both nodes and links is the higher stability of container and general cargo traffic, while the correlation for solid and liquid bulk traffic has decreased much more rapidly for nodes than for links. This underlines the fact that bulk shipping is by its essence more subject to market fluctuations than liner shipping, due to its on-demand function serving tramp trade. While the analysis of traffic correlations by pairs of layers based on nodes or links would go beyond the scope of the current work, it is interesting to note that containers and general cargo enjoyed the highest mutual correlation among all possible pairs, followed by general cargo / solid bulks, and liquid bulks / solid bulks. Yet, such correlations have been more stable for nodes than for links in the case of all layer pairs, while passengers and vehicles remain insignificantly correlated with other layers, given their specific operational aspects, such as cruise shipping networks relying on particular itineraries and seasonal factors (Rodrigue and Notteboom, 2013). The fact that the layer of containers is always the one that overlaps most with other layers prompts us to question the commonly accepted conception of liner shipping as set apart from the rest of the maritime network due to its commonly accepted unique network
design. In fact, container shipping has gradually expanded in a highly path-dependent manner at established nodes and along established routes.
[Insert Figure 4 about here]
3.3 Centrality, interaction range, and homophily
Several centrality measures were computed for each node in the global maritime network (Figure 5) and averaged per number of belonged layers to verify whether more diversified nodes are more favorably positioned than more specialized nodes. The results are relatively straightforward since network measures increase proportionally with the number of layers. Thus, traffic diversity is a very strong determinant of port connectivity. No particular temporal trends can be observed, as all classes followed more or less the same evolution and fluctuations. Notable is the wide gap between the most diversified ports and other ports, especially in terms of betweenness centrality, degree centrality, and clustering coefficient. Although the 6-layer ports only have one additional traffic type compared with 5-layer ports, the former have a much stronger connectivity than the latter.
Nevertheless, the most diversified ports saw their degree centrality declining over the period studied, from 148 to 104 connections on average, while the most specialized, albeit much less connected, slightly increased their average degree from 5 to 6. Average clustering coefficient declined slightly for the most diversified nodes, from 3.66 to 3.32, while the most specialized increased from 1.16 to 1.28. The relationship between traffic diversity and network centrality may have become weaker than in the past due to two main factors, namely globalization and containerization, which together fostered the emergence of very central intermediate hubs
specialized in fewer commodities, especially in the liner shipping business (Rodrigue and Notteboom, 2010).
[Insert Figure 5 about here]
One essential dimension of maritime networks is their spatial embedding (Gastner and Newman, 2006), as the length of their links is directly concerned with various costs such as fuel, maintenance and insurance. Space acts as a constraint to network growth, while at the same time it limits the interaction range (Barthelemy, 2015). In turn, spatial proximity influences the emergence, distribution, and weight of links while favoring short-range relationships (Ducruet and Beauguitte, 2014). In this paper, we investigate the interplay between layer diversity and the kilometric length of links measured by orthodromic distances between connected ports. The six classes defined by the number of layers per node and link are compared based on their intra-class average link distance. For nodes, it corresponds to the average distance of shipping linkages to other ports. This is based on the idea that if connectivity is a function of distance (Barnett et al., 2007), it is also influenced by the variety of layers connecting ports in the network. The relationship between connectivity and distance was already underlined in the case of street networks (Gleyze, 2007), airline networks (Guimera et al., 2005) and liner shipping networks (Ducruet and Zaidi, 2012), but without looking at layer diversity.
The analysis (Figure 6) confirms certain findings by Ducruet (2013) in the sense that the average kilometric distance of maritime linkages is longer for the most diversified nodes, and shorter for the most diversified links. Since such a result is somewhat stable over time, it is possible to conclude an invariant feature of our network, namely the wider geographic coverage
of multifunctional ports. Such ports are inserted in diverse shipping routes at multiple spatial scales by a variety of actors, so that they act as powerful nodes connecting and centralizing maritime circulation (De Roo, 1994). However, certain classes of ports have gone through substantial fluctuations, especially those handling three traffic types, to such an extent that they have surpassed the ports handling four to five types between 1988 and 2000. In addition, the average connected distance of single-type ports has increased regularly since the mid-1990s. Such deviations from the initial pattern in 1977, which witnessed a clear-cut hierarchy of average distances from the least to the most diversified nodes, can be explained by the influence of particular flows. Although certain nodes handled fewer traffic types, they specialized in far-reaching trade, such as long-distance oil or container shipping.
When it comes to links as the unit of analysis, the inverse pattern compared with nodes stems from the fact that physical distance is by its essence a constraint, so that the probability for longer links to carry multiple traffic types decreases as distance increases. The more local dimension of diversified links is also explained by the fact that the redistribution function often occurs within a shorter range, i.e. within maritime regions and port ranges, where flows are channeled through the same routes and corridors shared by neighboring nodes, such as the North European range of the Japanese megalopolis. In addition, the most diversified links necessarily carry passengers and vehicles, such as shortsea and coastal shipping, which are concentrated within maritime basins. The stability of the trend has been somewhat eroded over time, as initial differences in average distances noticeably reduced up to 2008. Single-type links remained exceptionally longer than the rest, because they are more likely to carry particular commodities such as bulks, which are, as we said above, less correlated with other traffics.
Homophily, which is the propensity of a network to connect nodes of the same nature, is an important dimension of multiplex networks (Wong et al., 2006). A parent dimension is assortativity, namely the fact that nodes of similar size are better connected than nodes of dissimilar size, with the latter referred to as disassortativity (Newman, 2002). In our maritime network, we calculated the proportion of links connecting nodes handling the same number of traffic types as a good proxy for homophily (Figure 7). This proportion continuously grew, from 26.4% in 1977 to 32.5% in 1997, and decreased since then, down to 28.9% in 2008. Conversely, the average gap between the number of layers of connected nodes on the remaining links has dropped from 1.88 in 1977 to 1.75 in 1997, and increased since then up to 1.93 in 2008. In fact, the proportion of links connecting nodes of similar layer variety (i.e. with a gap under 1.6) is the highest, oscillating around the level of 45% of world total, without showing any noticeable trend; the proportion of links with an average gap (i.e. between 1.6 and 3) is stable around 15%, but has decreased from 16.8 to 12.9 along the period; and the proportion of links having the highest gaps (i.e. over 3) is the lowest, around 12% on average, with a slight decline until 1997 and an upward trend since then.
In terms of assortativity, two measures were retained from literature on the issue: the assortativity coefficient, which is the Pearson correlation between the degree centrality of connected nodes for all port pairs; and the rich-club coefficient. The latter is a ratio between the Gamma index (see Ducruet and Rodrigue, 2013) measured for the whole network (i.e. proportion of observed links in the total maximum possible number of links, or completeness) and the Gamma index measured for the subnetwork including only diversified nodes, i.e. connecting at least 4 different layers. The global maritime network became more and more disassortative until the year 2000, in line with the decreasing Gamma index, which suggests a simplification, rationalization and centralization of the network, so that larger nodes
increasingly connect with smaller nodes. In parallel, more diversified ports have always been more closely connected with each other than the rest of the network (rich-club effect), but this rich-club coefficient declined until the late 1990s, then stabilized, and grew again until 2008. This means that the subnetwork of most diversified ports once was 5 times better connected than the whole network, but this gradually declined to about 4 times.
[Insert Figure 7 about here]
3.4 Hubs and nodal regions
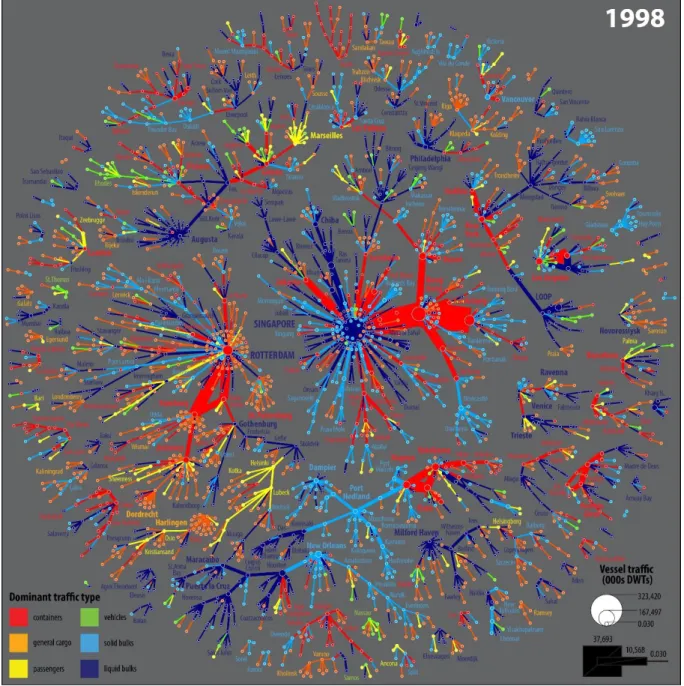
A closer look at the specific position and function of nodes and links in the global maritime network can be obtained by the application of single linkage analysis. This method is effective in detecting the pivotal hubs and the underlying geographic distribution of their dominance within their respective subnetworks (Nystuen and Dacey, 1961). A snapshot of the global picture is proposed for the years 1978, 1988, 1998, and 2008 (Figures 8-11). It consists in retaining only the largest traffic link of each port node, while highlighting the commodity type of this link, as well as the dominant (highest percentage) commodity type per node.
In 1978, one major component constitutes the backbone of the network, polarized by Rotterdam and Ras Tanura, where Saudi Arabia developed its first oil refineries and terminals in the late 1930s (Figure 8). Through these hubs, the component connects many nodes of the wealthiest economies in Europe, Asia, and North America, notwithstanding the inclusion of Southern Africa. Secondary hubs such as Kharg Island (Iran), Dubai, Santa Cruz de Tenerife and Las Palmas (Canaries), New Orleans, and Yokohama are crucial relays at both ends of the trunk line for local redistribution. Overall, the global maritime network is mainly dominated by liquid bulk nodes. The largest nodes outside this component, in terms of traffic volume, are New York
and Los Angeles, which dominate their respective Eastern and Western seaboards, the former extending towards the Caribbean and the latter towards Japan. Genoa and Piraeus as well as Ceyhan (Turkey) and Augusta (Italy) are dedicated Mediterranean nodes for this particular type of traffic, whose influence remains primarily local in scope. While the largest hub, Ras Tanura, is extremely specialized with exclusive liquid bulk linkages, this is not always the case for other hubs. For instance, Fos (France) and Los Angeles connect an important container flow; Piraeus developed several vehicle flows; Rotterdam, Yokohama, and New Orleans are engaged in general cargo as well as solid bulks. Although liquid bulks constitute their principal traffic, these hubs are more diversified than Ras Tanura, which relies on one single commodity. Other hubs are smaller in size and specialize in general cargo (London, Antwerp, Hamburg, Kobe, Marseilles, Santos) or solid bulks (Nagoya, Gdynia, Szczecin, Dampier, Baltimore, Veracruz). Interestingly, the only container hubs of the world in 1978 are Tokyo, Hong Kong, and Singapore, all of them at the forefront of Asia’s economic boom and early adopters of this technology, which had spread from the US to Europe only a decade previously. Still, Kobe and Hamburg, despite their general cargo specialization, developed a large container flow connecting their immediate domestic neighbor node, namely Nagoya and Bremerhaven. Minor container hubs include Sydney, Melbourne, Auckland, Halifax, Seattle, and San Juan.
[Insert Figure 8 about here]
The pattern in 1988 concerning the nature of the hubs and the distribution of major flows is noticeably different (Figure 9). While Rotterdam is still one of the two major hubs of the world with a liquid bulk orientation, there is now a second main independent component centralized by Singapore, polarizing Europe and Asia, respectively. These two hubs still develop several
liquid bulk flows towards secondary nodes (e.g. Statfjord, Milford Haven, Sullom Voe, Chiba) but their dominant linkage is now on containers, followed by numerous but less voluminous solid bulk and general cargo flows. Ras Tanura has continued to specialize in liquid bulks and has lost a large part of its former dominance, being now included in another component linking Mediterranean and US Gulf ports. Two concomitant trends thus affected major hubs between 1978 and 1988: Rotterdam’s attraction of large container flows and Singapore’s attraction of large liquid bulk flows. Most secondary hubs previously specialized in general cargo became container hubs (London, Hamburg, Antwerp, Le Havre) while new ones emerged, such as Kaohsiung, Yokohama, Los Angeles and New York developing more container flows but keeping their dominant liquid bulk profile. The global spread of containerization, at the expense of general cargo, fostered the emergence of well-articulated transnational and polycentric corridors concentrating large traffic volumes, such as in the North European range and East Asia, while the rest of the network is made up of smaller components centered upon a single local hub. One exception is the ring-shaped structure of the West African component, and the dominant domestic character of the Japanese component, although it also includes Busan in South Korea.
[Insert Figure 9 about here]
This bipolar structure is prolonged in 1998, thereby confirming the work of Joly (1999) on global container flows which already deduced such a pattern on the basis of large maritime regions (see also Li et al., 2014 and Xu et al., 2015 for similar approaches). Singapore is still specialized in liquid bulks, but Rotterdam has become a container hub (Figure 10). One can also observe a growing number of pivotal hubs having shifted their specialization from liquid
bulks to containers, such as Los Angeles, New York, Genoa, Lisbon, and Piraeus, thereby suggesting that hub functions in a certain layer have been reinforced rather than challenged in the pursuit of traffic diversification. The component polarized by Singapore, along an East Asian corridor extending its influence up to Oceania and Latin America, has become equally (if not more) important than that of Rotterdam, which remains centered upon North Europe. Outside of these two components, which together occupy the lion’s share of world traffic, the observed network structures are relatively stable in their geographic delineation, as seen with the Japan-Australia, West and East Mediterranean, US Gulf, West African, Adriatic, US East and West coasts and the Rio de la Plata components, the rest being mainly domestic in scope.
[Insert Figure 10 about here]
Lastly, network distribution in 2008 conserves such global and regional structures, notwithstanding a number of functional and spatial changes (Figure 11). Singapore, where container specialization became dominant in its traffic structure, further expanded its dominance towards the rest of the world, being a prime transit node on multiple routes connecting Asia. In comparison, Rotterdam’s component had remained centered upon Europe, with some linkages towards West Africa and Canada. One new component is that organized around Busan, Shanghai and Incheon, surpassing the Japanese one in terms of size. Most of the major hubs now specialize in containers, with some exceptions, such as Houston (liquid bulks), Zeebrugge (passengers), and Duluth (solid bulks). General cargo hubs have nearly disappeared, since such flows are polarized by nodes specialized in other traffic and located mainly in Europe, such as Saint Petersburg, Antwerp, Gothenburg, Haugesund, and Klaipeda, but also Surabaya. Passenger and vehicle traffic remain largely peripheral, as they are often concentrated
in specific regions such as the Caribbean, Mediterranean, and Scandinavian basins and around certain hubs such as Leghorn, Genoa, Limassol, Venice, Dublin, Rostock, Bergen, Zeebrugge, Marseilles, Port Everglades, Miami, Bridgetown, and George Town. Some large hubs such as Yokohama and Rotterdam are well represented in such flows, given the importance of coastal or short-sea shipping in their total activity.
[Insert Figure 11 about here]
4. Conclusion
Investigating the multiplex properties of maritime flows is fruitful in many ways. First, it confirms a number of invariants determining network topology, such as the heavier traffic weight, stronger centrality, and longer interaction range of the most diversified port nodes. The dominance of such nodes is a very stable feature of the global maritime network, notwithstanding a growing diversification in recent years of initially specialized ports. The six circulation layers under study also exhibited rather stable properties in terms of traffic weight, interaction range, homophily, and assortativity. Technological change, such as the global spread of containerization, and major geographic shifts stemming from the changing pattern of trade routes and the emergence of value chains and production networks, do not seem to have greatly modified such a permanency.
Second, we observed a number of structural changes taking place during the period under study, such as the topological transformation of individual layers and of their mutual correlations, a growing specialization of initially diversified linkages in parallel to a growing diversification of initially specialized ones. In fact, the main outcome of this study is to confirm that in a non-planar spatial network, such as the maritime network, node properties are much more stable
than link properties, due to the absence of a physical infrastructure on the sea. Port nodes are the only physical element of maritime networks apart from the ship itself and the coastline (as well as other invisible boundaries), so that their position is more stable and strongly path-dependent. This leads us to confirm a type of preferential attachment process, whereby already established hub ports maintain their diversity (Barabasi and Albert, 1999), though we also observed a diversification of initially specialized nodes. Links are more flexible and volatile, so that the six different layers under study have become less mutually overlapped than in the past. A turning point could have been identified, around the mid-1990s, corresponding to the emergence of hub-and-spokes systems in container shipping that tended to reinforce the differentiation of shipping patterns between the different layers. This explains why the most diversified ports have maintained their central role, but have become less mutually connected over time, as seen with the decrease of the rich-club effect. While certain layers have become less interdependent than in the past, container flows remain the most overlapped of all layers, despite their more recent global exposure and commonly accepted singularity in terms of network design, port selection, and intermodal linkages. The evolution of the global maritime network in the last three decades or so is thus marked by both stability and change, as seen with the growth and decline of particular ports and layers, and the stable properties of its overall architecture.
Such results certainly contribute to existing literatures on multiplex networks and spatial networks by confirming the path-dependency of initial situations, due to specific constraints such as the spatial friction of trade, and the impossibility for the network to grow indefinitely due to both physical limitations and historical self-reinforcing structures. Yet, because the true mathematical properties of multiplex graphs remain undefined, and because most of the existing studies remain rather static, this work can be considered as a pioneering empirical investigation into the dynamics of such complex systems.
Further research will compare current results with those obtained based on a different network topology, such as a graph made of direct and indirect linkages among ports. Another research pathway is to aggregate ports and terminals belonging to the same urban area, to gain in spatial coherence, and to better take into account the role of spatial proximity and functional complementarity in the measurement of multiplexity. Additional variables may be used to refine our understanding of the spatial factors’ underlying multiplexity, such as the market share of ports within their host country or transnational range and their level of vulnerability towards immediate neighbors. Furthermore, it would be necessary to decompose the network into more numerous layers, such as crude oil, refined oil products, and liquefied gas for liquid bulks, cruise, ferries, and roll-on / roll-off for passengers, to obtain a more precise picture of multiplexity and its evolution. Finally, such research would greatly benefit from a stronger engagement with evolutionary economic geography to better determine, for instance, whether particular combinations of layers are to be found in certain places and not in others, and how such places have coevolved or not over time. This research pathway can provide potential support to complex decision-making processes in terms of how ports and gateways should plan and supervise their land-use and commodity specialization or diversification in the future.
Acknowledgements
The research leading to these results has received funding from the European Research Council under the European Union's Seventh Framework Programme (FP/2007-2013) / ERC Grant Agreement n. [313847] "World Seastems".
References
Barabasi A.L., Albert R. (1999) Emergence of scaling in random networks. Science, 286(5439): 509-512.
Barnett L., Di Paolo I., Bullock S. (2007) Spatially embedded random networks. Physical
Reviews E, 76(5): 056115.
Barthelemy M. (2015) Spatial networks: tools and perspectives. In: Ducruet C. (Ed.), Maritime
Networks: Spatial Structures and Time Dynamics, Routledge Studies in Transport Analysis, pp.
50-60.
Berroir S., Cattan N., Guérois M., Paulus F., Vacchiani-Marcuzzo C. (2012) Les systèmes
urbains français. Synthèse DATAR, Travaux en Ligne 10.
Boccaletti S., Bianconic G., Criadod R., del Genio C.I., Gómez-Gardeñesi J., Romanced M., Sendiña-Nadalj I., Wang Z., Zanin M. (2014) The structure and dynamics of multilayer networks. Physics Reports, 544(1): 1-122.
Bogart D. (2009) Inter-modal network externalities and transport development: evidence from roads, canals, and ports during the English industrial revolution. Networks and Spatial
Economics, 9(3): 309-338.
Burger M.J., van der Knaap B., Wall R.S. (2014) Polycentricity and the multiplexity of urban networks. European Planning Studies, 22(4): 816-840.
Cardillo A., Gómez-Gardeñes J., Zanin M., Romance M., Papo D., del Pozo F., Boccaletti S. (2013) Emergence of network features from multiplexity. Nature Scientific Reports, 3(1344): http://www.nature.com/articles/srep01344
Carter R.E. (1962) A comparative analysis of United States ports and their traffic characteristics. Economic Geography, 38(2): 162-175.
Choi J.H., Barnett J.A., Chon B.S. (2006) Comparing world city networks: a network analysis of Internet backbone and air transport intercity linkages. Global Networks, 6(1): 81-99.
Cullinane K.P.B., Khanna M. (2000) Economies of scale in large containerships: optimal size and geographical implications. Journal of Transport Geography, 8(3): 181-195.
D’Agostino G., Scala A. (2014) Networks of Networks: The Last Frontier of Complexity. Springer Series on Understanding Complex Systems.
De Roo P. (1994) Marseille: de l’aire portuaire à l’aire métropolitaine. In: Collin M. (Ed.), Ville
et Port XVIIIe-XXe siècles, Paris: L’Harmattan, pp. 107-113.
Derudder B., Liu X., Kunaka C., Roberts M. (2014) The connectivity of South Asian cities in infrastructure networks. Journal of Maps, 10(1): 47-52.
Devriendt L., Derudder B., Witlox F. (2010) Conceptualizing digital and physical connectivity: The position of European cities in internet backbone and air traffic flows. Telecommunications
Policy, 34(8): 417-429.
Ducruet C. (2013) Network diversity and maritime flows. Journal of Transport Geography, 30: 77-88.
Ducruet C. (2015) Maritime Networks: Spatial Structures and Time Dynamics. London & New York: Routledge.
Ducruet C., Beauguitte L. (2014) Spatial science and network science: Review and outcomes of a complex relationship. Networks and Spatial Economics, 14(3-4): 297-316.
Ducruet C., Ietri D., Rozenblat C. (2011) Cities in worldwide air and sea flows: A multiple networks analysis. Cybergeo: European Journal of Geography, 528: http://cybergeo.revues.org/23603
Ducruet C., Itoh H. (2015) The mutual specialization of port regions connected by multiple commodity flows in a maritime network. In: Ducruet C. (Ed.), Maritime Networks: Spatial
Ducruet C., Itoh H. (2016) Regions and material flows: Investigating the regional branching and industry relatedness of port traffics in a global perspective. Journal of Economic
Geography, 16(4): 805-830.
Ducruet C., Koster H.R.A., Van der Beek D.J. (2010) Commodity variety and seaport performance. Regional Studies, 44(9): 1221-1240.
Ducruet C., Rodrigue J.P. (2013) Graph Theory: Measures and Indices. The Geography of
Transport Systems, https://people.hofstra.edu/geotrans/eng/methods/ch1m3en.html (accessed
December 2016).
Ducruet C., Zaidi F. (2012) Maritime constellations: a complex network approach to shipping and ports. Maritime Policy and Management, 39(2):159-168.
Garas A. (2016) Interconnected Networks. Springer Series on Understanding Complex Systems.
Gastner M.T., Newman M.E.J. (2006) Optimal design of spatial distribution networks. Physical
Review E, 74(1): 16117.
Gleyze J.F. (2007) Making allowances for spatial and network effects when assessing
indicators on infrastructure network nodes. Cybergeo: European Journal of Geography, 370.
Guerrero D., Rodrigue J.P. (2014) The waves of containerization: shifts in global maritime transportation. Journal of Transport Geography, 35: 151-164.
Guimera R., Mossa S., Turtschi A., Amaral L.A. (2005) The worldwide air transportation network: Anomalous centrality, community structure, and cities' global roles. Proceedings of
the National Academy of Sciences USA, 102(22): 7794-7799.
Hägerstrand T. (1952) The propagation of innovation waves. Lund studies in geography: Series B, Human geography, 4. Lund: Royal University of Lund, Dept. of Geography.
Hall P.V. (2004) Mutual specialisation, seaports and the geography of automobile imports.
Tijdschrift voor Economische en Sociale Geografie, 95(2): 135-146.
Halu A., Mukherjee S., Bianconi G. (2014) Emergence of overlap in ensembles of spatial multiplexes and statistical mechanics of spatial interacting network ensembles. Physical
Review E, 89(1): 012806.
Hayuth Y. (1981) Containerisation and the load centre concept. Economic Geography, 57(2): 160-176.
Hu Y., Zhu D. (2009) Empirical analysis of the worldwide maritime transportation network.
Physica A, 388(10): 2061-2071.
Jin F., Wang C., Li X., Wang J. (2010) China’s regional transport dominance: Density, proximity, and accessibility. Journal of Geographical Sciences, 20(2): 295-309.
Joly O. (1999) La structuration des réseaux de circulation maritime. Unpublished PhD Dissertation in Territorial Planning, Le Havre: Le Havre University.
Kaluza P., Kölzsch A., Gastner M.T., Blasius B. (2010) The complex network of global cargo ship movements. Journal of the Royal Society Interface, 7(48): 1093-1103.
Kenyon J.B. (1970) Elements in inter-port competition in the United States. Economic
Geography, 46(1): 1-24.
Kivelä M., Arenas A., Barthelemy M., Gleeson J.P., Moreno Y., Porter M.A. (2014) Multilayered networks. Journal of Complex Networks, 2(3): 203-271.
Li Z., Xu M., Shi Y. (2015) Centrality in global shipping network basing on worldwide shipping areas. Geojournal, 80(1): 47-60.
Liu X., Derudder B., Gago Garcia C. (2013) Exploring the co-evolution of the geographies of air transport aviation and corporate networks. Journal of Transport Geography, 30: 26-36.
Mayer H.M. (1973) Some geographic aspects of technological change in maritime transportation. Economic Geography, 49(2): 145-155.
Neffke F., Henning M., Boschma R. (2011) How do regions diversify over time? Industry relatedness and the development of new growth paths in regions. Economic Geography, 87(3): 237-265.
Nelson A. (2008) Travel time to major cities: A global map of accessibility. Global Environment Monitoring Unit, Joint Research Centre of the European Commission, Ispra, Italy.
Newman M.E.J. (2002) Assortative mixing in networks. Physical Review Letters, 89: 2087010.
Nystuen J.D., Dacey M.F. (1961) A graph theory interpretation of nodal regions. Papers in
Regional Science, 7(1): 29-42.
Parshani R., Rozenblat C., Ietri D., Ducruet C., Havlin S. (2010) Inter-similarity between coupled networks. Europhysics Letters, 92: 68002.
Pelletier J.F., Alix Y. (2004) Vers une nouvelle approche méthodologique pour analyser le phénomène de la conteneurisation des marchandises au Canada. Proceedings of the 39th
GRTC Annual Conference, 1: 326-341.
Peris A. (2016) Penser les villes en réseaux : une analyse des théories sur les liens
interurbains. Master Thesis in Geography, University of Paris I Panthéon-Sorbonne.
Robinson R. (2002) Ports as elements in value-driven chain systems: the new paradigm. Maritime Policy and Management, 29(3): 241-255.
Rodrigue J.P., Comtois C., Slack B. (2013) The Geography of Transport Systems. New York: Routledge.
Rodrigue J.P., Notteboom T.E. (2010) Foreland-based regionalization: Integrating
intermediate hubs with port hinterlands. Research in Transportation Economics, 27(1): 19-29.
Rodrigue J.P., Notteboom T.E. (2013) The geography of cruises: Itineraries, not destinations.
Applied Geography, 38: 31-42.
Scheidel W. (2013) The Shape of the Roman World. Working Paper, Stanford University.
Shen G., Wang C., Pulat P.S. (2013) An exploratory analysis and visualization of U.S. global trade patterns through maritime freight movement between U.S. ports and world ports: 1997-2007. International Forum on Shipping, Ports and Airports, Hong Kong, 3-5 juin.
Slack B. (1993) Pawns in the game: Ports in a global transportation system. Growth and
Change, 24(4): 579-588.
Tavasszy L.A., Minderhoud M., Perrin J.F., Notteboom T.E. (2011) A strategic network choice model for global container flows: Specification estimation and application. Journal of
Transport Geography, 19(6): 1163-1172.
Tranos E. (2011) The topology and the emerging urban geographies of the Internet backbone and aviation networks in Europe: A comparative study. Environment and Planning A, 43: 378-392.
UNCTAD (2015) Review of Maritime Transport. Geneva: United Nations Conference on Trade and Development.
Van Meeteren M., Neal Z., Derudder B. (2016) Disentangling agglomeration and network externalities: A conceptual typology. Papers in Regional Science, 95(1): 61-80.
Wang C., Ducruet C. (2013) Regional resilience and spatial cycles: Long-term evolution of the Chinese port system (221BC-2010AD). Tijdschrift voor Economische en Sociale
Geografie, 104(5): 521-538.
Wong L.H., Pattison P., Robins G. (2006) A spatial model for social networks. Physica A, 360(1): 99-120.
Xu M., Li Z., Shi Y., Zhang X., Jiang S. (2015) Evolution of regional inequality in the global shipping network. Journal of Transport Geography, 44: 1-12.
Author(s) Year Networks Area
Choi et al. 2006 Air, Internet World
Nelson 2008 Road, rail, river, maritime World
Bogart 2009 Road, canal, port England
Parshani et al. 2010 Air, maritime World
Jin et al. 2010 Road, rail China
Devriendt et al. 2010 Air, Internet Europe
Ducruet et al. 2011 Air, maritime World
Tavasszy et al. 2011 Maritime, road World
Tranos 2011 Air, Internet Europe
Berroir et al. 2012 Rail, patents, commuting France Liu et al. 2013 Air, multinational firms World
Ducruet 2013 Maritime World
Scheidel 2013 Maritime, road Roman empire
Shen et al. 2013 Maritime, road USA/World
Burger et al. 2014 Commuting Netherlands
Derudder et al. 2014 Air, road, rail South Asia
Ducruet and Itoh 2015 Maritime Asia-Pacific
Van Meeteren et al. 2016 Banks, APS firms World
Figure 1: World traffic evolution, 1977-2008
Figure 2: Average number of layers per node and link, 1977-2008
Figure 4: Topological evolution of layers per node and link, 1977-2008
Figure 5: Average centrality and traffic diversity levels by node, 1977-2008
Figure 7: Homophily and assortativity, 1977-2008