HAL Id: hal-02718859
https://hal.archives-ouvertes.fr/hal-02718859
Submitted on 1 Jun 2020HAL is a multi-disciplinary open access archive for the deposit and dissemination of sci-entific research documents, whether they are pub-lished or not. The documents may come from teaching and research institutions in France or abroad, or from public or private research centers.
L’archive ouverte pluridisciplinaire HAL, est destinée au dépôt et à la diffusion de documents scientifiques de niveau recherche, publiés ou non, émanant des établissements d’enseignement et de recherche français ou étrangers, des laboratoires publics ou privés.
Operando investigation of the lithium/sulfur battery
system by coupled X-ray absorption tomography and
X-ray diffraction computed tomography
Guillaume Tonin, Gavin B.M. Vaughan, Renaud Bouchet, Fannie Alloin,
Marco Di Michiel, Céline Barchasz
To cite this version:
Guillaume Tonin, Gavin B.M. Vaughan, Renaud Bouchet, Fannie Alloin, Marco Di Michiel, et al.. Operando investigation of the lithium/sulfur battery system by coupled X-ray absorption tomography and X-ray diffraction computed tomography. Journal of Power Sources, Elsevier, 2020, 468, pp.228287. �10.1016/j.jpowsour.2020.228287�. �hal-02718859�
Operando investigation of the lithium/sulfur battery system by coupled X-ray
absorption tomography and X-ray diffraction computed tomography
Guillaume Tonin†,‡,§, Gavin B. M. Vaughan‡, Renaud Bouchet*,§,Ϟ, Fannie Alloin*,§,Ϟ, Marco Di Michiel‡ & Céline Barchasz*,†
†
Univ. Grenoble Alpes,French Atomic Energy and Alternative Energies Agency (CEA-LITEN), DEHT, STB, F-38054 Grenoble
‡
ESRF – The European Synchrotron Radiation Facility, Grenoble 38000, France
§
Univ. Grenoble Alpes, Univ. Savoie Mont Blanc, CNRS, Grenoble INP, LEPMI, 38 000 Grenoble, France
ϞRéseau sur le Stockage Electrochimique de l’Energie (RS2E), CNRS, FR3459, 80 039 Amiens
Cedex, France Abstract
High capacity sulfur electrodes are expected to be used in the next-generation of high energy density and low cost rechargeable lithium batteries. The positive sulfur electrode undergoes complex electrochemical reactions, which cause morphological changes of the composite electrode while cycling. In the course to deeper understand the failures of this rather complex, but promising technology, the operando technics are in the heart of the advanced characterizations. In this study, a new electrochemical cell was designed which allows, for the first time, the combination operando of multimodal X-ray characterizations: the absorption tomography to study the morphological evolution of electrodes, and the X-ray diffraction computed tomography to probe locally the structural modification of the crystalline active materials S8 and Li2S. The combination of these two techniques simultaneously with the
electrochemical cycling, allows the production of correlated 3D-maps of quantitative phase distributions and morphology in the electrode, with time resolution on the scale of battery kinetics. It was thus possible to show the heterogeneous behavior in the bulk of the electrode and to propose kinetics law.
Introduction:
Due to the high theoretical gravimetric energy density, abundance and low cost of sulfur, batteries based on lithium/sulfur (Li/S) chemistry are a promising solution for future energy storage systems1,2. The Li/S cell does not rely on the same well-understood intercalation mechanism as conventional Li-ion batteries3,4, and the lack of detailed understanding of the functioning of the system leads to practical limitations on the widespread implementation of this technology. During cycling, the sulfur active material passes from solid to soluble electrochemically active polysulfides, which results in morphological changes of the positive electrode that is believed to be one reason for the observed capacity fading5. In addition, these systems are limited by the electrically insulating nature of sulfur and the Li2S discharge product3.
Finally, the dissolution of lithium polysulfide (PS) intermediates while cycling induces lithium metal corrosion6 and the redox shuttle mechanism7, during which the soluble PS shuttle between the positive (oxidation) and the negative (reduction) electrodes leading to poor faradic efficiency. The study of morphological changes in Li/S cells is thus essential to understand the degradation phenomena occurring while cycling.
To better achieve this goal, operando techniques have been developed to probe the Li/S system under working and environmental conditions7–10. In the last few years, several groups have used X-ray absorption tomography to probe the morphological changes in Li/S cells5,11–16. Yu et al.15 demonstrated that the distribution of the reformed sulfur clusters differs from the distribution before discharge. Operando X-ray diffraction has also been applied by several groups in order to follow the formation and consumption of crystalline species while cycling17–19. More recently, groups have worked on combining these two techniques in order to have a deeper understanding on the evolution of both the morphology and the crystalline species in the electrodes12,13,15. A recent review performed by Y.Yan et al.20 summarized the progress on the in-depth understanding of the electrochemical reaction mechanisms using in situ or operando synchrotron technics.
Recently, X-ray diffraction computed tomography (XRDCT) has been shown to be a powerful tool to produce time resolved 3D maps of the structural state of electrochemical systems such as batteries21–24. The time and spatial resolutions available with this technique make it ideal for the study of a cycling Li/S cell. In addition, it allows the separation of the XRD signal of the casing
and the electrodes, leading to high quality and spatially resolved XRD data otherwise impossible to obtain in such environments. XRDCT can be coupled with higher spatial resolution X-ray absorption tomography in order to produce 3D-time-resolved maps from both techniques to obtain complementary and nearly simultaneous structural and morphological information on the system under study.
Several new designs of 3D electrode architectures which aim to improve sulfur electrode performance are currently under development by different groups. For example, Walus et al.25,26 have demonstrated that porous 3D current collectors based on the use of a commercial non-woven carbon (NwC) fiber tissue allow high sulfur utilization and low polarization with highly loaded electrodes, thanks to stable 3D electronic conducting network, and as an efficient electrolyte reservoir. With a similar approach, Yan et al.27 showed that the use of porous carbon nanofiber paper electrodes leads to higher energy density and longer-cycling Li/S batteries. The 3D electrode design appears to be very efficient to mitigate some drawbacks of the Li-S system, such as the electrode morphology collapsing along cycling, and is well adapted for high loading sulfur electrode28–32. However, more in-depth investigations must be performed in order to evaluate the impact of this design on the electrochemical reaction kinetics, in particular on the transport properties. Understanding the dynamic processes in such 3D current collector-based electrodes requires the use of advanced 3D characterization techniques.
Here, we apply, for the first time in the Li/S system, the combination of XRDCT and absorption tomography to characterize the morphology and structural evolution upon cycling of a 3D sulfur electrode and evaluate the limiting electrochemical processes. To do so, a new electrochemical cells33 which allows 1/ the very simple battery assembly, 2/ the control of the internal pressure, 3/ the obtaining of reproducible electrochemical curves in rather good concordance with the reference results measured in coin cells and 4/ low absorption with a glass casing which increases the ray microtomography resolution and improve the XRD data without parasitic X-ray diffraction signal. Absorption tomography has been obtaining either in absorption or phase contrast modes; the latter mode improves the contrast and allow the proper segmentation of sulfur and the carbon matrix, even if carbon and sulfur have similar electronic density as thus similar absorption coefficients. The aim is to locally probe the kinetics of the electrochemical
complementary information on the electrochemical characterization, which provides only the average response of the system.
Results and discussion
The new designed operando cell was characterized with respect to standard coin cells as a reference. The electrochemical curves are shown in figure 1.
Figure 1 : Galvanostatic electrochemical curves of reference coin cell and operando cells.
The potential profiles were similar in both cells showing that the operando cell is well representative of a Li/S system12,26. However, the charge and discharge curves exhibit larger polarization, i.e. 100 mV, than the one observed for a coin cell. This polarization is probably due to the cell assembly (with higher resistive mounting materials).
1.1 α-sulfur evolution:
The operando cell was characterized by phase contrast tomography, which allows better segmentation of similarly absorbing objects compared to pure absorption contrast tomography. It was thus possible to better isolate the sulfur particles from the other cell components, in particular the carbon environment in which they are embedded. A schematic representation and a SEM picture of the electrode cross-section are shown in figure S1 and represent the structure of the composite electrode. In the following, the zero of the z axis is defined at the interface
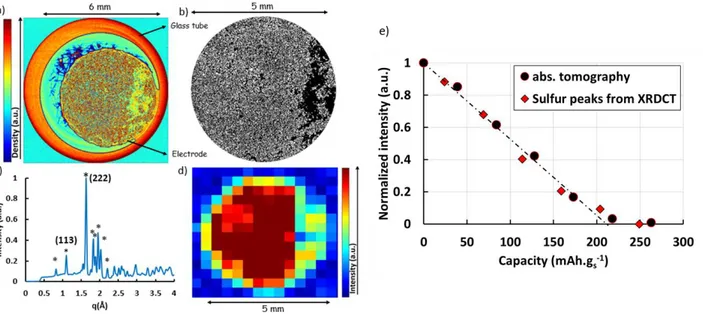
between stainless steel piston and the NwC current collector. The sulfur electrode is composed of three domains: a top layer composed of sulfur particles surrounded by a carbon-binder domain (CBD, as defined by Zielke et al.34) from 220 to 178 µm (so-called S@CBD domain). This S@CBD represents the ink coating on the top of the 3D current collector, where there is no evidence of NwC carbon fibers. The ink also penetrates into the current collector (68 µm from the top), and forms the second domain of sulfur electrode (so-called S@NwC) from 178 to 110 µm height. Finally, the bottom of the electrode from 110 to 0 µm contains NwC bulk without sulfur. One horizontal slice of the absorption tomograph, taken in the S@CBD, is shown in figure 2.a.
In this cross-section, the red outer shape indicates the glass tube. In the electrode, the higher absorption (red) corresponds to sulfur particles, which are distributed randomly in the electrode (with a less dense region on the right side probably due to electrode damage during cell assembly). Even if a small off-centering of the electrode can be noticed, the coverage between the positive and the negative electrodes was at least 95%. No impact of such off-centering on the electrochemical performances was noticed in coin-cell configuration. It is also possible to see the Viledon® fibers in blue, which are in contact with the S@CBD surface. In figure 2.b, the sulfur particles were segmented using ImageJ. This image shows only sulfur particles (white) and the carbon binder domain (black). The sulfur particle sizes are randomly distributed around a mean of tens of micrometers, as expected for bare (non-cycled micron-sized) elemental sulfur particles12 used. By comparing different 2D tomographic slices along the height of the electrode, the sulfur particles seem to be randomly distributed around a mean value of tens of micrometers, as expected for bare (non-cycled micron sized) elemental sulfur particles.
The XRDCT technique allows the reconstruction of XRD patterns for each voxel (size: 300×300×20 µm3). The reconstructed diffraction signal of a voxel, taken at the same depth as the tomographic slice at the center of the cell, prior to cycling, is shown in figure 2.c. This shows the characteristic pattern of orthorhombic α-sulfur (labelled with *). Sulfur phase peaks were identified and integrated by subtracting a local linear background. The distribution of this phase (figure 2.d) was obtained by integrating the (222) peak area of the orthorhombic α-sulfur phase in each voxel of the same S@CBD slice shown in figures 2.a and b.
XRDCT and absorption tomography thus give completely consistent results, and confirm that sulfur particles are randomly distributed in the electrode, with the same less dense region visible in the right part of the electrode.
Figure 2. (a) Horizontal cross-section of the sulfur electrode top (S@CBD) for the cell in the initial state. (b) The same slice after segmentation of sulfur particles, zoom on the 5 mm diameter electrode region. (c) Reconstructed XRD pattern of one voxel in the center of the S@CBD slice (*: sulfur peaks). (d) Variation of the (222) sulfur peak area in the same slice in the initial state. (e) Evolution of sulfur quantity during the 1st plateau of discharge, in the electrode S@CBD from absorption tomography (black dots) and in the entire electrode thickness from XRDCT (red diamonds). The dashed line shows the derived linear decrease in sulfur quantity.
These two techniques allow tracking of the elemental sulfur distribution in the electrode while cycling, one by morphology and one by crystallography. Only the S@CBD part could be analyzed quantitatively by absorption tomography. Indeed, it was not possible to separate perfectly the sulfur particles and the carbon in the S@NwC in an automatic manner, even with phase contrast absorption tomography, due to the presence of NwC fibers. However, in this part, it is possible to analyze quantitatively the sulfur, particle by particle, in a restricted region. In a complementary manner, the entire electrode could be characterized, albeit at lower spatial resolution, from the XRDCT data.
The volume analyzed by absorption tomography was a cylinder of 5 mm in diameter and 42 µm in height. The sulfur particles were segmented for each tomogram in the S@CBD, and all pixels
in this volume were integrated (black circles in figure 2.e). The total amount of sulfur was normalized in relation to the initial quantity.
The phase evolution during cycling could be followed from the XRDCT data via the integration of the two most intense diffraction peaks over the full electrode thickness. The normalized intensity averaged over the entire electrode is plotted as a function of the state of charge (SOC) in red diamonds in figure 2.e. A dashed line is also drawn in order to see the theoretical evolution of sulfur quantity taking into account a linear decrease of sulfur to 209 mAh.gs-1 35 associated
with the reaction S8 + 2e- S82- .
The excellent agreement between the absorption data taken from the S@CBD and the diffraction data taken over the entire electrode demonstrates that the average evolution of sulfur is homogeneous over the electrode thickness. It can be seen that the total volume of sulfur decreases linearly with time until approximately 210 mAh.gs-1 with a quasi-total reduction of
sulfur. This is consistent with the theoretical capacity of the reaction S8 + 2e- S82- and with
this unique conversion reaction during the first discharge plateau, as proposed by Walus et al.17 Mapping the 3D evolution of the distribution of sulfur particles within the electrode means the local dynamics of sulfur consumption can be probed. This allows the analysis of the dissolution mechanism with sufficient spatial resolution to understand the effect of electrode texture and thickness, in particular between the S@NwC (a sparse conductive network, far from the Li electrode) and the S@CBD (a dense conductive network in contact with the electrolyte separator).
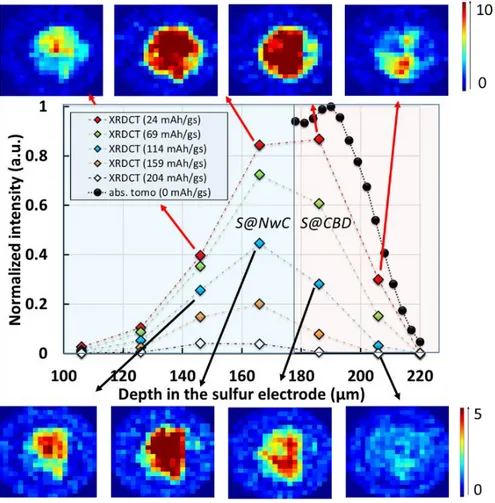
Figure 3: Evolution of sulfur quantity as determined by the sulfur (222) peak area through the depth of the electrode during 1st discharge plateau at different states of charge (SOC), based on XRDCT data. The graph shows the integrated intensity of 20 µm (the vertical resolution) slices; inset images show the distribution in the plane, with 300 µm resolution (i.e. one pixel represents 300 × 300 µm² area)
The distribution of sulfur at the beginning of the discharge (red diamonds in figure 3) is an approximately bell-shaped curve; a result of both the particle size and the electrode fabrication process. When using doctor blade coating, the sulfur particles partially penetrate into the 3D current collector as previously discussed, but the sulfur loading remains maximum in the top of the electrode into the S@CBD (from 220 to 178 µm). The sulfur content diminishes in the S@NwC, probably due to the presence of carbon fibers, which limits the ink penetration during the electrode elaboration. The sulfur is present initially over a depth of approximately 110 µm. As is shown in the RGB images in figure 3, the sulfur is well distributed in the (x,y) plane whatever the z value. However, the evolution of sulfur content versus the state of charge is not homogeneous over the electrode thickness (see Figure S2). In the S@CBD (blue and red curves
start to slow down after 100 mAh.gS-1. On the contrary, deeper in the electrode (green and
purple curves, 136 to 176 µm, in the S@NwC), the evolution of sulfur quantity between the first two points (24 to 69 mAh.gs-1) is slow. This is due to the fact that the sulfur particles in the top
layers of the electrode are easily accessible to lithium ions. Particles in these surface layers are reduced faster than the particles deeper in the electrode due to diffusion limitation. In addition, this explains why, in these top layers, sulfur vanishes before the theoretical value of 209 mAh.gs -1
. This result is in perfect agreement with theoretical approaches explaining the limitations observed with thick electrode36.
Thanks to the correlation established between the two data sets, the 3D analysis could be extended to higher spatial resolution. The unambiguous identification of the sulfur from the XRDCT data allows its location in the higher resolution tomography data. It is thus possible to follow the sulfur reduction in the whole S@CBD with a spatial resolution of 3 µm.
Figure 4: Evolution of sulfur quantity (total area of segmented sulfur particles in one slice) in the S@CBD during the 1st discharge plateau and as a function of S@CBD depth, based on absorption tomography data.
In the initial state, the distribution of sulfur increases in the thickness of the electrode until it reaches a plateau (figure 4). At the top of the S@CBD (220, 217, 214 µm within the electrode) the amount of sulfur is lower in accordance to the sulfur particle size (40 µm) and their spherical morphology. In addition, the reduction of sulfur is faster, as there is no evidence of sulfur at the
to 178 µm in the initial state and upon discharge. Two series of tomogram slices in the S@CBD, one at 217 µm depth and one at 181 µm depth are compared as function of the SOC in figure S3. In order to gain a schematic understanding of the kinetics, a semi-quantitative analysis was carried out by counting the surface projection in each slice. If we assume a simplified but broadly representative model with spherical particles, the volume of sulfur decreases with the surface projection in the power of three-halves (see supporting information S4).
The kinetics of sulfur reduction in the S@CBD, i.e. its volume evolution (see supporting information S4 & S5), as measured by this approach, confirmed what was observed using XRDCT data but with higher spatial resolution. There is rapid consumption of sulfur (concave curves) at the top of the S@CBD (near the electrolyte), with the sulfur there vanishing before the expected 209 mAh/gs. Deeper, the curve becomes more and more convex, proving that under these experimental conditions (C/20, TEGDME-DIOX, 1M LiTFSI based electrolyte), lithium ion diffusion drives the electrochemical kinetics in the electrode even in the 42 µm of the S@CBD close to the electrolyte.
A quantitative analysis of few particles in the S@CBD has also been carried out by segmenting individual particles sharing no voxel with others. This is not necessarily characteristic of the whole distribution, although it can be assumed that by considering particles of similar volumes, the effect of volume/surface ratio is constant.
The sulfur consumption kinetics of these large particles is not constant during all the process and a kinetic increase is observed at 100 mAh.gs-1. This may be due to the sulfur particle size
distribution. Indeed, as the quantity of sulfur is reduced linearly proportional to the number of electrons exchanged via the electrochemical reaction S8 + 2e- S82-, when the smallest sulfur
particles have totally disappeared, the speed of consumption of larger particles is increased while applying the same current.
Furthermore, the particles being isolated, it was possible to draw a box (X,Y,Z) around a particle in order to see its evolution while cycling (Figure 5.a). The position of the center of mass (CoM) of the particle (XM,YM,ZM) could also be followed while cycling (Figure 5.b).
Figure 5: (a) Evolution of the (X,Y,Z) dimensions of one particle. (b) Evolution of the mass center (XM,YM,ZM) while cycling with a schematic representation.
The evolution with time of the box dimensions was similar in the 3 dimensions showing that particle reduction is isotropic. Interestingly, the CoM position is almost constant in the (X,Y) plane, whereas, the particle moves downward continually, as shown with the decrease of the ZM value. This is due to the irreversible collapse of the S@CBD, which has already been reported during sulfur consumption37. As sulfur, representing 80% in weight, and thus approximately 82% in volume of the S@CBD, is being reduced to soluble PS, the porosity of the S@CBD greatly increases as it is filled by the electrolyte. Subsequently, the pressure applied on the system crushes the CBD, which has lost its mechanical strength. The S@CBD thickness significantly decreases during the discharge, with a decrease of almost 80% (42 to 9 µm in depth) (figure S6), which corresponds approximately to the loss of sulfur active material volume while the NwC current collector conserve it mechanical strength and integrity. At the end of the first plateau, the thickness of the electrode is decreased up to 200 µm. The large morphological evolution of the electrode should have a large impact on the electrode cyclability due to large modifications of the electronic and ionic percolation pathways.
1.2 Li2S evolution:
Between the two plateaus observed in discharge, as expected no morphological and structural modifications of the electrode is seen. At the beginning of the second plateau, in accordance to literature17, crystalline Li2S starts to grow.
Similarly to the analysis of sulfur peaks, the most intense (111) reflection of Li2S was integrated
through the electrode thickness and in the voxels near the center of the cell, to measure the global evolution of the presence of this species. The distribution of the peak area at the end of the first discharge is shown in Figure 6.
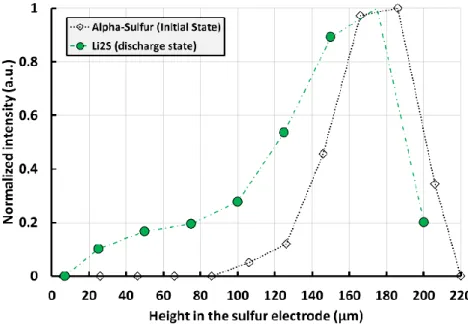
Figure 6: Li2S distribution (green circles) at the end of the first discharge from XRDCT data compared to the initial α-S8 distribution (black diamond).
In the discharged state, similarly as seen for sulfur, a higher concentration of Li2S is observed in
the top of the electrode in the CBD where the carbon surface area is the highest (from 137 to 200 µm) due to the presence of Super P®. However, Li2S precipitates deeper in the electrode
compared to the initial sulfur distribution. Different factors could explain this phenomenon:
The lithium and polysulfide ion transport (diffusion & migration) through the electrolyte is relatively low38, meaning that there is an ion concentration gradient along the separator and the 3-D current collector. As the local concentrations should have an impact on i) the
electrochemical and chemical reaction kinetics and ii) the nature of the PS formed, the Li2S formation becomes heterogeneous through the electrode depth.
As the insulating species Li2S should passivate the carbon surface, a large surface area is
needed to complete the reaction.
As the XRDCT data allows both temporal and 3D spatial resolution, it has been used to analyze the Li2S kinetics through the thickness of the electrode. In figure S7, the evolution of the total
amount of Li2S is plotted against the capacity. The slope associated with the amount of Li2S
formed per electron exchanged is an indication of the Li2S formation efficiency. At the
beginning of the second plateau, a small slope was observed, indicating that Li2S is not the main
compound formed. Subsequently, a large improvement of Li2S formation efficiency is obtained,
as indicated by the higher slope observed. However, the slopes are far from those expected according to the reaction S42- + 8 Li+ + 6e- 4 Li2S, meaning competitive reactions are
occurring, principally the formation of Li2S2 as previously described in literature35.
The vertical resolution of 25 µm allows the detection of possible heterogeneities in Li2S
formation kinetics. Figure 7 shows the evolution at 4 different depths from 87 to 187 µm (see fig. 7) and representing the layers containing most of the Li2S discharge products.
During the discharge, all layers seem to evolve in the same manner, although with different initial Li2S formation efficiency. The main difference at different depths is the delay in the
appearance of the slope change. Indeed, after some delay, the same slope is obtained whatever the depth, indicating that the same electrochemical mechanism occurs through the electrode thickness. The time shift is constant and approximately 90 mAh.gS-1, i.e. 66 µAh, each 25 µm
deeper into the electrode.
Several hypotheses can be proposed:
The ionic concentration gradient, as discussed previously, may have an effect on the chemical equilibria and electrochemical reactions.
Inside the 3D electrode, the electric potential is not perfectly uniform with a polarization increasing from the electrode/electrolyte interface to electrode/collector interface. This polarization gradient may favor the formation of soluble PS in the bulk of the electrode instead of producing Li2S.
As for S8 consumption, the Li2S formation can be limited by ion diffusion through the
depth of the electrode.
If we suppose than the main effect to explain the delay observed is the ionic species diffusion limitation, it is thus possible to estimate a diffusion coefficient (D) by:
D=l²/(6 t)
Where “l” is the vertical resolution between measurements (25 µm), and “t” is the time of the slope change. A diffusion coefficient of 2.10-10 cm².s-1 is obtained. Dominko et al.39 reported a diffusion coefficient of PS 0.1 M in an ether based electrolyte of 4.10-9 cm².s-1 which is not so far from the obtained diffusion value taking into account the electrode tortuosity and the viscosity of the electrolyte associated with the highest PS concentration in the low state of discharge.
During the charge, contrary to the discharge, the consumption kinetics of Li2S depend on the
depth in the electrode. The closer to the electrolyte the layer is, the quicker is the disappearance of Li2S. This can be related to the isolating character of Li2S which limits its reactivity compared
to the soluble PS (Li2S2, Li2S3, Li2S4, …) present at the end of the discharge and formed during
compounds. Finally, except for the top of the electrode, Li2S disappears completely at
approximately the same capacity (from 1550 to 1590 mAh.gs-1), just before the potential plateau and the formation of β-sulfur17
.
1.3 β-sulfur evolution:
As already reported, sulfur electro-recrystallizes in the beta phase after the first cycle12.
The same data treatment done for α-S8 was carried out on the absorption tomography data
recorded during charging. However, due to the resolution of absorption tomographic measurements, the smaller recrystallized β-sulfur particles could be distinguished but not meaningfully segmented. Tomographic slices at different depths in the electrode at the end of the first charge are shown in figure S8.
The β-sulfur crystallizes in large agglomerates (215 µm) at the surface of the electrode where the S@CBD collapsed with globally smaller particles size (10-20 µm in diameter) than the initial α-sulfur (~ 40 µm). The particle size is due to electrochemical nucleation and growth of β-S8 and
may be limited by the electronic conductivity of sulfur.
The NwC thickness remains almost the same and proves that this rigid carbon matrix does not evolve while cycling in this pressure range.
Figure 8: Comparison of the active material distributions in the positive electrode (α-S8, black diamonds), (Li2S, green circles), (β-S8, red triangles) taken at different state of charge (initial state, end of first discharge, and end of first charge respectively).
The greatest quantity of sulfur particles is still observed in the remaining CBD layer and in the top of the NwC, where the carbon surface area is maximum. The β-S8 distribution has the same
shape than the initial sulfur distribution, and the main difference is due to the electrode collapse. The β-S8 distribution is narrower than that of Li2S, which can be related to its less isolating
character. Indeed, the soluble character of the intermediate species enables the redistribution inside the electrode of crystalline active species by diffusion and migration processes.
However, the total amount of sulfur is lower showing a large irreversibility which may due to the loss of electrode morphology of the S@CBD.
Conclusions
To conclude, while the electrochemical profile is an average response of electrode global evolution, absorption/phase contrast and diffraction computed tomographies enable the evolution of electrode heterogeneities to be followed at a local scale. We demonstrated the existence of a kinetic gradient for the sulfur reduction and Li2S formation through the electrode thickness,
which is driven by the lithium ion diffusion and Li2S nucleation. In addition, while sulfur is
reduced in soluble PS a large modification of the electrode morphology is observed, with a noteworthy reduction of the S@CBD thickness that collapses during the first discharge plateau. This partially explains the loss of capacity. Whereas the diffusion limitation is accentuated by the thickness of the NwC current collector, which is detrimental to the Li2S formation and the ability
to exhibit high performances at high C-rate, the stable NwC structure preserves the electronic network in the global electrode, which is benefic for the cell cyclability.
Combining an optimization of the electrode formulation, architecture as well as the electrode electrolyte composition is thus mandatory to 1/ limit the electrode collapse while cycling, 2/ overcome the diffusion limitations, and 3/enhance sulfur utilization within the cell, in particular for efficient reduction of PS to Li2S instead of Li2S2. In that sense, the cell design and
characterization methodology described herein will provide an efficient tool to evaluate the newly developed solutions to satisfy these criteria.
Experimental parts Preparation of electrodes
Positive electrodes were made of carbon-based current collectors (non-woven carbon paper, H2315®, Freudenberg), with a high sulfur loading (~5 mgsulfur.cm-2, ~8 mAh.cm-2). Carbon black
(Super P®, Imerys) and PVdF 5130 binder (Solvay; 12 %wt solution in N-methyl-2-pyrrolidinone, NMP) were used as additives, in the weight ratios of 80/10/10 wt% (S8, SuperP®,
PVdF). A mixture of this species was prepared with a small amount of cyclohexane. After homogenization, the mixture was coated, using a doctor blade, on the carbon current collector and dried at 55°C during 24h in an oven.
Cell design & assembly
This new type of cell allowed a better spatial and temporal resolution by reducing the electrode dimensions (i.e. 5 mm) and by choosing appropriate materials to optimize the quality of the diffraction data. The inner part was 6 mm diameter with electrodes of 5 mm diameter, to lower the necessary scan range. A glass tube was used as a casing in order to optimize the homogeneity of the diffraction signal from the cell container, beneficial to the reconstruction process12. The spring and two stainless steel pistons were used to maintain a controlled pressure on the electrode stack and ensure an airtight seal. In this experiment, the pressure was fixed to 1.2 bar (similar as the pressure applied in a coin cell). The upper piston was punctured in order to evacuate the internal pressure due to gas compression when assembling the cell.
The cell was assembled in a glove box using a positive electrode, a lithium foil (135 µm thick, Rockwood Li) and a porous separator (Celgard® 2400) combined with an electrolyte reservoir (Viledon®) soaked with organic electrolyte. The electrolyte was composed of 1 mol.L-1 of LiTFSI (Aldrich) + 0.1 mol.L-1 LiNO3 in a mixture of tetraethylene glycol dimethyl ether
(TEGDME, dried, Aldrich) and 1.3-dioxolane (DIOX, dried, Aldrich) with 50/50 volume ratio. In these experiments, the electrolyte to sulfur ratio was approximately 15.
Electrochemical tests were carried out with a VMP® biologic galvanostatic battery cycler, in the voltage range of 1.5-3.0 V at a current rate of C/20 (~0.4 mA.cm-2).
Operando XRDCT and X-ray absorption and phase contrast tomography measurements were
performed at beamline ID15a at the ESRF – The European Synchrotron Radiation Facility with a monochromated incident wavelength of λ=0.1897 Å (energy 65.35 keV). XRDCT and absorption tomography data were recorded alternatively with a period of 32 minutes of which the XRDCT measurement took approximately 20 minutes. The time to switch configuration and measure absorption and phase contrast tomography took approximately 12 minutes.
The measurements were carried out on the whole active part of the cell, a cylinder of 6 mm diameter and 650 µm height. The image resolution for the absorption tomography was 3.18×3.18×3.18 µm3per voxel, corresponding to the size of the detector pixel. X-ray diffraction tomography requires acquisition of diffraction patterns while scanning the sample through the beam and rotating. The rotation speed was approximately 60 rpm. In the present case, the patterns were acquired so that each voxel was 300×300 µm2 in the (x,y) plan perpendicular to the
battery axis and 20 µm in the vertical direction, which corresponds respectively to 21×21 patterns per slice and 32 vertical layers (~14 000 patterns overall per time step).
Diffraction patterns were azimuthally integrated using locally modified versions of pyFAI software40,41. Data were corrected for detector geometry, response and transparency. Reconstructions were performed using local codes for filtered back projection point-by-point in the diffraction patterns. The reconstructions were cleaned by filtering in Euler space to remove parasitic contributions from e.g. the contact wires. Spatial and temporal phase maps were constructed using multiple peaks of the phases of interest.
The software ImageJ with the Fiji plugin was used to segment absorption data. The plugin “Volume viewer” was also used to see 3D stack projections of images.
Supporting information available
Additional characterization and results can be found in the supporting information. AUTHOR INFORMATION
Corresponding Author
*E-mail: celine.barchasz@cea.fr Tel: (+33) 4.38.78.90.36
*E-mail: renaud.bouchet@lepmi.grenoble-inp.fr Tel: (+33) 4.76.82.67.86 *E-mail: fannie.alloin@lepmi.grenoble-inp.fr Tel: (+33) 4.76.82.65.61
Author Contributions
C.B, R.B, F.A., G.T contributed to the design of the cell. G.T, G.V and M.D.M. set up the experiment, processed and analyzed the data. All authors discussed the results and contributed to the manuscript. G.T, F.A, R.B, C.B and G.V supervised the whole project.
Notes
The authors declare that they have no competing financial interests. ACKNOWLEDGMENT
the electrochemical cell realization. This work was performed within the framework of the Centre of Excellence of Multifunctional Architectured Materials "CEMAM" n° AN-10-LABX-44-01.
References
1. Bruce, P. G., Freunberger, S. A., Hardwick, L. J. & Tarascon, J.-M. Li-O2 and Li-S batteries with high energy storage. Nat Mater 11, 19–29 (2012).
2. Tarascon, J.-M. & Armand, M. Issues and challenges facing rechargeable lithium batteries.
Nature 414, 359–367 (2001).
3. Barchasz, C. et al. Lithium/Sulfur Cell Discharge Mechanism: An Original Approach for Intermediate Species Identification. Anal. Chem. 84, 3973–3980 (2012).
4. Cuisinier, M. et al. Sulfur Speciation in Li–S Batteries Determined by Operando X-ray Absorption Spectroscopy. J. Phys. Chem. Lett. 4, 3227–3232 (2013).
5. Zielke, L. et al. Degradation of Li/S Battery Electrodes On 3D Current Collectors Studied Using X-ray Phase Contrast Tomography. Scientific Reports 5, 10921 (2015).
6. Cheng, X.-B., Huang, J.-Q. & Zhang, Q. Review—Li Metal Anode in Working Lithium-Sulfur Batteries. J. Electrochem. Soc. 165, A6058–A6072 (2018).
7. Xu, R., Lu, J. & Amine, K. Progress in Mechanistic Understanding and Characterization Techniques of Li-S Batteries. Adv. Energy Mater. 5, n/a-n/a (2015).
8. Conder, J. & Villevieille, C. Is the Li–S battery an everlasting challenge for operando techniques? Current Opinion in Electrochemistry 9, 33–40 (2018).
9. Sun, K. et al. Operando Multi-modal Synchrotron Investigation for Structural and Chemical Evolution of Cupric Sulfide (CuS) Additive in Li-S battery. Sci Rep 7, 1–10 (2017).
10. Oleshko, V. P. et al. Multimodal Characterization of the Morphology and Functional Interfaces in Composite Electrodes for Li-S Batteries by Li Ion and Electron Beams.
Langmuir 33, 9361–9377 (2017).
11. Yermukhambetova, A. et al. Exploring 3D microstructural evolution in Li-Sulfur battery electrodes using in-situ X-ray tomography. Scientific Reports 6, 35291 (2016).
12. Tonin, G. et al. Multiscale characterization of a lithium/sulfur battery by coupling operando X-ray tomography and spatially-resolved diffraction. Scientific Reports 7, 2755 (2017). 13. Pietsch, P., Hess, M., Ludwig, W., Eller, J. & Wood, V. Combining operando synchrotron
X-ray tomographic microscopy and scanning X-ray diffraction to study lithium ion batteries.
Sci Rep 6, (2016).
14. Risse, S. et al. Multidimensional operando analysis of macroscopic structure evolution in lithium sulfur cells by X-ray radiography. Phys. Chem. Chem. Phys. 18, 10630–10636 (2016).
15. Yu, S.-H. et al. Direct visualization of sulfur cathodes: new insights into Li–S batteries via operando X-ray based methods. Energy Environ. Sci. 11, 202–210 (2018).
16. Lemarié, Q. et al. Sulfur-Based Electrode Using a Polyelectrolyte Binder Studied via Coupled in Situ Synchrotron X-ray Diffraction and Tomography. ACS Appl. Energy Mater. 3, 2422–2431 (2020).
17. Waluś, S. et al. New insight into the working mechanism of lithium-sulfur batteries: in situ and operando X-ray diffraction characterization. Chem. Commun. (Camb.) 49, 7899–7901 (2013).
18. Morcrette, M. et al. In situ X-ray diffraction techniques as a powerful tool to study battery electrode materials. Electrochimica Acta 47, 3137–3149 (2002).
19. Nelson, J. et al. In Operando X-ray Diffraction and Transmission X-ray Microscopy of Lithium Sulfur Batteries. J. Am. Chem. Soc. 134, 6337–6343 (2012).
20. Yan, Y., Cheng, C., Zhang, L., Li, Y. & Lu, J. Deciphering the Reaction Mechanism of Lithium–Sulfur Batteries by In Situ/Operando Synchrotron-Based Characterization Techniques. Advanced Energy Materials 9, 1900148 (2019).
21. Senyshyn, A., Mühlbauer, M. J., Dolotko, O., Hofmann, M. & Ehrenberg, H. Homogeneity of lithium distribution in cylinder-type Li-ion batteries. Scientific Reports 5, 18380 (2015). 22. Sottmann, J. et al. Chemical Structures of Specific Sodium Ion Battery Components
Determined by Operando Pair Distribution Function and X-ray Diffraction Computed Tomography. Angew. Chem. Int. Ed. Engl. 56, 11385–11389 (2017).
23. Jensen, K. M. Ø. et al. X-Ray Diffraction Computed Tomography for Structural Analysis of Electrode Materials in Batteries. Journal of The Electrochemical Society 162, A1310–A1314 (2015).
24. Liu, H. et al. Quantifying Reaction and Rate Heterogeneity in Battery Electrodes in 3D through Operando X-ray Diffraction Computed Tomography. ACS Appl. Mater. Interfaces 11, 18386–18394 (2019).
25. Waluś, S. et al. Investigation of non-woven carbon paper as a current collector for sulfur positive electrode—Understanding of the mechanism and potential applications for Li/S batteries. Electrochimica Acta 211, 697–703 (2016).
26. Waluś, S. et al. Non-woven carbon paper as current collector for Li-ion/Li2S system: Understanding of the first charge mechanism. Electrochimica Acta 180, 178–186 (2015). 27. Yan, J. et al. High-Performance Lithium–Sulfur Batteries with a Cost-Effective Carbon
Paper Electrode and High Sulfur-Loading. Chem. Mater. 27, 6394–6401 (2015).
28. Hu, Y. et al. Strategies toward High-Loading Lithium–Sulfur Battery. Advanced Energy
Materials n/a, 2000082.
29. Chung, S.-H., Chang, C.-H. & Manthiram, A. A Carbon-Cotton Cathode with Ultrahigh-Loading Capability for Statically and Dynamically Stable Lithium–Sulfur Batteries. ACS
Nano 10, 10462–10470 (2016).
30. Zhou, G., Paek, E., Hwang, G. S. & Manthiram, A. Long-life Li/polysulphide batteries with high sulphur loading enabled by lightweight three-dimensional nitrogen/sulphur-codoped graphene sponge. Nat Commun 6, 7760 (2015).
31. Li, S., Xia, X., Wang, X. & Tu, J. Free-standing sulfur cathodes composited with carbon nanorods arrays for Li-S batteries application. Materials Research Bulletin 83, 474–480 (2016).
32. Pan, H., Cheng, Z., Zhong, H., Wang, R. & Li, X. Flexible Cathode Materials Enabled by a Multifunctional Covalent Organic Gel for Lithium-Sulfur Batteries with High Areal Capacities. ACS Appl Mater Interfaces 11, 8032–8039 (2019).
33. Tonin, G. et al. Multiscale characterization of a lithium/sulfur battery by coupling operando X-ray tomography and spatially-resolved diffraction. Scientific Reports 7, 2755 (2017).
34. Zielke, L. et al. A Combination of X-Ray Tomography and Carbon Binder Modeling: Reconstructing the Three Phases of LiCoO2 Li-Ion Battery Cathodes. Adv. Energy Mater. 4, n/a-n/a (2014).
35. Waluś, S. et al. Lithium/Sulfur Batteries Upon Cycling: Structural Modifications and Species Quantification by In Situ and Operando X-Ray Diffraction Spectroscopy. Adv. Energy
Mater. 5, n/a-n/a (2015).
36. Electrochemical Systems - John Newman, Karen E. Thomas-Alyea - Google Livres.
37. Barchasz, C., Leprêtre, J.-C., Alloin, F. & Patoux, S. New insights into the limiting parameters of the Li/S rechargeable cell. Journal of Power Sources 199, 322–330 (2012). 38. Zhang, T., Marinescu, M., Walus, S. & Offer, G. J. Modelling transport-limited discharge
capacity of lithium-sulfur cells. Electrochimica Acta 219, 502–508 (2016).
39. Drvarič Talian, S., Moškon, J., Dominko, R. & Gaberšček, M. Reactivity and Diffusivity of Li Polysulfides: A Fundamental Study Using Impedance Spectroscopy. ACS Appl. Mater.
Interfaces 9, 29760–29770 (2017).
40. Ashiotis, G. et al. The fast azimuthal integration Python library: pyFAI. J Appl Cryst 48, 510–519 (2015).
41. Kieffer, J., Petitdemange, S. & Vincent, T. Real-time diffraction computed tomography data reduction. J Synchrotron Rad 25, 612–617 (2018).