HAL Id: inserm-02358690
https://www.hal.inserm.fr/inserm-02358690
Submitted on 12 Nov 2019
HAL is a multi-disciplinary open access
archive for the deposit and dissemination of
sci-entific research documents, whether they are
pub-lished or not. The documents may come from
teaching and research institutions in France or
abroad, or from public or private research centers.
L’archive ouverte pluridisciplinaire HAL, est
destinée au dépôt et à la diffusion de documents
scientifiques de niveau recherche, publiés ou non,
émanant des établissements d’enseignement et de
recherche français ou étrangers, des laboratoires
publics ou privés.
Glycogen Dynamics Drives Lipid Droplet Biogenesis
during Brown Adipocyte Differentiation
Alicia Mayeuf-Louchart, Steve Lancel, Yasmine Sebti, Benoit Pourcet, Anne
Loyens, Stephane Delhaye, Christian Duhem, Justine Beauchamp, Lise Ferri,
Quentin Thorel, et al.
To cite this version:
Alicia Mayeuf-Louchart, Steve Lancel, Yasmine Sebti, Benoit Pourcet, Anne Loyens, et al.. Glycogen
Dynamics Drives Lipid Droplet Biogenesis during Brown Adipocyte Differentiation. Cell Reports,
Elsevier Inc, 2019, 29 (6), pp.1410-1418.e6. �10.1016/j.celrep.2019.09.073�. �inserm-02358690�
Glycogen
synthesis
Lipid droplet
biogenesis
E15.5
E14.5
Brown Adipocyte
Glycogen
Nucleus
GLYCOPHAGY
GABARAPL1
Glycogen
Glycophagosome
STBD1
Brown
Adipose
Tissue
>E16.5
Lipid Droplets
Glycogen dynamics drives lipid droplet biogenesis during brown adipocyte differentiation _________________________________________________________________________________ Alicia Mayeuf-Louchart1*$, Steve Lancel1, Yasmine Sebti1#, Benoit Pourcet1#, Anne Loyens2, Stéphane Delhaye1, Christian Duhem1, Justine Beauchamp1, Lise Ferri1, Quentin Thorel1, Alexis Boulinguiez1, Mathilde Zecchin1, Julie Dubois-Chevalier1, Jérôme Eeckhoute1,
Logan T. Vaughn3, Peter J. Roach4, Christian Dani5, Bartholomew A. Pederson3, Stéphane D. Vincent6,7,8,9, Bart Staels1 and Hélène Duez1.
1 Univ. Lille, Inserm, CHU Lille, Institut Pasteur de Lille, U1011 - EGID, F-59000, Lille, France. 2 Univ.Lille,UMR-S 1172-JPArc Centre de Recherche Jean-Pierre Aubert Neurosciences et Cancer, Lille, France.
3 Indiana University School of Medicine-Muncie and Ball State University, Muncie, Indiana 47306, USA.
4 Department of Biochemistry and Molecular Biology, Indiana University School of Medicine, Indianapolis, IN 46202, USA
5 Université Côte d’Azur, CNRS, INSERM, iBV Faculté de Médecine, Nice, France 6 Institut de Génétique et de Biologie Moléculaire et Cellulaire, Illkirch, France; 7 Centre National de la Recherche Scientifique, UMR7104, Illkirch, France;
8 Institut National de la Santé et de la Recherche Médicale, U1258, Illkirch, France; 9 Université de Strasbourg, Illkirch, France;
# equal contribution
*Correspondence to: [email protected]
Keywords
Brown adipose tissue - Adipocyte differentiation - Lipid droplet biogenesis - Glycogen - Autophagy - Glycophagy
Summary
Browning induction or transplantation of brown adipose tissue (BAT) or brown / beige adipocytes derived from progenitor or iPS cells can represent a powerful strategy to treat metabolic diseases. However, our poor understanding of the mechanisms that govern the differentiation and activation of brown adipocytes limits the development of such therapy. Various genetic factors controlling the differentiation of brown adipocytes have been identified, although most studies have been performed using in vitro cultured pre-adipocytes. We investigate here the differentiation of brown adipocytes from adipose progenitors in the mouse embryo. We demonstrate that the formation of multiple lipid droplets (LD) is initiated within clusters of glycogen which is degraded through glycophagy to provide the metabolic substrates essential for de novo lipogenesis and LD formation. Therefore this study uncovers the unexpected role of glycogen in the generation of LD.
Introduction
In the early 1960’s, transmission electron microscopy (TEM) analysis of BAT of mouse and rat neonates showed the presence of glycogen (Napolitano and Fawcett, 1958; Revel et al., 1960). However, its role in brown adipocyte formation and/or activation has remained unexplored ever since. Recent studies have however described a transient increase in the amount of glycogen in BAT during re-acclimation after cold exposure and during refeeding after fasting, reviving the unresolved question of the role of glycogen in this tissue (Carmean et al., 2013, 2016; Jakus et al., 2008). Because cellular mechanisms during physiopathological events in the adult often recapitulate those occurring during embryonic development, deciphering embryonic development has led to a better understanding of adult cell biology in many fields. Brown adipocytes share common progenitors with skeletal muscle (Atit et al., 2006; Lepper and Fan, 2010; Seale et al., 2008) and PRDM16 was identified as a master regulator of the BAT differentiation program (An et al., 2017; Seale et al., 2007, 2008). However, how brown adipocytes form and differentiate during embryogenesis still remains unknown. Here, we uncover a glycogen-dependent cellular mechanism essential for lipid droplet (LD) formation during brown adipocyte development in vivo.
Results and discussion
Using TEM, we confirmed the presence of glycogen granules in brown adipocytes of mouse neonates (P0). Notably, these glycogen granules are mainly located in the close vicinity of LD and mitochondria (Figure 1A). To determine at which embryonic stage brown fat appears, we performed in
situ hybridization on whole mount mouse embryos harvested at different developmental stages, using
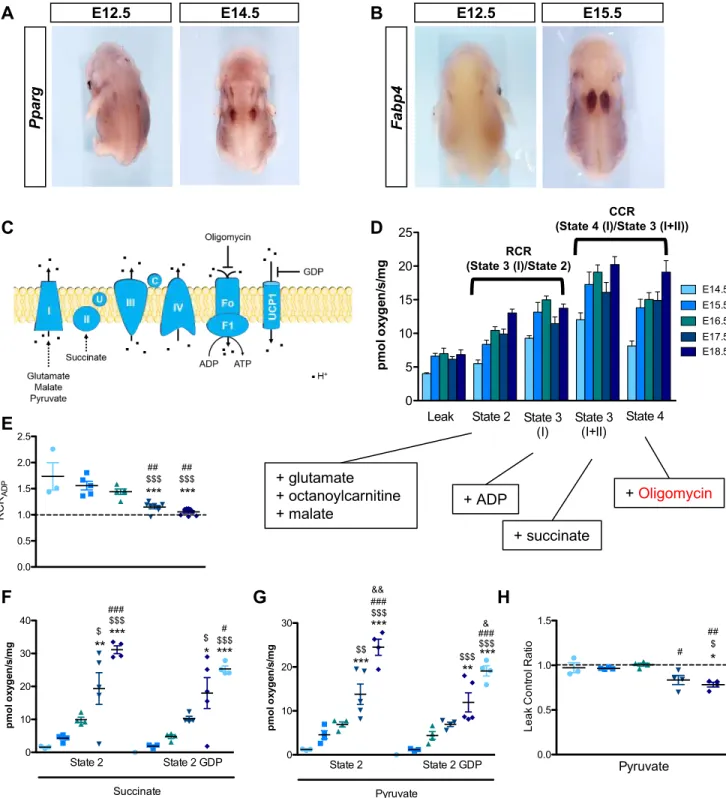
classical adipocyte markers (Cebpa, Pparg and Fabp4). As shown in Figure 1B and Figure S1A,B, two independent adipocyte populations are detected in the upper back of embryos as early as at E12.5 stage. These two adipose deposits enlarge and meet to form the well-known interscapular brown adipose tissue at E15.5 (Figure 1B and Figure S1A,B). Surprisingly, while they already express the common adipogenic genes, the specific brown differentiation marker UCP1 is only expressed from E16.5 at mRNA (Figure 1C) and protein (Figure 1D,E) levels. Since BAT identity is not only defined by the presence of the UCP1 protein, we assessed mitochondrial function in BAT isolated at different embryonic stages. While the ATP synthase inhibitor oligomycin reduces oxygen consumption in adipocytes isolated between E14.5 and E16.5, it has no effect on adipocytes isolated at E17.5 and E18.5, indicating that oxygen consumption becomes uncoupled from ATP synthesis at E17.5 (Figure 1F and Figure S1C-E). Addition of the UCP1 inhibitor GDP (Porter et al., 2016) reduces oxygen consumption in adipocytes isolated from E17.5 and E18.5 embryos but not at earlier stages, confirming the functional uncoupling of BAT at E17.5 (Figure 1G and Figure S1F-H). Together these results demonstrate that the functional differentiation of brown preadipocytes is initiated between E16.5 and E17.5 in the mouse embryo.
Brown adipocytes are characterized by the presence of multilocular LD, but the mechanisms of LD generation are still not fully understood. During brown adipocyte differentiation, LD first appear at
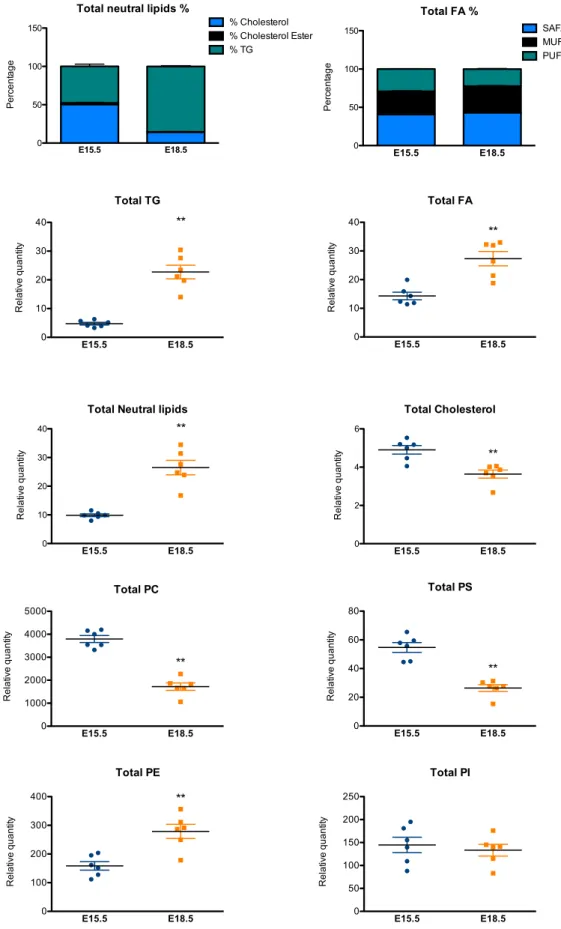
E15.5, as illustrated by Oil Red O staining and TEM (Figure 2A,C). Lipidomic analysis of embryonic brown adipocytes from E15.5 and E18.5 is further associated with the accumulation of fatty acids and triglycerides and profound modifications of the phospholipid profile (Figure S2). Notably, the increase of phosphatidylethanolamine (PE), observed between E15.5 to E18.5 has been previously associated with an increase of LD size (Cohen et al., 2017).
The presence of glycogen is detected as early as E14.5 in developing BAT as shown using Periodic Acid Schiff (PAS) staining and TEM (Figure 2B-C). Unexpectedly, glycogen granule clusters are first formed before the appearance of LD. Strikingly, the initiation of LD formation observed from E15.5 occurs within these granule clusters, while de novo formation of LD was undetectable in areas free of glycogen granules. At all stages of differentiation, we observed the formation of new clusters of glycogen (Figure 2C). This is associated with an increase of total amount of glycogen in the embryonic BAT (Figure 2D). However, the glycogen content in each individual glycogen cluster decreases when the LD size increases (Figure 2E). These results show that LD form individually within clusters of glycogen granules in differentiating brown adipocytes.
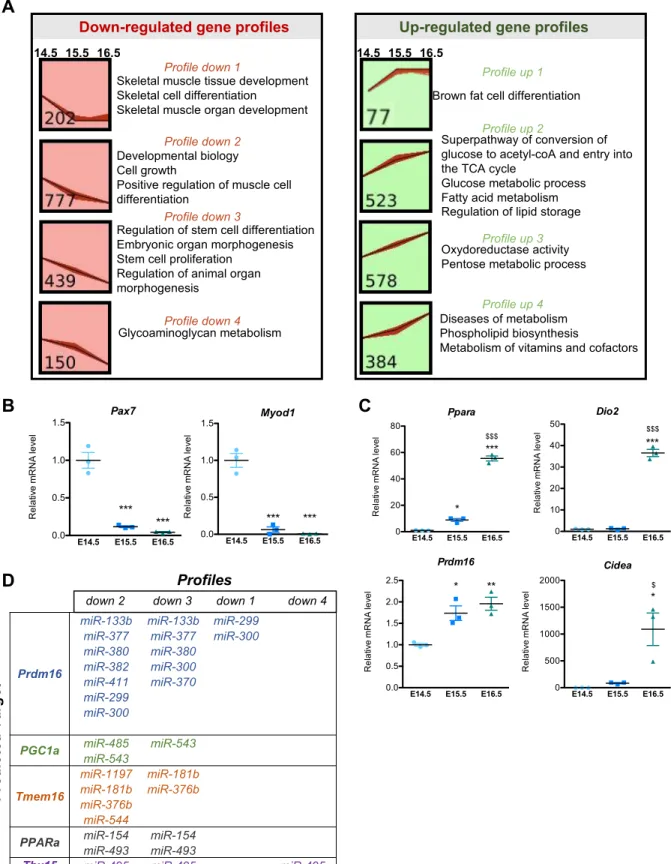
To determine which pathways are involved in the interaction of LD formation and glycogen dynamics, a transcriptional analysis was performed on BAT isolated from E14.5 to E16.5. Many differentially expressed genes were identified, with E15.5 representing a stage of intermediate expression (Figure 3A and Table S1). We identified four different kinetic expression profiles among both down-regulated and up-regulated genes (Figure S3A). One pattern identified genes whose changes in expression occur specifically between E14.5 and E15.5 and not thereafter. These genes are involved either in skeletal muscle differentiation (down-regulated) (Figure S3B) or in BAT differentiation (up-regulated) (Figure S3C). This indicates that final cell fate decisions of common brown adipocytes / skeletal muscle progenitors take place between E14.5 and E15.5. Changes in expression of skeletal muscle and BAT transcriptional regulators were analysed, the latter being potentially linked to down-regulation of miRNAs with predicted target genes that are closely related to the BAT differentiation program (Arias et al., 2016; Brandão et al., 2017; Chen et al., 2017) (Figure S3D). Other genes showed a linear kinetic of expression changes between E14.5 and E16.5, consistent with changes being triggered by remodeling of the transcriptional regulatory landscape described above. This includes genes involved in functions required for BAT differentiation such as fatty acid metabolism and lipid storage (Figure 3A and Figure S3A). Strikingly, genes involved in glucose metabolic processes were also identified in those analyses, suggesting that these pathways precondition the acquisition of BAT functionality (Figure 3A). In keeping with this, Gene Set Enrichment Analysis (GSEA) analyses revealed an enrichment for genes involved in glycogen metabolism (in addition to genes related to BAT differentiation and lipid metabolism) among those induced between E14.5 and E16.5 (Figure 3A). Accordingly, RT-qPCR analysis showed that Glycogen synthase 1 (Gys1) and Glycogenin (Gyg), which encode enzymes of the glycogen synthesis pathway, were significantly increased during brown adipocyte differentiation (Figure 3B,C). The same observation was made at mRNA and protein levels (Figure 3D,E) for glycogen phosphorylase (Pygl), an enzyme involved in glycogen degradation, thus indicative of an important glycogen turnover during brown adipocyte differentiation.
Glucose-1-
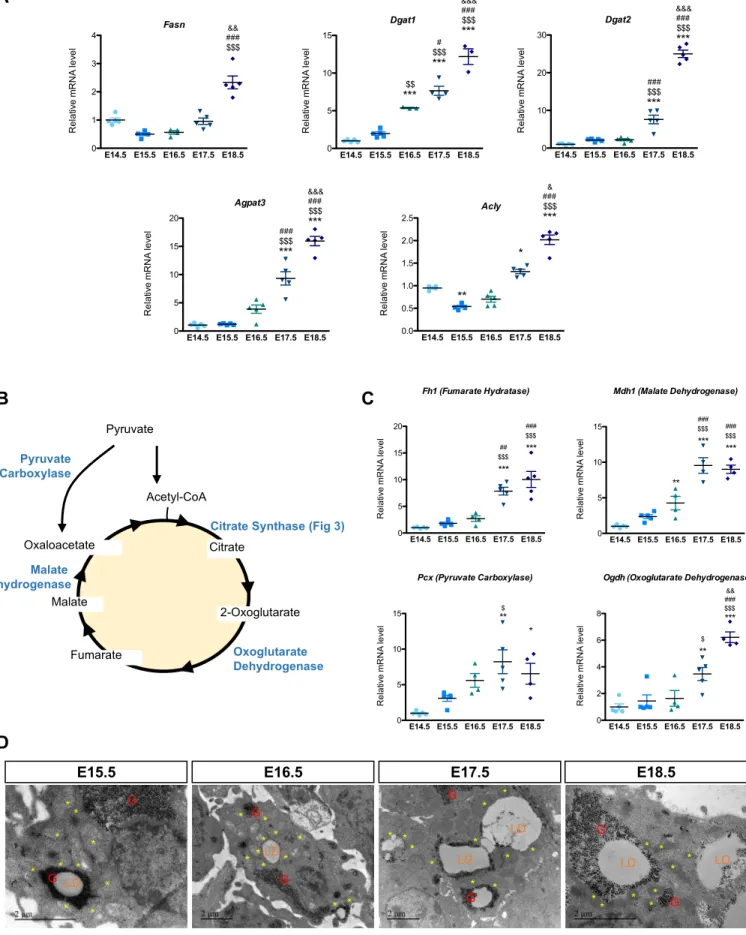
phosphate produced by glycogen degradation can be converted into glucose-6-phosphate and used as a substrate for de novo lipogenesis. The upregulation of Stearoyl-CoA desaturase (Scd1) mRNA encoding the enzyme that catalyzes the rate-limiting step in the formation of monounsaturated fatty acids, as well as other lipogenic genes such as Diacylglycerol O-Acyltransferase 1 and 2 (Dgat1, Dgat2) and Fatty Acid Synthase (Fasn) further indicates that de novo lipogenesis initiates between E14.5 and E16.5 (Figure 3F and Figure S4A). The increase of Perilipin 5 (Plin5) expression at E15.5 indicates initiation of lipid storage in the brown adipocyte (Figure 3G). Lipid formation requires the TCA cycle to produce citrate from acetyl-CoA and oxaloacetate, a reaction catalyzed by citrate synthase whose gene expression and activity are also highly upregulated during brown adipocyte development (Figure 3H,I and Figure S4B). Interestingly, a recent study has demonstrated that peridroplet mitochondria of adult BAT contribute to the expansion of LD due to higher TCA cycle capacity and citrate synthase activity, hence increasing their lipogenic potential (Benador et al., 2018). Consistently, our results point to an increased expression of genes related to the TCA cycle and citrate synthase activity in differentiating brown adipocytes and our TEM experiments indicate close proximity between LD/ glycogen clusters and mitochondria during the formation of LD (Figure S4C,D). Altogether, these data strongly suggest that degradation of accumulated glycogen is required to support de novo lipogenesis for LD formation or expansion.
To confirm the importance of glycogen in the formation of LD, preadipocytes isolated from BAT at E14.5 were differentiated ex vivo (Figure 3J and Figure S5A,B). As in vivo, accumulation of glycogen during brown adipocyte differentiation preceded LD biogenesis (Figure S5A,B). Interrestingly, blocking glycogen production using Glycogen Synthase 1 (Gys1) siRNA strongly diminishes LD formation (Figure 3J,K). These results were confirmed in vivo in Gys1 knockout mice, which display severely diminished LD biogenesis in the BAT at the end of the fetal period (E18.5 and P0) (Figure 3L,M and Figure S5C). Finally, we tested the role of glycogen production during differentiation of human Multipotent Adipose-Derived Stem (hMADS) cells into brown adipocytes (Rodriguez et al., 2005; Elabd et al., 2009). Interestingly, these human cells accumulate glycogen prior the formation of LD during differentiation (Figure S5D). In addition, siRNA knock down of GYS1 in hMADS decreases glycogen accumulation and impairs LD biogenesis during differentiation into brown adipocytes (Figure 3N,O). Altogether, these results reveal an essential role for glycogen in LD biogenesis during both mouse and human brown adipocyte differentiation.
Our transcriptomic analysis also identified autophagy-related gene expression during brown adipocyte differentiation (Figure 3A). It was recently reported that glycogen can be degraded by glycophagy, an autophagy-related mechanism (Jiang et al., 2011). The interaction of GABARAPL1, a protein associated with glycophagosome membranes, with STBD1, which targets glycogen particles promotes the trafficking of glycogen and its degradation through glycophagy (Delbridge et al., 2015). TEM experiments revealed the presence of glycophagosomes between E15.5 and E17.5 in brown adipocytes (Figure 4A and Figure S6A). GABARAPL1 and STBD1 are expressed during brown adipocyte differentiation (Figure S6B,C) and TEM immuno-gold analysis shows that both proteins are found associated with clusters of glycogen granules (Figure 4A).
The functional relevance of auto/glycophagy during brown adipocyte differentiation was tested first using the autophagy inhibitors wortmannin and chloroquine. Because of the deleterious effects of such compounds in pregnant mice, we developed an alternative strategy based on the isolation of BAT from E14.5 embryos and culturing ex vivo for 24 to 72 hours (Figure S7A). Harvested BAT forms a 3D-spheroid under basal conditions (DMEM 10%FBS) and recapitulates in vivo BAT embryonic development as demonstrated by the increased expression of the genes involved in the brown adipose differentiation program, lipid storage, and glycogen metabolism (Figure S7B). BAT explants were incubated with autophagy inhibitors. Incubation with wortmannin, an inhibitor of the initiation of autophagosomes, induced a strong accumulation of glycogen in brown adipocytes, while treatment with chloroquine, which decreases auto/glycophagosome-lysosome fusion (Mauthe et al., 2018), induces an accumulation of glycophagosomes (Figure 4B). In both conditions, the degradation of glycogen is impaired, as shown by the increase of PAS staining in these BAT explants. As a consequence, the number of LD is significantly reduced (Figure 4B,C), hence highlighting the importance of a functional autophagy process for LD formation. However, in these experiments, we cannot exclude that wortmannin and chloroquine affect LD biogenesis independently of glycogen dynamics.
In order to assess more specifically the role of glycophagy in the formation of LD, expression of
Stbd1 was knocked down in primary embryonic brown adipocytes. Stbd1-KD cells displayed a significant
reduction of total LD number at D6 of differentiation (Figure 4D,E). At an earlier stage (D4), quantification of the number of neo-formed LD within glycogen clusters by co-labelling with 2-NBDG-glucose and LipidTOX (Figure 4F,G) corroborated that downregulation of glycophagy negatively affects LD biogenesis during brown adipocyte differentiation.
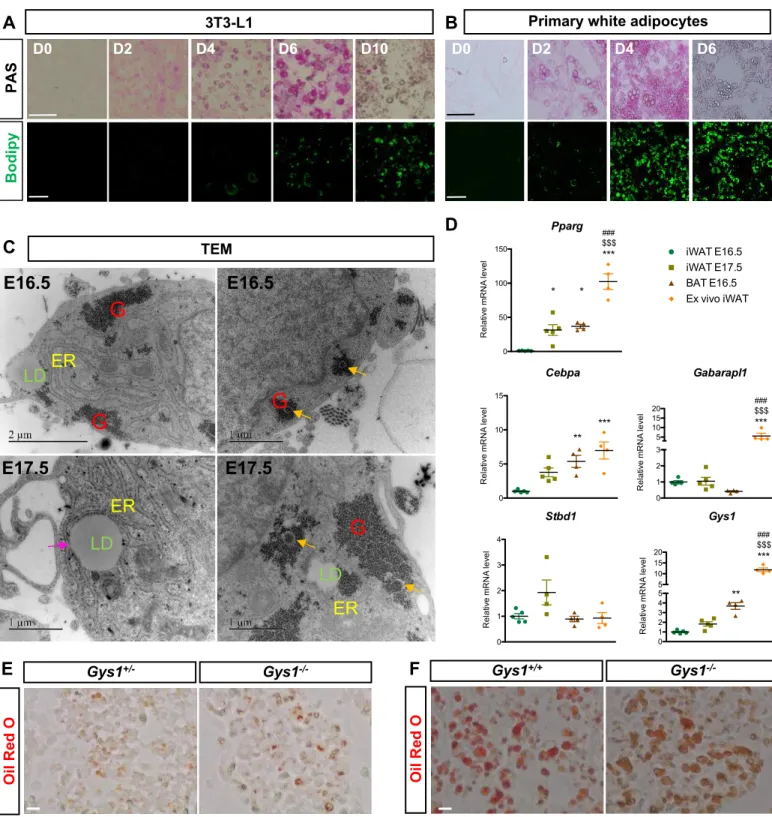
Most studies to date related to lipid droplet biogenesis were performed on white adipocytes in which the current model of LD biogenesis is based on budding from endoplasmic reticulum (ER) membranes (Walther et al., 2017). However, the role of glycogen dynamics in white adipocytes was never studied. Interestingly, glycogen also transiently accumulates in 3T3L1 cells during their differentiation into white adipocytes, and precedes LD formation (Figure S8A,B). Furthermore, inguinal white adipose tissue (iWAT) at E16.5 and E17.5 shows the presence of glycogen and glycophagosomes during its development (Figure S8C,D). However, the spatial organization of glycogen and LD is different in iWAT compared to BAT as LD are not always associated with glycogen (Figure S8C). In fact, while in the iWAT the ER is in close proximity with LD, TEM experiments did not allow us to detect ER membranes associated with LD in BAT. In addition, in contrast to BAT, the formation of LD in the iWAT of Gys1-/- embryos is not impaired, suggesting that different mechanisms control LD biogenesis in the two different adipose tissue depots (Figure S8E-F). Although further studies will be necessary to identify the specific mechanisms allowing LD biogenesis in brown adipocytes, our results shed light on the essential role of glycophagy and glycogen dynamics during LD biogenesis.
STAR Methods
Further information and requests for resources and reagents should be directed to and will be fulfilled by the Lead Contact, Alicia Mayeuf-Louchart ([email protected]).
This study did not generate new unique reagents.
EXPERIMENTAL MODEL AND SUBJECT DETAILS Mice
Mice were housed in a pathogen-free animal facility with a 12h light/dark cycle (light from 7AM to 7PM) and fed ad libitum. Embryos were obtained from pregnant C57BL6/J mice and dated taking Embryonic day (E) 0.5 as the day after the vaginal plug. Gys1 knock out mice (C57BL6 background) were described in Pederson et al., 2004 (Pederson et al., 2004). Mice were euthanized by cervical dislocation and embryos immediately processed or fixed in formalin. For experiments in adult mice, 8-weeks-old C57BL6/J males were used. Experimental procedures were performed with the approval of the Nord-Pas-De-Calais Ethics Committee (CEEA75), the Institut Pasteur Ethics Committee (C2EA89-CETEA) and in compliance with French and European ethical legislations. For Gys1 KO, procedures were approved by the Ball State University Animal Care and Use Committee.
Ex vivo BAT explant culture
The BAT of embryos at E14.5 was microdissected under binocular loupe and explants were cultured 24h to 72h on 30 mm Millicell inserts (0.4µm, Merck, PICMORG50) in DMEM 10%SVF. Chloroquine (20µM) or wortmannin (100nM) was added to the medium. After culture, explants were flash frozen in liquid nitrogen or fixed during 2h in 4% PFA before inclusion in Tissue-Tek in nitrogen vapor. Cryosections (7µm, Micron HM560) were collected on Superfrost Plus slides and stored at -20°C.
3T3L1 cells and primary white and brown preadipocytes
Interscapular brown preadipocytes were isolated from embryos at E14.5 and inguinal white preadipocytes from embryos at E16.5. Two BAT depots were digested in 200µl DMEM/F12, 0.2% BSA, Collagenase D 0.25 U, Dispase II 0.5 U for 15 min at 37°C and stopped by addition of 600µl DMEM/F12, 20% FBS. Cells were plated in well slides and the medium (DMEM/F12, 20% FBS) was changed 1 hour later. Brown adipocyte differentiation was induced by adding a medium containing DMEM/F12, 10% FBS, 125nM indomethacin, 0.5mM IBMX, 1nM triiodothyronine, 1mM Rosiglitazone, 1mM dexamethasone, 850nM insulin. The medium was replaced at day 2 by DMEM/F12, 10% FBS, 850nM insulin, 1nM triodothyronine, 1mM Rosiglitazone and changed every 2 days. White adipocyte differentiation of primary white preadipocytes and 3T3L1 cells was induced by adding a medium containing DMEM/F12, 10% FBS, 0.5mM IBMX, 1mM dexamethasone and 850nM insulin. The medium
was replaced at day 2 by DMEM/F12, 10% FBS, 850nM insulin, 1nM triodothyronine, 1mM Rosiglitazone and changed every 2 days.
Human cells
hMADS cells were obtained from the stroma of human adipose tissue of a 4-month old male donor (hMADS3) as described previously (Rodriguez et al., 2005). Proliferation medium is composed of DMEM (low glucose) containing 10% fetal calf serum (FCS), 100 U/ml penicillin and streptomycin. Cultures were maintained at 37°C in a humidified-incubator in air supplemented with 5% CO2 in air. Media were
changed every other day.
Adipocyte differentiation was induced on the day when cells reached confluency (Day 0). Adipogenic medium was composed of DMEM/Ham’s F12 media supplemented with 10 µg/ml transferrin, 0.86 µM insulin, 0.2 nM triiodothyronine, 1 µM dexamethasone, 100 µM isobutyl-methylxanthine and 0.1 µM rosiglitazone. Dexamethasone and isobutyl-methylxanthine were omitted three days later. Rosiglitazone was maintained for beige adipogenic differentiation or omitted at day 10 for white adipogenic differentiation as previously described (Elabd et al., 2009). Analysis of the differentiation was performed at day 15.
METHOD DETAILS Transfection of siRNA
Mouse cells were transfected before the induction of differentiation with 50nM of siRNA Control, Gys1 or Stbd1 using Darmafect1 (Dharmacon) during 24 h, following the instructions of the manufacturer. Primary cells were transfected 6 hours after isolation from embryos.
Transfections of hMADS cells were performed with Lipofectamine RNAiMAX reagent according to the procedure provided by the vendor (Life Technology). Cells were transfected 3 days before reaching confluency, then at day 5 and at day 10 after adipogenic induction.
2-NBDG uptake and life dyes stainings
Primary cells were incubated overnight with 50µM 2-NBDG (Invitrogen) at day 3 or day 4 of differentiation to visualize glycogen as described in (Curtis et al., 2019). Cells were washed during 3 hours prior observation or fixation 5 min in 4% PFA.
HCS LipidTOX™ (Invitrogen, 1:200) was added in the culture medium for 30 min. Cells were rinsed 3 times in PBS prior to observation with microscopy (Spinning disk SR, Nikon).
Freshly dissected BAT and explants were fixed in 4% paraformaldehyde (PFA) for 2h and washed 3 times in 1X PBS. They were equilibrated in 7%, 15% and 30% sucrose (diluted with 1X PBS) before inclusion in Tissue-Tek in nitrogen Azote vapor. Eight µm cryosections (Micron HM560) were collected on Superfrost Plus slides and stored at -20°C. For hematoxylin & eosin staining, sections were incubated in PBS and then distilled water before incubation in hematoxylin for 1 min, followed by tap water (3 min), 90% ethanol (30 sec), eosin (45 sec), 90% ethanol (1 min), 100% ethanol (3 minutes) and xylene (3 minutes) before mounting on Mercoglass. For neutral lipid staining, sections were washed in distilled water and immersed 30 minutes into freshly prepared Oil Red O solution (40% of Oil Red O stock solution (5 mg Oil Red O/ml of 60% triethylphosphate) in distilled water). Sections were then washed in tap water and mounted with mowiol. For glycogen staining, the Periodic Acid-Schiff (PAS) kit (Sigma #395B) was used and sections treated following the manufacturer’s instructions.
For lipid droplet visualization in hMADS cells, cells were fixed and stained with 0.5% Oil Red O in isopropanol and visualized by fluoresence microscopy using an aqueous mounting medium containing DAPI.
Immunostaining
Frozen sections were rinsed in 1X PBS and incubated 15 min in 0.5% Triton X-100 (diluted with 1X PBS). They were washed in 1X PBS and blocked 45 min in 5% horse serum (diluted in 1X PBS) before overnight incubation at 4°C with primary antibodies diluted in the same blocking buffer. Sections were washed in 1X PBS and then incubated 45 min with Alexa fluor secondary antibodies (Life technologies), Dapi, and/or Bodipy in the blocking buffer at room temperature. They were washed in 1X PBS and mounted with Dako Mounting Medium.
Samples were examined with a LSM880 confocal laser-scanning microscope (Carl Zeiss, Thornwood, NY) and the number of lipid droplets was quantified using Fiji software.
Whole mount in situ Hybridisation
The design of RNA probes is based on the insertion of the sequence encoding the T7 promoter (TAATACGACTCACTATAGGGC) upstream of the reverse primers. A classical PCR with a pair of primers is first carried out, followed by in vitro transcription with this matrix. The list of primers used for the identification of brown adipocytes in the embryo was as follows:
Fw Rev
Pparg CACAATGCCATCAGGTTTGG TAATACGACTCACTATAGGGCGTGAAGGCTCATGTCTGTCT Cebpa GGAGTTGACCAGTGACAATG TAATACGACTCACTATAGGGCCATTCTCCATGAACTCACCC Fabp4 GTGTGATGCCTTTGTGGGAAC TAATACGACTCACTATAGGGCACTCTTGTGGAAGTCACGCC
Ten µg of DNA obtained by PCR or by digestion of plasmids containing the sequence encoding the antisense probe under the control of T7, T3 or SP6 promoters, was purified by gel extraction (Qiagen)
and in vitro transcription was carried out with the DIG RNA labeling Mix kit (Roche), following the instructions of the manufacturer. Probes were then precipitated in ethanol, 4M LiCl overnight and were resuspended in 100µl of hybridization buffer (50% Formamid, 1.3X SSC pH5, 5mM EDTA pH8, 50 ug/ml yeast RNA/0.2% Tween20/ 0.5% CHAPS- 100 ug/ml heparin). This stock solution was stored at -20°C. After dissection, embryos were fixed in 4% PFA for 24h, at 4°C. They were transfered progressively into 100% methanol and stored at -20°C. Progressive rehydratation was performed in PTW (0.1% Tween-20 in 1X PBS) before proteinase K treatment (10 µg/ml in PTW). Embryos were then post-fixed Tween-20 minutes in PTW/4% formaldehyde/0.1% glutaraldehyde solution. They were progressively equilibrated in hybridization buffer and incubated for 1h at 68°C. Hybridization buffer containing RNA probes (1 µg/ml) was pre-warmed at 68°C before overnight incubation with embryos at 68°C. Three rinses were then carried out in MABT (100 mM maleic acid/150 mM NaCl pH7.5/0.1% Tween20). Embryos were blocked for 1 h in MABT/2% Blocking Reagent (BBR) (Roche), 1 h in MABT/2% BBR/2% fetal calf serum (FCS) and incubated overnight in MABT/2% de BBR/2% FCS/anti-DIG antibody (Roche) (1/20,000). They were then rinsed for 3 days in MABT and incubated 2 times for 15 minutes in NTMT solution before visualization with BM purple (Roche). Reactions were stopped by the addition of Tris 0.1% pH7.5 solution and embryos were stored in 4% PFA.
Transcriptomic analysis
For each condition, 3 BATs from independent embryos were pooled. RNAs extraction was performed with RNeasy Microkit (Quiagen) and Affymetrix Mouse Gene 2.1 ST was used for the generation of transcriptomic data.
Raw transcriptomic data from Affymetrix microarrays were normalized using the Partek® Flow® software (version 7.0 Copyright ©; 2018 Partek Inc., St. Louis, MO, USA), using background correction by Robust Multi-array Average (RMA), quantile normalization and summarization via median-polish. RMA values from different probes matching to the same gene were averaged. Genes with different temporal expression profiles were identified using the Short Time-series Expression Miner (STEM v1.3.11) (Ernst and Bar-Joseph, 2006). Parameters were set at 2 for “max unit change in model profiles between time points”, 1 for “minimum absolute expression change” and FDR for “Correction method”. Pathway enrichment analyses were performed using ToppCluster(Kaimal et al., 2010).
GSEA was performed using the GSEA software (v3.0) developed at the Broad Institute (Subramanian et al. 2005). We used 1000 gene-set permutations and the following settings: “weighted” as the enrichment statistic and “Diff_of_Classes” as the metric for ranking genes. High-throuput GSEA analyses were performed using BubbleGUM (GSEA Unlimited Map v1.3.19) 2 with similar parameters. The “MousePath_GO_gmt.gmt” set of genes from the Gene Set Knowledgebase (GSKB) (Liming Lai, et al. bioRxiv 082511; doi: https://doi.org/10.1101/082511) was used.
Real-time Quantitative Polymerase Chain Reaction
RNAs of embryonic BAT and explants were obtained using RNeasy Microkit (Quiagen). cDNA were obtained with a reverse transcription Kit (High-capacity cDNA reverse transcription Kit, Life Technologies) and quantitative qPCR was performed using Brillant II SYBR Green QPCR Master Mix (Agilent Technologies). Results were analyzed with the standard delta Cycle Threshold (CT) method and normalized to the expression of Ppia (Cyclophiline A) or 36B4. The list of primers used is given in Table S2.
High resolution respirometry
Freshly isolated BATs (3-5mg) were placed into the chambers of the high resolution respirometer O2K (Oroboros Instruments, Innsbruck, Austria) to measure the oxygen consumption either linked to ATP production or UCP1 uncoupling. In the first protocol, chambers were filled with MiR05 media (0.5mM
EGTA, 3mM MgCl2 3, 60mM lactobionic acid, 20 mM taurine, 10mM KH2PO4, 20mM HEPES, 110mM
D-sucrose, 1g/L BSA essential fatty acid free, pH 7.0) at 37°C. After permeabilization with digitonin (2µg/mL), leak respiration was obtained. Then state 2 respiration was obtained by sequential addition of octanoyl-carnitine (0.2mM), pyruvate (5mM), malate (2mM) and glutamate (10mM). Coupling between respiratory chain and ATP synthase was obtained by the injection of 1mM ADP, leading to state 3 (I). Respiratory control ratio (RCR), which is the ratio state 3 (I) to state 2, was calculated. A RCR=1 indicates the absence of coupling between respiration and ATP synthesis. Subsequent addition of succinate (10mM), maximizing complex II activity, gave state 3 (I+II) respiration. Finally, oligomycin (2.5µM) was added to inhibit FoF1 ATPase and measurement of state 4o was achieved. This allowed the calculation of the coupling control ratio (CCR), which is the state 4o to state 3 (I+II) ratio, as previously described (Porter et al., 2016). The lower the ratio, the higher the coupling. In the second protocol, tissues were placed in the uncoupling buffer, consisting in 120mM KCl, 5mM HEPES, 1mM EGTA and 0.1% BSA. After permeabilization, carboxyatractyloside (5µM, inhibitor of the Adenine Nucleotide Transporter), oligomycin (2.5µM) were added in both chambers. Then, one received pyruvate (5mM) and malate (2mM), the other received rotenone (0.5µM, complex I inhibitor) and succinate (10mM). Once a steady state was obtained, GDP (3mM) was added in order to measure oxygen consumption when UCP1 is inhibited. The ratio comparing the oxygen consumption in the presence and in the absence of GDP, called Leak Control Ratio, was informative for an effective uncoupling mediated by UCP1 (uncoupling when ratio<1).
Glycogen measurement
The dosage of glycogen was done using the Glycogen Assay Kit (#MAK016, Sigma) according to the manufacturer’s instructions.
Transmission electron microscopy (TEM) and Immunogold experiments
Embryonic BAT and explants were fixed in 2% PFA, 0.2% picric acid, 1% glutaraldehyde in 0.1M phosphate buffer at 4°C, for 3 days to 1 week. Samples were washed in 0.1M PO4 and post-fixed in 1% osmic acid in 0.1M PO4 buffer for 1 h at RT. Dehydration was then performed by serial incubation in 50%, 70%, 80%, 95% and 100% ethanol before incubation in propylene oxide for 30 minutes. Samples were impregnated by incubation in propylene oxide/araldite (1:1 v/v) for 60 to 90 min, then propylene oxide/araldite (1:2 v/v) 1h and in 100% araldite overnight at 4°C. The samples were finally incubated in Araldite which was allowed to polymerize for 24h at 56°C. Ultrathin sections (85nm) were cut with a ultracut Leica EM UC. Sections were contrasted 8 min with uranyl acetate 2% and 8 min with lead citrate (Reynolds).
For immunogold experiments, sections were permeabilized in 10% H202 and rinsed before incubation in Tris 0.1M, NaCl 0.15M, BSA 1% pH 7.5. Blocking was performed in 0.1M Tris, 0.15M NaCl, 1% BSA, 1% NGS, pH7.5 for 30 min and the primary antibody was added in this buffer and incubated 48 hours at 4°C. Sections were washed in 0.1M Tris, 0.15M NaCl 1% BSA, 1% NGS and then in 0.1M Tris, 0.5M NaCl, 1% BSA 1% NGS. Sections were then incubated with Gold 18nm Goat anti-rabbit diluted 1/20 in 0.1M Tris containing 0.5M NaCl, 1% BSA, 1% NGS for 1h at RT. Sections were washed in 0.1M Tris, 0.5M NaCl, 1% BSA, 1% NGS and then in distilled water before contrasted 8 min with 2% uranyl acetate and 8 min with lead citrate (Reynolds). Finally, sections were rinsed and dried.
All pictures were taken with the Zeiss EM 900 microscope and a GATAN camera (Orius SC 1000). For quantification of the percentage of glycogen cluster occupancy, areas of 100 glycogen clusters and their respective inner lipid droplets were quantified by Fiji (NIH, Bethesda, MD, USA) from E18.5 embryos TEM images.
Lipidomic
Lipids corresponding to a few mg of adipose tissue were extracted using a method adapted from Bligh and Dyer (Bligh and Dyer, 1959) in dichloromethane/methanol (2% acetic acid) / water (2.5 :2.5 :2 v/v/v), in the presence of the internals standards (Cer d18:1/15:0 16 ng; PE 12:0/12:0 180 ng ; PC 13:0/13:0 16 ng ; SM d18:1/12:0 16 ng ; PI 16:0/17:0 30 ng ; PS 12:0/12:0 156.25 ng, 4 µg of stigmasterol, 4 µg of cholesteryl heptadecanoate and 8 µg of glyceryl trinonadecanoate). The solution was centrifuged at 1500 rpm for 3 min. The organic phase was collected and dried under nitrogen, then dissolved in 20 µL of ethyl acetate for neutral lipid analysis and then in 50 µL of MeOH for main phospholipids and sphingolipids profiling. The extract was then stored at −20°C prior to analysis.
Phospholipids were profiled using an Agilent 1290 UPLC system coupled to a G6460 triple quadripole spectrometer (Agilent Technologies) and using Agilent MassHunter Work-station Quantitative Analysis (version B.06.00) for data acquisition and analysis. A Kinetex HILIC column (Phenomenex, 50 x 4.6 mm, 2.6µm) was used for LC separations. The column temperature was controlled at 40°C. The mobile phase A was acetonitrile; and B was 10 mM ammonium formate in water at pH 3.2. The gradient was
as follows: from 10% to 30% B over 10 min; 100% B for 2 min; and then back to 10% B for 1 min re-equilibrium prior to the next injection.
The flow rate of mobile phase was 0.3 mL/min and the injection volume was 5 µL. An electrospray source was employed in positive (for PE and PC analysis) and negative ion mode (for PI and PS analysis). The collision gas was nitrogen. Needle voltage was set at + 4000 V. Several scan modes were used. First, to obtain the naturally different specie’s mass, we analysed cells lipid extracts with a precursor ion scan of 184 m/z and 241 m/z to PC and PI, respectively; and a neutral loss scan of 141 and 87 to PE and PS, respectively. The collision energy optimums for PE, PC, SM, PI, PS were 20 eV, 30 eV, 45 eV, and 22 eV respectively. Data were treated using QqQ Quantitative (vB.05.00) and Qualitative analysis software (vB.04.00).
1µl of the lipid extract was analyzed by gas-liquid chromatography on a FOCUS Thermo Electron system using an Zebron-1 Phenomenex fused silica capillary columns (5m X 0.32mm i.d, 0.50 µm film thickness)(Barrans et al., 1994). Oven temperature was programmed from 200°C to 350°C at a rate of 5°C per min and the carrier gas was hydrogen (0.5 bar). The injector and the detector were at 315°C and 345°C respectively.
Protein extraction and Immunoblotting
Embryonic BAT was homogenized in protein lysis buffer RIPA (Sigma). Fifty µg of proteins was run on a 4-12% acrylamide gel and transferred to a nitrocellulose membrane with the iBlot 2 system (Invitrogen). Immunoblotting was performed with antibodies described in the the key resources table. The LI-COR Biosciences apparatus was used to acquire and analyse the pictures.
QUANTIFICATION AND STATISTICAL ANALYSIS
Results are expressed as means ± standard error of the mean (s.e.m). To determine significance, Mann-Whitney Test was used to compare two groups for samples lower than 8 and one-way Anova were made to compare more than 2 groups with Bonferroni correction. p<0.05 was considered significant. Concerning primary cell experiments, paired T-test were used to compare the results of treated cells with siRNA Control or Gys 1, obtained from the same preparation of a pool of embryos, in independent experiments.
DATA AND CODE AVAILABILITY
The transcriptomic datasets generated during this study are available with GEO accession
Author Contributions
A.M-L designed research. A.M-L, S.L, S.D, Q.T, J.B, C.D (Duhem) and L.T.V performed experiments. A.L conducted and analyzed transmission electron microscopy experiments. B.P, J.D-C, J.E and S.D.V carried out transcriptomic analyses. B.A.P and P.J.R provided Gys1 KO mouse embryos. C.D (Dani) conducted hMADS cell experiments. A.M-L, S.L, Y.S, B.P (Pourcet) and A.L were involved in data analysis. A.M-L and H.D wrote the manuscript. S.L, Y.S, B.P, A.L, A.B, L.F, M.Z, S.D.V, B.S and H.D gave conceptual advice and contributed to the critical revision of the manuscript.
Acknowledgments
We thank Pr. Margaret Buckingham who encouraged A.M-L to initiate this work in her laboratory, in the Pasteur Institute, for her advice and critical reading of the manuscript. We thank J.S Annicotte for advice. We thank Thomas Decoussemaker, Héléna Mirland and Anthony Hoestlandt for technical help. Lipidomic analyses were performed on the Toulouse INSERM Metatoul-Lipidomique Core Facility-MetaboHub ANR-11-INBS- and we thank Justine Bertrand-Michell (MetaToul, Toulouse, France) for lipidomic analysis. We thank Elisabeth Werkmeister and Sophie Salomé-Desnoulez of the BICeL Facility for access to systems and technical advice. We thank the Institut Curie, PSL Research University, Translational Research Department, Genomics platform (Paris, F-75248 France) for microarrays. We acknowledge the support from INSERM, the ANR-Labex-EGID (EGID, ANR-10-LABX-46), the Fondation Francophone pour la recherche sur le diabète (FFRD) together with the Fédération Française des Diabétiques (AFD) AstraZeneca, Eli Lilly, Merck Sharp & Dohme (MSD), Novo Nordisk & Sanofi; the Région Hauts-de-France/FEDER (Chronoregeneration) and Fondation de France. A.M-L. was supported by the Association Française contre les Myopathies (AFM-Téléthon). B.S is a recipient of an Advanced ERC Grant (694717). B.A.P was supported by National Institutes of Health funding (DK078370) and P.J.R by National Institutes of Health funding (DK27221).
Declaration of Interests
The authors declare no competing interests.
References
An, Y., Wang, G., Diao, Y., Long, Y., Fu, X., Weng, M., Zhou, L., Sun, K., Cheung, T.H., Ip, N.Y., et al. (2017). A Molecular Switch Regulating Cell Fate Choice between Muscle Progenitor Cells and Brown Adipocytes. Dev. Cell 41, 382–391.e5.
Arias, N., Aguirre, L., Fernández-Quintela, A., González, M., Lasa, A., Miranda, J., Macarulla, M.T., and Portillo, M.P. (2016). MicroRNAs involved in the browning process of adipocytes. J. Physiol. Biochem.
72, 509–521.
Atit, R., Sgaier, S.K., Mohamed, O.A., Taketo, M.M., Dufort, D., Joyner, A.L., Niswander, L., and Conlon, R.A. (2006). Beta-catenin activation is necessary and sufficient to specify the dorsal dermal fate in the mouse. Dev. Biol. 296, 164–176.
Barrans, A., Collet, X., Barbaras, R., Jaspard, B., Manent, J., Vieu, C., Chap, H., and Perret, B. (1994). Hepatic lipase induces the formation of pre-beta 1 high density lipoprotein (HDL) from triacylglycerol-rich HDL2. A study comparing liver perfusion to in vitro incubation with lipases. J. Biol. Chem. 269, 11572–11577.
Benador, I.Y., Veliova, M., Mahdaviani, K., Petcherski, A., Wikstrom, J.D., Assali, E.A., Acín-Pérez, R., Shum, M., Oliveira, M.F., Cinti, S., et al. (2018). Mitochondria Bound to Lipid Droplets Have Unique Bioenergetics, Composition, and Dynamics that Support Lipid Droplet Expansion. Cell Metab. 27, 869– 885.e6.
Bligh, E.G., and Dyer, W.J. (1959). A rapid method of total lipid extraction and purification. Can J Biochem Physiol 37, 911–917.
Brandão, B.B., Guerra, B.A., and Mori, M.A. (2017). Shortcuts to a functional adipose tissue: The role of small non-coding RNAs. Redox Biol 12, 82–102.
Carmean, C.M., Bobe, A.M., Yu, J.C., Volden, P.A., and Brady, M.J. (2013). Refeeding-induced brown adipose tissue glycogen hyper-accumulation in mice is mediated by insulin and catecholamines. PLoS ONE 8, e67807.
Carmean, C.M., Huang, Y.H., and Brady, M.J. (2016). Glycogen Repletion in Brown Adipose Tissue upon Refeeding Is Primarily Driven by Phosphorylation-Independent Mechanisms. PLoS ONE 11, e0156148.
Chen, Y., Pan, R., and Pfeifer, A. (2017). Regulation of brown and beige fat by microRNAs. Pharmacol. Ther. 170, 1–7.
Cohen, B.-C., Raz, C., Shamay, A., and Argov-Argaman, N. (2017). Lipid Droplet Fusion in Mammary Epithelial Cells is Regulated by Phosphatidylethanolamine Metabolism. J Mammary Gland Biol Neoplasia 22, 235–249.
Curtis, M., Kenny, H.A., Ashcroft, B., Mukherjee, A., Johnson, A., Zhang, Y., Helou, Y., Batlle, R., Liu, X., Gutierrez, N., et al. (2019). Fibroblasts Mobilize Tumor Cell Glycogen to Promote Proliferation and Metastasis. Cell Metab. 29, 141–155.e9.
Delbridge, L.M.D., Mellor, K.M., Taylor, D.J.R., and Gottlieb, R.A. (2015). Myocardial autophagic energy stress responses--macroautophagy, mitophagy, and glycophagy. Am. J. Physiol. Heart Circ. Physiol.
308, H1194-1204.
Elabd, C., Chiellini, C., Carmona, M., Galitzky, J., Cochet, O., Petersen, R., Pénicaud, L., Kristiansen, K., Bouloumié, A., Casteilla, L., et al. (2009). Human multipotent adipose-derived stem cells differentiate into functional brown adipocytes. Stem Cells 27, 2753–2760.
Ernst, J., and Bar-Joseph, Z. (2006). STEM: a tool for the analysis of short time series gene expression data. BMC Bioinformatics 7, 191.
Jakus, P.B., Sandor, A., Janaky, T., and Farkas, V. (2008). Cooperation between BAT and WAT of rats in thermogenesis in response to cold, and the mechanism of glycogen accumulation in BAT during reacclimation. J. Lipid Res. 49, 332–339.
Jiang, S., Wells, C.D., and Roach, P.J. (2011). Starch-binding domain-containing protein 1 (Stbd1) and glycogen metabolism: Identification of the Atg8 family interacting motif (AIM) in Stbd1 required for interaction with GABARAPL1. Biochem. Biophys. Res. Commun. 413, 420–425.
Kaimal, V., Bardes, E.E., Tabar, S.C., Jegga, A.G., and Aronow, B.J. (2010). ToppCluster: a multiple gene list feature analyzer for comparative enrichment clustering and network-based dissection of biological systems. Nucleic Acids Res. 38, W96-102.
Lepper, C., and Fan, C.-M. (2010). Inducible lineage tracing of Pax7-descendant cells reveals embryonic origin of adult satellite cells. Genesis 48, 424–436.
Mauthe, M., Orhon, I., Rocchi, C., Zhou, X., Luhr, M., Hijlkema, K.-J., Coppes, R.P., Engedal, N., Mari, M., and Reggiori, F. (2018). Chloroquine inhibits autophagic flux by decreasing autophagosome-lysosome fusion. Autophagy 14, 1435–1455.
Napolitano, L., and Fawcett, D. (1958). The fine structure of brown adipose tissue in the newborn mouse and rat. J Biophys Biochem Cytol 4, 685–692.
Pederson, B.A., Chen, H., Schroeder, J.M., Shou, W., DePaoli-Roach, A.A., and Roach, P.J. (2004). Abnormal cardiac development in the absence of heart glycogen. Mol. Cell. Biol. 24, 7179–7187. Porter, C., Herndon, D.N., Chondronikola, M., Chao, T., Annamalai, P., Bhattarai, N., Saraf, M.K., Capek, K.D., Reidy, P.T., Daquinag, A.C., et al. (2016). Human and Mouse Brown Adipose Tissue Mitochondria Have Comparable UCP1 Function. Cell Metab. 24, 246–255.
Revel, J.P., Napolitano, L., and Fawcett, D.W. (1960). Identification of glycogen in electron micrographs of thin tissue sections. J Biophys Biochem Cytol 8, 575–589.
Rodriguez, A.-M., Pisani, D., Dechesne, C.A., Turc-Carel, C., Kurzenne, J.-Y., Wdziekonski, B., Villageois, A., Bagnis, C., Breittmayer, J.-P., Groux, H., et al. (2005). Transplantation of a multipotent cell population from human adipose tissue induces dystrophin expression in the immunocompetent mdx mouse. J. Exp. Med. 201, 1397–1405.
Seale, P., Kajimura, S., Yang, W., Chin, S., Rohas, L.M., Uldry, M., Tavernier, G., Langin, D., and Spiegelman, B.M. (2007). Transcriptional control of brown fat determination by PRDM16. Cell Metab. 6, 38–54.
Seale, P., Bjork, B., Yang, W., Kajimura, S., Chin, S., Kuang, S., Scimè, A., Devarakonda, S., Conroe, H.M., Erdjument-Bromage, H., et al. (2008). PRDM16 controls a brown fat/skeletal muscle switch. Nature 454, 961–967.
Walther, T.C., Chung, J., and Farese, R.V. (2017). Lipid Droplet Biogenesis. Annu. Rev. Cell Dev. Biol.
33, 491–510.
Main figure titles and legends
Figure 1. BAT is functionally differentiated at E17.5 in the mouse embryo. A, TEM of BAT, at P0 (M, Mitochondria, LD, Lipid Droplet, G, Glycogen, SB 2 µm). Yellow box is enlarged in the right panel. B, Whole mount in situ hybridization of Cebpa. Arrows indicate interscapular BAT. C, RT-qPCR analysis of transcripts of Ucp1 normalised to Ppia in embryonic BAT. D, UCP1 western blot and quantification normalised to HP1γ in embryonic BAT (representative results of 3 independent experiments). E, Immunostaining with anti-UCP1 antibody (green) on embryonic BAT sections (SB 10 µm). F, Coupling Control Ratio (CCR) of oxygen consumption calculated from respiration data (Figure S1D) by dividing state 4 (Oligomycin) by state 3. G, Leak Control Ratio (LCR) calculated from respiration data (Figure S1F) by dividing state 2GDP by state 2. All respiratory experiments were performed on embryonic BAT tissue.
Results (C,F,G) are expressed as means ± s.e.m; *p < 0.05, **p < 0.01, ***p<0.001 by One-way ANOVA with Bonferroni post-hoc analysis, *compared to E14.5, $ to E15.5, # to E16.5 and & to E17.5
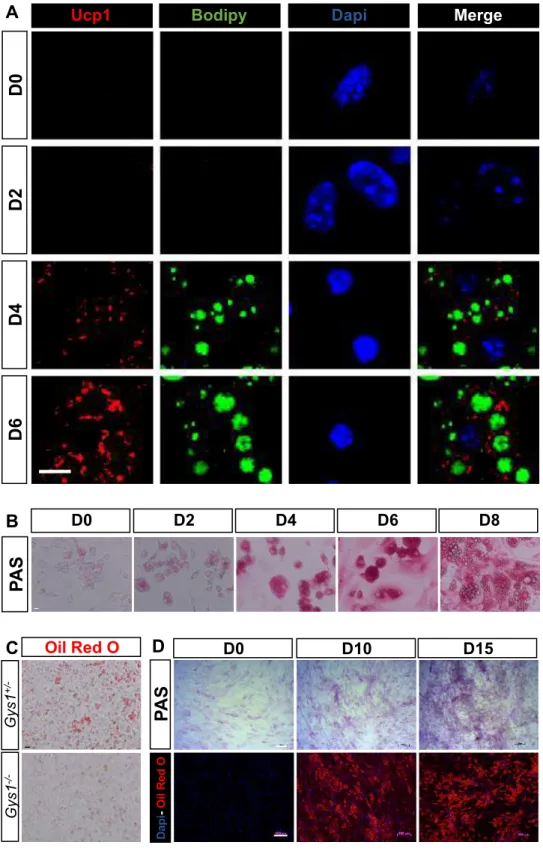
Figure 2. Lipid droplets form within glycogen clusters. A, Oil-Red O and B, PAS staining on embryonic BAT sections (SB 10 µm). C, TEM pictures of BAT. White boxes are enlarged in the right panels (LD, Lipid Droplets, G, Glycogen, SB 2 µm). D, Glycogen content in BAT of embryos at different stages. Results are expressed as means ± s.e.m; *p < 0.05, **p < 0.01, ***p<0.001 by One-way ANOVA with Bonferroni post-hoc analysis, *compared to E14.5, $ to E15.5, # to E16.5 and & to E17.5. E, Quantification of glycogen clusters based on TEM images of BAT at E18.5. Results indicate the occupancy of glycogen and LD, within each individual cluster, per size of LD (n=100 clusters). Results are expressed as means ± s.e.m; ***p<0.001 by Two-way ANOVA with Bonferroni post-hoc analysis.
Figure 3. Glycogen is required for LD formation. A, Bubble GUM representation of GSEA transcriptomic analyses. The legend is indicated in the grey box (NES, Normalized Enrichment Score, FDR, False Discovery Rate). B,C,D,F,G,H, RT-qPCR analysis of transcripts of Gys1, Gyg, Pygl, Scd1,
Plin5, Citrate Synthase normalised to Ppia in embryonic BAT. E, ELISA of PYGL in BAT between E14.5
and E18.5. I, Measure of Citrate Synthase activity in BAT. Results (B-I) are expressed as means ± s.e.m; *p < 0.05, **p < 0.01, ***p<0.001 by One-way ANOVA with Bonferroni post-hoc analysis, *compared to E14.5, $ to E15.5, # to E16.5 and & to E17.5. J, PAS staining (left panels) and Bodipy and dapi staining (right panels) (SB 10 µm) of primary brown preadipocytes treated at day 0 with siGys1 or a control siRNA (siControl) and analysed at day 6. K, Quantification of the number of LD per nuclei, on images presented in J (n=5 independent experiments, 9 images analysed per condition). Results are expressed as means ± s.e.m; ***p < 0.001, by paired t-test. L, Bodipy and dapi staining (left panels) and Oil Red O staining (right panels) on Gys1+/+, Gys1+/- and Gys1-/- mouse embryos at P0 (SB 10µm). M, Quantification of the number of LD per nuclei from Bodipy-Dapi stainings represented in L (n>5 embryos, 3 images analysed per condition). Results are expressed as means ± s.e.m; *p< 0.05, **p < 0.01 by One-way ANOVA with Bonferroni post-hoc analysis, *compared to Gys1+/+, $ compared to Gys1+/-. N,O, PAS (N) and Oil Red O (O) staining of hMADS cells treated with siControl or siGys1 and differentiated into brown adipocytes (Day 15, SB 20µm).
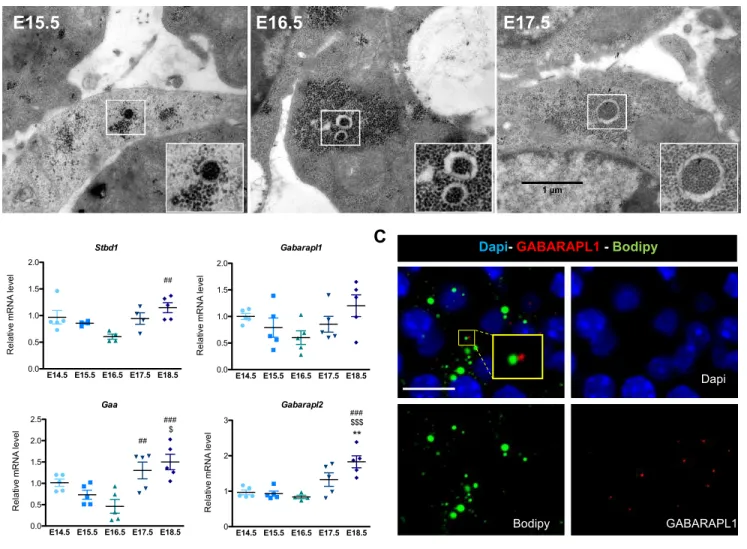
Figure 4. Glycophagy is essential for LD biogenesis. A, Representative picture showing the presence of glycophagosomes within glycogen granules, obtained by TEM on BAT at E18.5 (SB 1µm) (left panel). Arrow indicates glycophagosome and arrowhead shows the initiation of glycophagosome formation; TEM immunogold on BAT, at E16.5, with GABARAPL1 (middle panels) and STBD1 antibody (right panels). The lighter appearance of glycogen is due to the immunogold treatments. Yellow boxes are enlarged in the lower panels (G, glycogen). B, TEM pictures (left panels) (SB 2 µm), PAS staining (middle panels) (SB 10 µm) and Bodipy staining (right panels) (SB 10 µm) of embryonic explants 24h after treatment with DMSO, Wortmannin or Chloroquine (G, glycogen, n, nucleus, LD, lipid droplet, glycophagosomes with blue arrows). C, Quantification of the number of LD per nuclei, on explant sections 24h after treatment with Wortmannin or Chloroquine. Results are expressed as means ± s.e.m; **p < 0.01, ***p<0.001 by One-way ANOVA with Bonferroni post-hoc analysis, *compared to DMSO. D, Bodipy and dapi staining (SB 10 µm) of primary brown preadipocytes treated at day 0 with siControl or
siStbd1 and analysed at day 6 of BAT differentiation. E, Quantification of the number of LD per nuclei,
on images presented in D (n=4 independent experiments, 9 images analysed per condition). Results are expressed as means ± s.e.m; *p < 0.05, by paired t-test. F, 2-NBDG and LipidTOX staining (SB 10 µm) of primary brown preadipocytes treated at day 0 with siControl or siStbd1 and analysed at day4 of BAT differentiation. 2-NBDG was administrated overnight and washed 3h prior to the experiment to label the glycogen. G, Quantification of the number of LD per glycogen cluster, on images presented in F (n=4 independent experiments, 9 images analysed per condition). Results are expressed as means ± s.e.m; *p < 0.05, by paired t-test.
Supplementary Table S1. Transcriptomic analysis of BAT between E14.5 and E16.5. Related to Figure 3. Values are normalized gene expression levels obtained from the microarray analyses using RMA and averaging of different probes matching to the same gene as detailed in the Methods section.
E14.5 E15.5 E16.5 E17.5 E18.5 0 200 400 600 800 1000 10000 20000 30000 40000 50000 Ucp1 *** $$$ ### &&& * $ # Re la tiv e m RNA le ve l
E14.5 E15.5 E16.5 E17.5 E18.5
0 5 10 70 80 90 Re la tiv e p ro te in le ve l UCP1
E14.5 E15.5 E16.5 E17.5 E18.5
D Hp1g UCP1 E F G A B E12.5
LD
G
G
M M M M E13.5 E14.5 E15.5 C Cebpa TEM (Newborn P0)E14.5 E15.5 E16.5 E17.5 E18.5
0.0 0.5 1.0 1.5 ** *** $ $$$ ## Leak C ont rol R at io
E14.5 E15.5 E16.5 E17.5 E18.5
0.0 0.5 1.0 1.5 ** ** Co u p lin g Co n tro l Ra tio
Figure 1
Oil-Red O PAS A B C D E LD LD LD
G
G
G
G
LDG
G
TEMG
2µm LD LD 2µm LD E1 4 .5 E1 5 .5 E1 6 .5 E1 7 .5 E1 8 .5E14.5 E15.5 E16.5 E17.5 E18.5
0.0 0.1 0.2 0.3 *** $$$ # *** $$$ ### & µ g gl ygogen/ µ g B A T 0 0-0.2 0.2-1 1-5 5-10 10+ 0 20 40 60 80 100 LD Area Glycogen Area *** *** *** *** LD size (µm2) % of gly cogen clus ter oc cupanc y 0 0-0.2 0.2-1 1-5 5-10 10+ 0 20 40 60 80 100 LD Area Glycogen Area *** *** *** *** LD size (µm2) % of gly cogen clus ter oc cupanc y
Figure 2
Gys1+/+ Gys1+/- Gys1 -/-0 2 4 6
*
**
$ P0 Nu m b e r o f L D p e r c e ll ABrown fat differentiation Glycogen biosynthetic process Glycogen metabolic process
Positive regulation of glycogen biosynthetic process
Lipid binding
Lipid catabolism process
Negative regulation of lipid storage Lipid homeostasis
Lipid biosynthetic process
E1 4. 5 vs E1 5. 5 E1 5. 5 vs E1 6. 5 Autophagy
Positive regulation of autophagy
LE
G
E
N
D
Circle area = NES Color intensity = FDR 2.1 3.2 1.6 1.0 <0.01 <0.1 <0.5 NS(>1.0) E16.5 E15.5 E14.5 Regulation of autophagy J K si C o n tr o l Dapi-Bodipy PAS si G ys1 M Dapi-Bodipy Gy s 1 +/ -Gy s 1 +/ + Gy s 1 -/ -L Oil Red O N
Dapi–Oil Red O
PAS
O
E14.5 E15.5 E16.5 E17.5 E18.5
0 2 4 6 8 10 Gys1 **$ ### *** $$$ && ### *** $$$ && E17.5 E16.5 E15.5 E14.5 Re la tiv e m RNA le ve l
E14.5 E15.5 E16.5 E17.5 E18.5
0 2 4 6 8 Gyg ** $$ ***$$ Re la tiv e m RNA le ve l
E14.5 E15.5 E16.5 E17.5 E18.5
0 20 40 60 80 Scd1 ### ***$$$ & *** $$$ ## Re la tiv e m RNA le ve l
E14.5 E15.5 E16.5 E17.5 E18.5
0 5 10 15 20 Pygl *** $$$ ** $ ### && Re la tiv e m RNA le ve l
E14.5 E15.5 E16.5 E17.5 E18.5
0 500 1000 1500 Plin5 ### *** $$$ &&& *** *** $$$ $$ ### Re la tiv e m RNA le ve l
E14.5 E15.5 E16.5 E17.5 E18.5
0 5 10 15 Citrate Synthase ### *** $$$ *** $$$ ## Re la tiv e m RNA le ve l
E14.5 E15.5 E16.5 E17.5 E18.5
0 10 20 30 *** $$$ ### && * Citrate Synthase Activity
Cit ra te S yn th a se a ct iv ity (n mo l/mi n /mg o f B A T )
E14.5 E15.5 E16.5 E17.5 E18.5
0 1000 2000 3000 3000 4000 5000 6000 ***$$$ ### & PYGL µ g P Y G L/ µ g B A T B C D E H I F G siControl siGys1 0 1 2 3 4 5
***
Nu m b e r o f L D p e r c e ll si C o n tr o l si G ys1 si C o n tr o l si G ys1Figure 3
siControl siStbd1 0 2 4 6 * Nu m b e r o f L D p e r c e ll TEM Wortmannin
G
Chloroquine DMSO G LDn
B Dapi-Bodipy PAS A TEM GABARAPL1 STBD1G
G
G
D E LipidTox–2-NBDG F G si C o n tr o l si S tb d 1 0 2 4 6 8 10 ** *** DMSO Wortmannin Chloroquine Nu m b e r o f L D p e r c e ll siControl siStbd1 0 1 2 3 4 * Nu m b e r o f L D p e r g ly co g e n cl u st e r Dapi-Bodipy C si C o n tr o l si S tb d 1Figure 4
0.0 0.5 1.0 1.5 Pyruvate * $ # ## Leak C ont rol R at io
Figure S1. Identification of embryonic BAT with uncoupled mitochondria from E17.5. Related to Figure 1. A-B, Whole mount in situ hybridization of embryos with Pparg (A) and Fabp4 (B) probes. C, Schematic representation of the mitochondrial respiratory chain. Oligomycin inhibits ATP synthase activity while GDP inhibits UCP1. D, Comparison of respiratory states in BAT isolated from E14.5 to E18.5 mouse embryos. Boxes indicate the corresponding added substrates for the different states. The Coupling Control Ratio (CCR) is calculated by dividing State 4 (I) by State 3 (I+II). When inferior to 1, this indicates that mitochondria is sensitive to oligomycin and thus is coupled to ATP synthase. E, The Respiratory Control Ratio (RCR) for ADP calculated by dividing State 3 (I) by State 2. When close to 1, this indicates that mitochondria are not coupled, as shown from E17.5. F-G, Oxygen consumption after addition of succinate (F) or pyruvate (G) (State 2) for BAT isolated from different embryonic stages. Addition of GDP, an UCP1 inhibitor, indicates that mitochondria respiration depends on the UCP1 activity. GDP has no effects before E17.5 indicating that mitochondria are not sensitive to GDP, and therefore not uncoupled before this stage. H, The Leak Control Ratio (LCR) for BAT was calculated from respiration data (G) by dividing state 2GDPrespiration by state 2. All the results are expressed as means ± s.e.m; *p < 0.05, **p < 0.01, ***p<0.001 by One-way ANOVA with Bonferroni post-hoc analysis, *referred to E14.5,$to E15.5,#to E16.5 and&to E17.5.
C
E
F
G
H
E12.5 E14.5 Pp ar gA
0 5 10 15 20 25 E14.5 E15.5 E16.5 E17.5 E18.5Leak State 2 State 3 (I) State 3(I+II)
State 4 pm ol ox yge n/ s/ m g + glutamate + octanoylcarnitine + malate + ADP + succinate + Oligomycin RCR (State 3 (I)/State 2) CCR
(State 4 (I)/State 3 (I+II))
D
0 5 10 15 20 25 E14.5 E15.5 E16.5 E17.5 E18.5Leak State 2 State 3
(I) State 3(I+II) State 4
pm ol ox yge n/ s/ m g E12.5 E15.5 Fa bp4
B
0 10 20 30 40 State 2 State 2 GDP ** $ *** $$$ ### * $ *** $$$ # Succinate pm ol ox yge n/ s/ m g 0 10 20 30 *** $$ ***$$$ ### && ** $$$*** $$$ ###& State 2 State 2 GDP Pyruvate pm ol ox yge n/ s/ m g 0.0 0.5 1.0 1.5 2.0 2.5 *** $$$ ## *** $$$ ## RCR AD PFigure S2. Lipidomic analysis of BAT at E15.5 and E18.5. Related to Figure 2. Lipidomic analysis of BAT at E15.5 and E18.5 (MUFA, MonoUnsaturated Fatty Acids; SAFA, Saturated Fatty Acids; PUFA, Poly Unsaturated Fatty Acids; PE, Phosphatidylethanolamine; PC, Phosphatidylcholine; PS, Phosphatidylserine; PI, Phosphatidylinositol; TG, Triglyceride; FA, Fatty acid). Relative quantity corresponds to the ratio between the area of the molecule of interest and the internal standard. Results are expressed as means± s.e.m; **p < 0.01, by Mann and Whitney test).
Total TG E15.5 E18.5 0 10 20 30 40 ** Re la tiv e q u a n tit y
Total Neutral lipids
E15.5 E18.5 0 10 20 30 40 ** Re la tiv e q u a n tit y Total Cholesterol E15.5 E18.5 0 2 4 6 ** Re la tiv e q u a n tit y
Total neutral lipids %
E15.5 E18.5 0 50 100 150 % Cholesterol % Cholesterol Ester % TG Pe rce n ta g e Total FA E15.5 E18.5 0 10 20 30 40 ** Re la tiv e q u a n tit y Total FA % E15.5 E18.5 0 50 100 150 SAFA MUFA PUFA Pe rce n ta g e Total PC E15.5 E18.5 0 1000 2000 3000 4000 5000 ** Re la tiv e q u a n tit y Total PE E15.5 E18.5 0 100 200 300 400 ** Re la tiv e q u a n tit y Total PI E15.5 E18.5 0 50 100 150 200 250 Re la tiv e q u a n tit y Total PS E15.5 E18.5 0 20 40 60 80 ** Re la tiv e q u a n tit y
Glycoaminoglycan metabolism 14.5 15.5 16.5 Profile down 1 Profile down 2 Profile down 3 Profile down 4
Figure S3. Transcriptomic analysis of BAT between E14.5 and E16.5. Related to Figure 3. A. Identification of genes with different temporal expression profiles using the Short Time-series Expression Miner. The top 4 (based on their p-values) expression patterns of down-regulated genes are represented in red and the top 4 expression patterns of up-regulated genes in green. The number of genes associated with each pattern is written at the bottom left of each panel. Selection of GO-term corresponding to each pattern is indicated. The list of genes for each profile is given in the Supplementary Table 1. B, The myogenic factors Pax7 and Myod1 are downregulated between E14.5 and E15.5, E16.5 in BAT as shown by RT-qPCR analysis (reference gene:
36B4). C, Upregulation of genes of the brown adipocyte differentiation program between E14.5 and E16.5 as
shown by RT-qPCR analysis. Results are expressed as means ± s.e.m; *p < 0.05, **p < 0.01, ***p<0.001 by One-way ANOVA with Bonferroni post-hoc analysis, *referred to E14.5, $ to E15.5. D, Table of miRNA (miR), with their respective predicted targets, and their expression profile identified by Short time-series expression Miner (STEM) analysis.
Down-regulated gene profiles
Developmental biology Cell growth
Positive regulation of muscle cell differentiation
Regulation of stem cell differentiation Embryonic organ morphogenesis Stem cell proliferation
Regulation of animal organ morphogenesis
Skeletal muscle tissue development Skeletal cell differentiation
Skeletal muscle organ development
Brown fat cell differentiation
Up-regulated gene profiles
Superpathway of conversion of glucose to acetyl-coA and entry into the TCA cycle
Glucose metabolic process Fatty acid metabolism Regulation of lipid storage Oxydoreductase activity Pentose metabolic process
Diseases of metabolism Phospholipid biosynthesis
Metabolism of vitamins and cofactors
14.5 15.5 16.5 Profile up 1 Profile up 2 Profile up 3 Profile up 4
A
E14.5 E15.5 E16.5
0 20 40 60 80 $$$ *** * to E14.5 $ to E15.5 * Ppara Re la tiv e m RNA le ve l Prdm16
miR-133b miR-133b miR-299
miR-377 miR-377 miR-300
miR-380 miR-380
miR-382 miR-300
miR-411 miR-370
miR-299 miR-300
PGC1a miR-485 miR-543
miR-543 Tmem16 miR-1197 miR-181b miR-181b miR-376b miR-376b miR-544
PPARa miR-154 miR-154 miR-493 miR-493
Tbx15 miR-495 miR-495 miR-495 E14.5 E15.5 E16.5
0.0 0.5 1.0 1.5 *** * to E14.5 $ to E15.5 *** Pax7 Re la tiv e m RNA le ve l
E14.5 E15.5 E16.5
0 500 1000 1500 2000 $ * * to E14.5 $ to E15.5 Cidea Re la tiv e m RNA le ve l
E14.5 E15.5 E16.5
0 10 20 30 40 50 $$$ *** * to E14.5 $ to E15.5 Dio2 Re la tiv e m RNA le ve l
E14.5 E15.5 E16.5
0.0 0.5 1.0 1.5 2.0 2.5 * to E14.5 $ to E15.5 Prdm16 * ** Re la tiv e m RNA le ve l
B
down 1down 2 down 3 down 4
Profiles
C
D
Pr ed ic te d Ta rge tE14.5 E15.5 E16.5
0 20 40 60 80 $$$ *** * to E14.5 $ to E15.5 * Ppara Re la tiv e m RNA le ve l
E14.5 E15.5 E16.5 0.0 0.5 1.0 1.5 *** * to E14.5 $ to E15.5 *** Pax7 Re la tiv e m RNA le ve l
E14.5 E15.5 E16.5
0 10 20 30 40 50 $$$ *** * to E14.5 $ to E15.5 Dio2 Re la tiv e m RNA le ve l
E14.5 E15.5 E16.5 0.0 0.5 1.0 1.5 *** *** * to E14.5 $ to E15.5 Myod1 Re la tiv e m RNA le ve l
E14.5 E15.5 E16.5 0.0 0.5 1.0 1.5 *** *** * to E14.5 $ to E15.5 Myod1 Re la tiv e m RNA le ve l
Figure S4. Upregulation of lipogenic- and TCA cycle- related genes is associated with close proximity between mitochondria and LD during BAT differentiation. Related to Figure 3. A. Genes involved in lipogenesis are upregulated between E14.5 and E18.5, as shown by RTqPCR analysis (reference gene: Ppia). B, Schematic representation of the TCA cycle. C, Genes involved in the TCA cycle are upregulated between
E14.5 and E18.5, as shown by RTqPCR analysis (reference gene: Ppia). Results are expressed as means ±
s.e.m; *p < 0.05, **p < 0.01, ***p<0.001 by One-way ANOVA with Bonferroni post-hoc analysis, *referred to E14.5,$to E15.5,#to E16.5 and&to E17.5. D, TEM pictures show a strong proximity between lipid droplets (LD) and mitochondria (yellow stars) between E15.5 and E18.5 (G, Glycogen, SB 2µm).
E14.5 E15.5 E16.5 E17.5 E18.5
0 1 2 3 4 Fasn ### $$$ && Re la tiv e m RNA le ve l
E14.5 E15.5 E16.5 E17.5 E18.5
0 5 10 15 Dgat1 ### ***$$$ &&& # *** $$$ ***$$ Re la tiv e m RNA le ve l
E14.5 E15.5 E16.5 E17.5 E18.5
0 5 10 15 20 Agpat3 ### *** $$$ &&& ### *** $$$ Re la tiv e m RNA le ve l
E14.5 E15.5 E16.5 E17.5 E18.5
0.0 0.5 1.0 1.5 2.0 2.5 Acly ### *** $$$ & ** * Re la tiv e m RNA le ve l
E14.5 E15.5 E16.5 E17.5 E18.5
0 10 20 30 Dgat2 ### ***$$$ &&& ### *** $$$ Re la tiv e m RNA le ve l
A
Pyruvate Acetyl-CoA Citrate 2-Oxoglutarate Fumarate Malate Oxaloacetate Pyruvate Carboxylase Oxoglutarate Dehydrogenase Malate DehydrogenaseCitrate Synthase (Fig 3)
E14.5 E15.5 E16.5 E17.5 E18.5
0 5 10 15 Pcx (Pyruvate Carboxylase) ** $ * Re la tiv e m RNA le ve l
E14.5 E15.5 E16.5 E17.5 E18.5
0 2 4 6 8
Ogdh (Oxoglutarate Dehydrogenase)
** $ *** $$$ ### && Re la tiv e m RNA le ve l
E14.5 E15.5 E16.5 E17.5 E18.5
0 5 10 15 20 Fh1 (Fumarate Hydratase) *** $$$ ## *** $$$ ### Re la tiv e m RNA le ve l
E14.5 E15.5 E16.5 E17.5 E18.5
0 5 10 15 Mdh1 (Malate Dehydrogenase) *** $$$ ### *** $$$ ### ** Re la tiv e m RNA le ve l
B
C
* * * * * * * * * * * * * * * * * * * * * LD G LD G G G * * * * * * * * * * * * * * * * * * * * G G LD LD LD LD G GE15.5 E16.5 E17.5 E18.5