HAL Id: hal-00295695
https://hal.archives-ouvertes.fr/hal-00295695
Submitted on 20 Jul 2005
HAL is a multi-disciplinary open access
archive for the deposit and dissemination of
sci-entific research documents, whether they are
pub-lished or not. The documents may come from
teaching and research institutions in France or
abroad, or from public or private research centers.
L’archive ouverte pluridisciplinaire HAL, est
destinée au dépôt et à la diffusion de documents
scientifiques de niveau recherche, publiés ou non,
émanant des établissements d’enseignement et de
recherche français ou étrangers, des laboratoires
publics ou privés.
scavenging in a dense Saharan dust plume during
MINATROC
M. de Reus, H. Fischer, R. Sander, Valérie Gros, R. Kormann, G. Salisbury,
R. van Dingenen, J. Williams, M. Zöllner, J. Lelieveld
To cite this version:
M. de Reus, H. Fischer, R. Sander, Valérie Gros, R. Kormann, et al.. Observations and model
calculations of trace gas scavenging in a dense Saharan dust plume during MINATROC. Atmospheric
Chemistry and Physics, European Geosciences Union, 2005, 5 (7), pp.1787-1803.
�10.5194/acp-5-1787-2005�. �hal-00295695�
www.atmos-chem-phys.org/acp/5/1787/ SRef-ID: 1680-7324/acp/2005-5-1787 European Geosciences Union
Chemistry
and Physics
Observations and model calculations of trace gas scavenging in a
dense Saharan dust plume during MINATROC
M. de Reus1, H. Fischer1, R. Sander1, V. Gros1,3, R. Kormann1, G. Salisbury1, R. Van Dingenen2, J. Williams1, M. Z¨ollner1, and J. Lelieveld1
1Max Planck Institute for Chemistry, PO Box 3060, 55020 Mainz, Germany 2Joint Research Centre, Ispra, Italy
3now at: Laboratoire des Sciences du Climat et de l’Environnement (LSCE), Gif sur Yvette, France
Received: 13 January 2005 – Published in Atmos. Chem. Phys. Discuss.: 11 February 2005 Revised: 2 May 2005 – Accepted: 13 June 2005 – Published: 20 July 2005
Abstract. An intensive field measurement campaign was
performed in July/August 2002 at the Global Atmospheric Watch station Iza˜na on Tenerife to study the interaction of mineral dust aerosol and tropospheric chemistry (MINA-TROC). A dense Saharan dust plume, with aerosol masses exceeding 500 µg m−3, persisted for three days. During this dust event strongly reduced mixing ratios of ROx(HO2,
CH3O2and higher organic peroxy radicals), H2O2, NOx(NO
and NO2)and O3were observed. A chemistry boxmodel,
constrained by the measurements, has been used to study gas phase and heterogeneous chemistry. It appeared to be diffi-cult to reproduce the observed HCHO mixing ratios with the model, possibly related to the representation of precursor gas concentrations or the absence of dry deposition. The model calculations indicate that the reduced H2O2mixing ratios in
the dust plume can be explained by including the heteroge-neous removal reaction of HO2with an uptake coefficient of
0.2, or by assuming heterogeneous removal of H2O2with an
accommodation coefficient of 5×10⁻⁴. However, these het-erogeneous reactions cannot explain the low ROxmixing
ra-tios observed during the dust event. Whereas a mean daytime net ozone production rate (NOP) of 1.06 ppbv/hr occurred
throughout the campaign, the reduced ROx and NOx
mix-ing ratios in the Saharan dust plume contributed to a reduced NOP of 0.14–0.33 ppbv/hr, which likely explains the
rela-tively low ozone mixing ratios observed during this event.
Correspondence to: M. de Reus
(reus@mpch-mainz.mpg.de)
1 Introduction
The interaction between atmospheric aerosols and photo-chemistry via heterogeneous reactions has been subject to intense investigation during the last decades. As an example, heterogeneous reactions on polar stratospheric clouds lead to the destruction of stratospheric ozone (e.g. Crutzen and Arnold, 1986). Heterogeneous reactions on cloud droplets and aerosols are also found to be important for tropospheric chemistry (e.g. Lelieveld and Crutzen, 1990). Special em-phasis has been given to reactions on mineral dust aerosol (e.g. Usher et al., 2003), since these particles provide a large surface area for heterogeneous reactions in the troposphere (IPCC, 1996).
During several field campaigns a correlation between high dust loadings and low O3and HNO3concentrations has been
observed (e.g. de Reus et al., 2000; Hanke et al., 2003; Bona-soni et al., 2004). The latter authors also showed that dust-poor airmasses originating in North Africa had significantly higher O3concentrations than those which carried dust.
Chemical boxmodels as well as global and regional chemical-transport models have been used to calculate the reduction in trace gas mixing ratios due to heterogeneous re-actions on mineral dust aerosol. Most studies focussed on ozone and nitrogen species, while only a few studies report effects of mineral dust on OH and HO2mixing ratios. Zhang
et al. (1994) and Zhang and Carmichael (1999), for example, used a boxmodel to simulate the loss of SO2, NOx, HO2and
O3due to heterogeneous reactions on mineral dust aerosol.
Dentener et al. (1996) performed simulations with a global chemistry-transport model and calculated an O3reduction up
to 10% in and nearby dust source areas. De Reus et al. (2000) calculated a 30–40% reduction of O3in a Saharan dust plume
near the coast of Africa, attributed to the direct removal of O3by dust aerosol and the heterogeneous removal of HNO3.
Bauer et al. (2004) calculated a 5% reduction in global tro-pospheric ozone and concluded that this was mainly due to the uptake of HNO3on dust aerosol and not due to the direct
uptake of O3. However, the HNO3concentration was
over-estimated by the global model, which may have strongly bi-ased the results of this study. Bian and Zender (2003) inves-tigated the effect of reduced photolysis rates and heteroge-neous chemistry on the tropospheric trace gas mixing ratios. They concluded that both processes cause a combined de-crease in global mean O3of 0.7%, and 11.1% for OH, 5.2%
for HO2and 3.5% for HNO3. The effects of heterogeneous
removal reactions clearly dominated over the reduced pho-tolysis rates. Tang et al. (2004) performed a model study us-ing a regional-scale chemistry-transport model and compared the results with aerosol chemical composition measurements in a dust plume encountered during the ACE-Asia measure-ment campaign. They investigated both the reduction in solar (actinic) radiation and heterogeneous reactions on the dust aerosol. Low O3concentrations in the dust plume could only
be explained by heterogeneous reactions. It was inferred that the reduction of photolysis rates largely determines changes in OH concentrations, whereas the large decrease in HNO3
(up to 95%) and SO2(up to 55%) concentrations was due to
heterogeneous reactions.
Although all aforementioned studies indicate a strong in-fluence of mineral dust aerosols on tropospheric chemistry, the results are very different. This is mainly due to the large uncertainty in the uptake coefficients for the different trace gases on mineral dust aerosols. Moreover, for boxmodel calculations it has proven difficult to provide realistic initial conditions, and for all models the comparison with observa-tions is a main challenge.
In this study we use an alternative approach. We employ a chemical boxmodel to analyse measurements performed within a dense Saharan dust plume at the Iza˜na observatory on Tenerife, Canary Islands. We use the model to calculate the steady state concentrations of ROx, H2O2and HCHO and
compare them with observed values. For the model initiali-sation measured quantities are used to the extent possible. In addition to heterogeneous O3and HNO3 uptake and the
reduction of photolysis rates by mineral dust aerosol, as ad-dressed in previous studies, we focus on the effects of HO2
and H2O2 uptake in this study. Furthermore, we compare
the net ozone production rate in the Saharan dust plume with airmasses not containing dust.
2 The MINATROC experiment
The MINATROC (MINeral dust And TROpospheric Chem-istry) project was designed to investigate the effects of het-erogeneous reactions involving mineral aerosol on tropo-spheric chemistry. The project combined three types of re-search activities: laboratory experiments to quantify selected interactions between trace gases and mineral dust aerosol,
field experiments to study the influence of mineral dust on tropospheric chemistry under realistic conditions, and global model studies to put the results of the former two into per-spective. In this paper we will present observations of the second field experiment, performed in July/August 2002 at the Iza˜na observatory on the island of Tenerife, Spain.
Iza˜na observatory is part of the World Meteorological Or-ganisation (WMO) Global Atmospheric Watch (GAW) net-work, and is operated by the Spanish Meteorological Insti-tute. The station is situated on a mountain ridge on the is-land of Tenerife at 2360 m above sea level (a.s.l., 28◦180N, 16◦290W). Between 15 July and 15 August 2002 intensive
aerosol and trace gas measurements were performed. The influence of mineral dust on the chemistry of the troposphere could be studied extensively during this period, since, be-sides several smaller dust episodes, a major dust event was probed between 28 and 31 July 2002.
3 Instrumentation
Additional to the set of measurements of the global watch program at Iza˜na, intensive measurements of aerosols and trace gases were performed during MINATROC by different institutes.
The instruments to measure atmospheric trace gases were operated by the Max Planck Institute for Chemistry, Mainz, Germany, from two laboratory containers. A sample air in-let was placed at the roof of both containers about 4 m above the ground. The ROx instrument and the upward looking
JNO2and JO1D filter radiometers were deployed directly on
the roof of the container at about 3 m above ground level, while the downward looking JNO2and JO1D filter
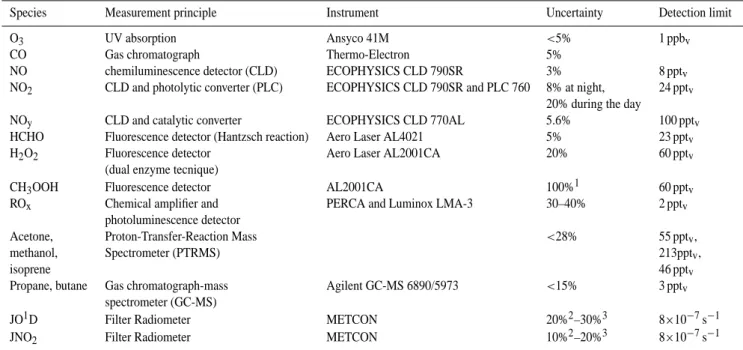
radiome-ters were mounted at a height of 1.5 m above ground level. Table 1 lists the trace gas instruments which are relevant for this study, together with their associated uncertainties and detection limits. Since most instruments are similar to the ones which have been used during the first MINATROC field experiment at Mt. Cimone in June 2000, a detailed descrip-tion of the O3, CO, ROx, NO and NOy instruments can be
found in Fischer et al. (2003). For the other instruments more details are given below.
A liquid chemistry fluorescence detector (AERO laser model AL 4021) was used to measure formaldehyde (HCHO). The instrument first strips the HCHO from the ambient air into a strongly diluted H2SO4 solution, after
which it reacts with acetylacetone and ammoniumacetate to form 3,5-diacetyl-1,4-dihydrolutidine (DDL) following the Hantzsch reaction. The fluorescence signal of the excited reaction product is detected by a photomultiplier at 510 nm. The same instrument has been employed during a previous aircraft campaign (Kormann et al., 2003).
For the determination of H2O2a second liquid chemistry
fluorescence detector has been used (AERO laser model AL 2001CA). After stripping H2O2 from the ambient air in a
Table 1. Instrumentation used for trace gas measurements during MINATROC.
Species Measurement principle Instrument Uncertainty Detection limit O3 UV absorption Ansyco 41M <5% 1 ppbv CO Gas chromatograph Thermo-Electron 5%
NO chemiluminescence detector (CLD) ECOPHYSICS CLD 790SR 3% 8 pptv NO2 CLD and photolytic converter (PLC) ECOPHYSICS CLD 790SR and PLC 760 8% at night,
20% during the day
24 pptv NOy CLD and catalytic converter ECOPHYSICS CLD 770AL 5.6% 100 pptv HCHO Fluorescence detector (Hantzsch reaction) Aero Laser AL4021 5% 23 pptv H2O2 Fluorescence detector
(dual enzyme tecnique)
Aero Laser AL2001CA 20% 60 pptv CH3OOH Fluorescence detector AL2001CA 100%1 60 pptv ROx Chemical amplifier and
photoluminescence detector
PERCA and Luminox LMA-3 30–40% 2 pptv Acetone, methanol, isoprene Proton-Transfer-Reaction Mass Spectrometer (PTRMS) <28% 55 pptv, 213pptv, 46 pptv Propane, butane Gas chromatograph-mass
spectrometer (GC-MS)
Agilent GC-MS 6890/5973 <15% 3 pptv JO1D Filter Radiometer METCON 20%2–30%3 8×10⁻⁷s−1 JNO2 Filter Radiometer METCON 10%2–20%3 8×10⁻⁷s−1 1Estimated uncertainty for the CH
3OOH measurements, see text. 2For solar zenith angles <60◦
3For solar zenith angles between 60◦and 70◦
slightly acidic solution, this instrument determines the total peroxide concentration by the liquid phase reaction of per-oxides with p-hydroxyphenylacetic acid, catalysed by perox-idase. To distinguish between H2O2and organic peroxides
two parallel channels are used. In one channel H2O2is
se-lectively destroyed by the enzyme catalase prior to the fluo-rescence detection in the instrument. The difference between the signals from both channels is a measure for the H2O2
concentration (Lazrus et al., 1986).
No quantification of organic peroxides can be achieved without knowing the specific peroxide composition in the atmosphere. This is due to the high variability in the rela-tive amounts of peroxides in ambient air, the large variations in Henry’s law constants, and, consequently, the collection efficiencies for these compounds. However, if we assume that the most abundant organic peroxide in the atmosphere is methylhydroperoxide (MHP, CH3OOH) and that the
collec-tion efficiency of MHP is 60%, an upper limit for the MHP mixing ratio can be determined. The obtained CH3OOH
mixing ratio should, however, be interpreted with consider-able care.
The calibration of both AERO laser detectors was carried out both in the gas and the liquid phase. HCHO calibra-tion gas was produced using a VICI Metronics permeacalibra-tion tube operated at a temperature of 80◦C, while for H2O2 a
home-built permeation device was used, consisting of a
semi-permeable polyethylene tube which was placed in a saturated H2O2environment (glass bottle with a small amount of 30%
H2O2solution, operated at a constant temperature of 30◦C).
Zero air (CAP60 Headline Filters air purifier) with a total flow of 6 L/min was mixed with the calibration gas stream leading to a mixing ratio of 13.3 ppbvHCHO and 5.9 ppbv
H2O2. Every 4–6 h calibration gas was added to the sample
air at the top of the sample mast, to determine the losses of HCHO and H2O2 in the inlet line. To test the stability of
the instrument, additional liquid calibrations were performed once a day with 1 µM HCHO and H2O2solutions.
Labora-tory calibrations show that 7.4%±2.7% of the H2O2is lost in
the inlet line, while no reduction of the HCHO mixing ratio was observed due to the long inlet line.
Measurements of a range of volatile organic carbons (VOC) were performed using a proton-transfer-reaction mass spectrometer (PTRMS). Inside this instrument organic species are chemically ionised by the proton transfer with H3O+ions and the products are detected with a quadrupole
mass spectrometer (Lindinger et al., 1998). In this study the measurements of acetone, methanol and isoprene are used. The isoprene mixing ratios measured with the PTRMS, how-ever, should be regarded as upper limits, due to other possi-ble contributions to this mass (Williams et al., 2001). More details about the measurement technique and calibration pro-cedure can be found in Salisbury et al. (2003).
For the measurement of non methane hydrocarbons (NMHC) stainless steel canister samples were taken every 3 or 6 h during the campaign, which were analysed in the laboratory of the Max Planck Institute in Mainz, using a gas chromatograph-mass spectrometer system (GC-MS). Due to the set-up of the GC-MS system only hydrocarbons with more than 2 C atoms were analysed. More details about the collection of the samples, the GS-MS system and its calibra-tion procedure can be found in Gros et al. (2003).
Aerosol measurements were performed from a mobile lab-oratory by the Joint Research Centre, Ispra, Italy. Dry aerosol size distributions in the size range 6–600 nm diameter were measured with a custom built Vienna type differential mo-bility analyser (DMA), using a TSI CPC model 3010 as particle counter (Thermo Systems Inc. Condensation Parti-cle Counter). The number size distribution of coarse parti-cles was determined with an Optical Particle Counter (OPC, GRIMM model 1.108) in 15 size classes from 300 nm to 10 µm diameter. Note that the aerosols entering the OPC have not been dried, however, for the low relative humidities (<60%) observed during the campaign, the observed aerosol diameter can be regarded as dry diameter. Combining the data of both instruments provides the aerosol size distribu-tion between 6 nm and 10 µm diameter, from which the to-tal aerosol surface area and volume was calculated. Toto-tal PM10 (particle diameter (Dp) <10 µm) aerosol mass was obtained on-line with a tapered element oscillating microbal-ance (TEOM) system, with a total uncertainty of ±15%.
4 Meteorology
The synoptic situation over the Canary Islands is usually dominated by a subtropical anticyclone, centred over the Azores (Carslaw et al., 1997). Deviations in the position of this anticyclone generally determine the origin of the air-masses observed at the Iza˜na observatory. During the MINA-TROC campaign in July/August 2002 four regions of origin could be identified based on backtrajectories calculated with the HYSPLIT model (HYbrid Single-Particle Lagrangian In-tegrated Trajectory, http://www.arl.noaa.gov/ready/hysplit4. html): north Atlantic, central Atlantic, tropical Africa and the Sahara region.
Several time periods with airmasses containing mineral dust, originating in the Sahara region and tropical Africa could be identified. The strongest Saharan dust plume was observed between 28 and 31 July. Aerosol index images from the TOMS satellite indicate that this dust plume originated in western Algeria and its border region with Mali and Mauri-tania. Backtrajectory calculations suggest that the airmasses were lifted from between 500 and 1500 m above ground level to the measurement altitude of about 2.5 km, 2.5 to 3 days be-fore arrival at the Iza˜na measurement station, and originate more to the southwest in Mauritania. Lidar measurements
indicate that the Saharan dust plume extended to an altitude of about 7 km (pers. comm. G. P. Gobbi, 2003).
5 Observations
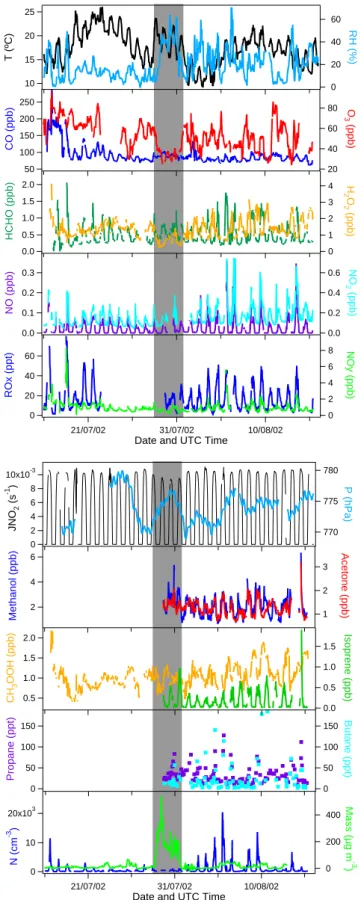
The mixing ratios of a selection of trace gases together with the observed temperature, relative humidity, aerosol number concentration and aerosol surface area are shown in Fig. 1. Continuous in-situ measurements were performed between 16 July and 15 August 2002. Due to instrument calibra-tions some short gaps occur in the dataset. A delay in the analytic gas shipment to the measurement station precluded ROxmeasurements between 22 July and 29 July. Moreover,
due to inlet problems no reliable measurements of acetone, methanol, isoprene and NMHC could be obtained before 29 July. The dataset has been reduced to 30 min averaged val-ues, except for the aerosol mass concentrations for which only hourly averages are available.
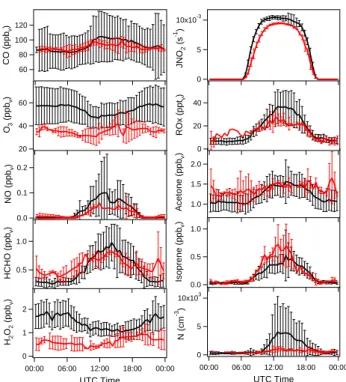
Figure 2 shows the average diurnal cycle for a selection of species observed during the campaign. A strong diurnal cy-cle was observed for most trace gases and the aerosol number concentration. This is mainly driven by local air circulation patterns at the measurement site, which are typical for a high-elevation mountainous site. During daytime the air flows up-ward to the sampling site resulting from surface warming (upslope winds), while downslope winds are observed dur-ing the night, due to cooldur-ing of the mountain slopes (Zaveri et al., 1995). As a result, free tropospheric air masses were observed during the night and airmasses influenced by an-thropogenic pollution from the local boundary layer during the day.
The fraction of boundary layer air which has been mixed into the free tropospheric airmasses at the measurement sta-tion has been estimated using relative humidity profiles ob-tained by radiosondes launched in Santa Cruz, the capital of Tenerife, situated at the south-western coast of the island (Schultz, 1995). For this method three water vapour mixing ratios are used: (1) the H2O mixing ratio measured at the
Iza˜na station (H2Oizo), (2) the H2O mixing ratio measured
by the radiosonde in the free troposphere at the same altitude as the measurement station (H2OF T)and (3) the H2O
mix-ing ratio measured by the radiosonde in the marine bound-ary layer at 100 m a.s.l. (H2OMBL). The mixing factor can
then be defined as: (H2Oizo– H2OFT)/(H2OMBL– H2OFT).
Since only two radiosondes were launched per day only one instantaneous daytime value for the mixing factor could be obtained per day. The daytime mixing factor ranged between
−30 and 65% and had a median value of 17% (N=28) in the dust-poor airmasses. During the major dust event the mea-surements were less influenced by local pollution. Since the dust event lasted for three days, only three numbers for the mixing factor could be determined, namely −30%, 0.8% and 17%, which were all below the median mixing factor of the dust-poor airmasses.
60 40 20 0 ROx (ppt) 21/07/02 31/07/02 10/08/02 Date and UTC Time
8 6 4 2 0 NOy (ppb) 0.3 0.2 0.1 0.0 NO (ppb) 0.6 0.4 0.2 0.0 NO 2 (ppb) 2.0 1.5 1.0 0.5 0.0 HCHO (ppb) 4 3 2 1 0 H 2O 2 (ppb) 250 200 150 100 50 CO (ppb) 80 60 40 20 O 3 (ppb) 25 20 15 10 T (ºC) 60 40 20 0 RH (%) 20x103 10 0 N (cm -3 ) 21/07/02 31/07/02 10/08/02
Date and UTC Time
400 200 0 Mass (µg m -3 ) 10x10-3 8 6 4 2 0 JNO 2 (s -1 ) 780 775 770 P (hPa) 6 4 2 Methanol (ppb) 3 2 1 Acetone (ppb) 150 100 50 0 Propane (ppt) 150 100 50 0 Butane (ppt) 2.0 1.5 1.0 0.5 CH 3 OOH (ppb) 1.5 1.0 0.5 0.0 Isoprene (ppb)
Fig. 1. Time series of the observed meteorological parameters, trace gas mixing ratios and aerosol number and mass concentrations during
10x103 5 0 N (cm -3) 00:00 06:00 12:00 18:00 00:00 UTC Time 40 20 0 ROx (ppt v ) 10x10-3 5 0 JNO 2 (s -1) 1.0 0.5 HCHO (ppb v ) 120 100 80 60 CO (ppb v ) 60 40 20 O3 (ppb v ) 2 1 0 H2 O2 (ppb v ) 00:00 06:00 12:00 18:00 00:00 UTC Time 0.2 0.1 0.0 NO (ppb v ) 1.0 0.5 0.0 Isoprene (ppb v ) 2.0 1.5 1.0 Acetone (ppb v )
Fig. 2. Diurnal variation of a selection of trace gases and the aerosol
number concentration during MINATROC. The red line represents the observations (and 1σ standard deviation) during the major Sa-haran dust event, the black line the data outside the dust event.
Note that biogenic emissions from vegetation at the slopes of the mountain close to the measurement site influence the observed trace gas mixing ratios at the measurement site in a different manner than anthropogenic emissions, which are transported over a much larger distance from the marine boundary layer. Hence, the calculated mixing factor is a good indicator for the influence of antropogenic pollution from the marine boundary layer, but not for the influence of more local biogenic emissions.
For CO, NOx, methanol, acetone and aerosols the upslope
winds resulted in an enhancement of the concentrations dur-ing the day, due to the intrusion of anthropogenic pollution from the boundary layer. On the other hand O3 and H2O2
mixing ratios were lower during the day, as a result of their positive vertical gradients in the lower atmosphere, mainly due to enhanced destruction of these species by dry deposi-tion at the surface. The ROxand HCHO mixing ratios closely
followed the solar radiation intensity. For these shorter lived species the diurnal variation is less affected by transport and much more dependent on local photochemical production, maximizing around local noon.
For a statistical analysis of the data, upslope and downs-lope conditions have been separated. Upsdowns-lope conditions could be identified by a strong enhancement in aerosol number concentration and occurred between 07:00 and 21:00 UTC (daytime), downslope conditions correspond-ingly between 21:00 and 07:00 UTC (nighttime). Average
Table 2. Average values for meteorological parameters, trace gas
mixing ratios and aerosol properties (aerosol number concentration (N), surface area (A), volume (V) and mass) observed during the Saharan dust event and for the dust-poor airmasses. The dataset is subdivided in daytime (upslope) and nighttime (downslope) condi-tions. Note that VOC and NMHC data are only available after 28 July. For all other parameters data from the entire campaign have been used to determine the average concentrations.
Daytime Nighttime dust poor dust event dust poor dust event Temperature (◦C) 18.2±3.5 20.0±1.6 15.8±3.3 17.2±1.6 RH (%) 19±11 35±13 16±12 37±15 CO (ppbv) 96±27 92±6 87±29 87±3 O3(ppbv) 52±12 35±6 58±15 36±3 HCHO (ppbv) 0.65±0.32 0.64±0.14 0.29±0.08 0.47±0.16 H2O2(ppbv) 1.24±0.38 0.64±0.28 1.72±0.55 0.61±0.25 CH3OOH (ppbv)1 1.0±0.26 0.93±0.16 1.1±0.34 0.99±0.21 NOx(ppbv) 0.26±0.20 0.17±0.07 0.10±0.04 0.11±0.05 NOy(ppbv) 1.14±0.75 0.74±0.24 0.77±0.38 0.51±0.20 ROx(ppt)2 43±16 28±6 – – Methanol (ppbv) 2.35±0.66 2.8±0.5 1.40±0.43 2.3±0.8 Acetone (ppbv) 1.34±0.31 1.4±0.13 1.05±0.23 1.3±0.24 Isoprene (ppbv) 0.27±0.21 0.35±0.26 0.03±0.02 0.05±0.02 Propane (pptv) 41±25 38±15 22±11 34±18 Butane (pptv) 35±37 15±6 13±31 24±28 N (cm−3) 1463±2451 551±230 261±186 364±119 A (µm2cm−3) 27±23 152±86 16±16 155±54 V (µm3cm−3) 3.8±4.1 50±29 3.4±4.7 55±19 Mass (µg m−3) 13±14 186±116 12±16 199±61 1The CH
3OOH given here is an upper limit for the atmospheric CH3OOH mixing ratio.
2For RO
xthe average daytime maximum mixing ratio is given.
daytime and nighttime values for the observed trace gas mix-ing ratios and aerosol number concentration, surface area, volume and mass are listed in Table 2.
Table 2 and Fig. 2 also distinguish airmasses containing dust from those which were not influenced by dust. Dur-ing the measurement campaign several Saharan dust events were probed with PM10 aerosol mass concentrations ex-ceeding 25 µg m−3. The most pronounced dust event was probed between 28 July, 16:45 UTC and 31 July, 15:15 UTC, when aerosol mass concentrations up to 500 µg m−3 were observed, and the aerosol optical thickness above the mea-surement station reached values of 0.95. In air masses which were not influenced by Saharan dust, these values were be-low 10 µg m−3and 0.5, respectively. For the analyses in this paper we focus on this major dust event and treat the minor dust events as “dust-poor” airmasses. The time period of the Saharan dust event has been marked by a grey box in Fig. 1. Some of the observed trace gases show a distinct change during the dust event. The most pronounced is the de-crease in ozone mixing ratio from about 65 ppbv just
dust event (ppbv=nmol/mol). At the same time relatively
low H2O2 mixing ratios were observed. In free
tropo-spheric air masses (nighttime), an average H2O2mixing
ra-tio of 0.61±0.25 ppbvwas observed during the dust period,
whereas it was 1.72±0.55 ppbv during the rest of the
cam-paign. Also Fig. 2 depicts significantly lower O3and H2O2
mixing ratios in airmasses containing dust compared to dust-poor air. Unfortunately no ROxmeasurements were
avail-able for the first half of the dust period, although during the second part of the dust period lower ROx peak values, i.e.
23 pptvat 30 July and 32 pptvat 31 July were observed
com-pared to the dust-poor days (43±16 pptv). Moreover, a
differ-ence in NOxmixing ratio was found between dust and
dust-poor airmasses, which could be a result of the suppressed transport of boundary layer air to the measurement station during the dust event. During upslope conditions 0.17 ppbv
NOxwas found in the dust plume, while 0.26 ppbvNOxwas
observed in the dust-poor airmasses. An additional and pos-sibly more significant effect may be the heterogeneous loss of HNO3and N2O5on the dust particles, which indirecty
de-plete NOx. The mean relative humidity during the Saharan
dust episode was 35%, with peak values up to 60%. This is high compared to the relative humidity observed during the rest of the campaign.
An inhibition of the acetone and methanol diurnal cycle could be observed throughout the dust event, with enhanced mixing ratios during the night, indicating a slightly altered nocturnal wind pattern. On the other hand, enhanced iso-prene mixing ratios were found in the dust plume during the day, indicating a greater influence of local biogenic emis-sions during the dust event. Furthermore, no significant change in the HCHO and CO mixing ratio was observed.
Although a strong decrease in the HNO3mixing ratio is
expected in a mineral dust plume (e.g. Dentener et al., 1996) and observed by Hanke et al. (2003), no significant change in the NOy mixing ratio was observed. This is due to the
fact that the NOyconverter measures the sum of all gaseous
nitrogen species and aerosol nitrate. Hence, the uptake of HNO3 on mineral dust aerosol is not expected to show up
in the NOy measurements. Remarkably, the mean daytime
aerosol number concentration is highest in the dust-poor air-masses, which may also be explained by a reduced mixing of boundary layer air in the dust plume. The much higher parti-cle surface area and mass concentration observed during the dust event indicates a very different aerosol size distribution in the dust loaded airmasses, with a higher number of larger particles. The small particles are probably scavenged by the larger Saharan dust aerosols in the plume, reducing the to-tal aerosol number concentration. The photolysis rates of O3
and NO2are reduced in the dust plume due to the absorption
and scattering of solar radiation by the dense aerosol. The average daytime JNO2photolysis rate decreased by 17% and
JO1D by 15% during the Saharan dust event compared to the rest of the campaign.
Table 3. Comparison of the median daytime and nighttime
(day/night) trace gas mixing ratios during the MINATROC cam-paign at Iza˜na and at Mt. Cimone and during the OCTA camcam-paign at Iza˜na in July/August 1993. For ROxonly a mean noontime value is given. Only the dust-poor data from MINATROC is used for this comparison.
Iza˜na Mt. Cimone1 Iza˜na2 Field campaign MINATROC MINATROC OCTA Time period July/August 2002 June 2000 July/August 1993 O3(ppbv) 52/59 56/60 38/40 CO (ppbv) 88/78 119/118 92/89 NOx(pptv) 210/95 267/197 76/47 NOy(ppbv) 0.95/0.66 0.90/1.0 0.52/0.39 HCHO (ppbv) 0.58/0.29 1.4/1.1 1.4/1.1 H2O2(ppbv) 1.17/1.63 n.a. 2.1/2.4 ROx(pptv) 43 31 65 1Fischer et al. (2003) 2Fischer et al. (1998)
Another interesting observation is the very high CO and O3mixing ratios during the first two days of the
measure-ment campaign, which could be attributed to long range transport of a biomass burning plume from large forest fires in Quebec, Canada, on 6–9 July 2002. During these two days CO mixing ratios as high as 290 ppbvand O3mixing ratios
of 100 ppbvwere observed. Although very interesting, this
period will not be further studied in this paper.
A comparison of the observed trace gas mixing ratios with observations made during the first MINATROC field cam-paign on Mt. Cimone in June 2000 (Fischer et al., 2003) is presented in Table 3. The Mt. Cimone station is situated at 2165 m a.s.l. on the highest mountain in the northern Ital-ian Apennines (44◦110N, 10◦420E). Due to its location in southern Europe, the sampled airmasses represent European continental background conditions. Similar O3 mixing
ra-tios have been observed at both measurements sites, while the CO and NOxmixing ratios were slightly lower at Iza˜na,
indicative of a more remote site, though influenced by conti-nental pollution. The HCHO mixing ratios observed at Iza˜na were, however, much lower than those observed at Mt. Ci-mone. The results from the MINATROC campaign are also compared with measurements at the Iza˜na observatory per-formed in July/August 1993 during the OCTA field campaign (Fischer et al., 1998). Compared to the measurements at the same site nine years earlier, slightly higher O3and NOx
mix-ing ratios and much lower HCHO and H2O2 mixing ratios
were observed in 2002. This appears to be consistent with an upward O3trend observed downwind of western Africa
(Lelieveld et al., 2004). The median nighttime CO mixing ratio in 2002 was 9 ppbv lower than that observed in 1993,
in line with the observed CO trend of −0.92±0.15 ppbv/yr
2003). The observed ROxmixing ratios were similar, taking
into account the large uncertainty in the ROxmeasurements .
6 Boxmodel calculations
To investigate photochemistry, net ozone production and the influence of Saharan dust aerosol on the mixing ratios of per-oxy radicals, formaldehyde and hydrogen peroxide, model calculations were performed with the chemistry box model MECCA (Module Efficiently Calculating the Chemistry of the Atmosphere). The chemical reaction scheme has been adopted from von Kuhlmann et al. (2003) and includes de-tailed chemistry of organic species with up to four C-atoms and isoprene (Sander et al., 2004). The reaction rates have generally been adopted from the Jet Propulsion Laboratory (JPL) 2003 database (Sander et al., 2003). Heterogeneous removal reactions of HO2and H2O2on mineral dust have
been added to the chemical scheme, analogous to de Reus et al. (2000). In total 67 chemical species, 110 gas phase chem-ical reactions, 34 photolysis reactions and 2 heterogeneous removal reactions were included (see electronic supplement). The boxmodel has been employed by constraining the con-centrations of relatively long-lived trace gases to the ob-served values (see next section for a detailed description), whereas the steady state concentrations of short-lived trace gases are calculated. Here, we focus on peroxy radicals, formaldehyde and hydrogen peroxide.
6.1 Input parameters
Since two sets of observations are available per hour, a model simulation is started every 30 min. Each simulation has been initialised with the observed temperature, pressure, O3,
CO, H2O, NO, H2O2, CH3OOH, acetone, methanol,
iso-prene, propane and butane mixing ratios, which are shown in Fig. 1. Short gaps for which data are missing have been filled through interpolation. HNO3 is initialised using the
observed NOz mixing ratio (NOz=NOy−NOx). Since NOy
also includes atmospheric aerosol nitrate, HNO3will likely
be strongly overestimated during the dust event when NOzis
used as a proxy for HNO3(see Sect. 5). Therefore, HNO3is
set to zero during the major Saharan dust event. For CH4and
CO2background mixing ratios for the year 2002 of 1.75 and
372 ppmv have been used, respectively. Since no
measure-ments of ethane, ethene and propene were performed during MINATROC, the mixing ratios of these species were scaled to the observed propane mixing ratio using the mean day-time mixing ratios observed during a former campaign at Iza˜na in July/August 1993 (Fischer et al., 1998). During this campaign the mean ratios of ethane, ethene and propene to propane were 10, 0.6 and 0.2, respectively.
JO1D and JNO2 photolysis rates were measured during
the campaign and have been used as reaction rates for the photolysis reaction of O3 (to O1D) and NO2, respectively.
Other photolysis rates have been calculated using the Tro-pospheric Ultraviolet-Visible (TUV, version 4.1) radiation model (Madronich and Flocke, 1998). For these calculations, the total ozone column measured with a Dobson spectrome-ter at the Iza˜na station has been used as input value, while default values for the SO2, NO2, cloud and aerosol optical
depth were used. To account for cloud overpasses and the reduction of solar radiation due to the Saharan dust plume, the calculated photolysis rates have been scaled to the ratio of the measured to the calculated JNO2photolysis rates.
A model simulation has been performed for every 30 min data point during daytime hours (solar zenith angle <70◦). The mixing ratios of the above listed trace gases, temper-ature, pressure and photolysis rates have been kept constant during each simulation, while the model was run for 10 days, to make sure that steady state was achieved. Since no VOC and NMHC data are available before 29 July, only the later part of the campaign has been analysed.
6.2 Gas phase chemistry
Before we performed model simulations for the MINATROC dataset, we first carried out some calculations to determine the time needed to reach steady state for different species. We defined the steady state time as the time the boxmodel needs to reach a mixing ratio which did not change more than 1‰ in the last 30 min. The steady state time has been de-termined for different solar zenith angles during a randomly chosen day during the campaign. When no isoprene is in-cluded in the model calculations, steady state concentrations of HCHO and ROxwere reached after 9 and 6 h, respectively,
at local noon and after 33 h for H2O2. At a solar zenith angle
of 70◦, steady state mixing ratios were reached within 10, 7
and 52 h for HCHO, ROxand H2O2, respectively. For larger
solar zenith angles a steady state HCHO, ROxand H2O2
mix-ing ratio could not be reached at all. Therefore, the simula-tions are limited to time periods during which the solar zenith angle is less than 70◦ (08:15–18:15 UTC), and each model simulation continues for 10 days, to ensure that steady state is achieved,.
Running the model for 10 days instead of the above de-fined steady state time does not lead to significantly different results, since the mixing ratios of HCHO, ROx and H2O2
do not change much after this point. For ROx and HCHO
the difference between the above defined steady state con-centration and the concon-centration after 10 days of simulation is smaller than 1%. For H2O2differences up to 8% at high
solar zenith angles can be found.
6.2.1 Reference run
The ROxmixing ratio calculated by the model without
het-erogeneous chemistry, for the period 29 July to 15 August 2002, is shown in Fig. 3a. ROxis the sum of HO2, CH3O2,
6 4 2 0 HCHO (ppb v ) 02/08/2002 06/08/2002 10/08/2002 14/08/2002
Date and UTC Time (b) 60 40 20 0 ROx (ppt v ) (a)
Fig. 3. Observed (blue dots) and modelled (red solid line, reference
run) ROxand HCHO mixing ratios. The green solid line represents the model calculation without isoprene. The major Saharan dust event is marked by the grey area.
peroxy radicals formed during isoprene degradation. The main constituents of the modelled ROx are HO2 (60%),
CH3O2(18%) and the peroxy radicals from isoprene
degra-dation (16%). The contribution of other higher organic peroxy radicals to the total ROx is very small, on
aver-age C2H5O2 contributes 0.06% to the total modelled ROx,
C2H3O3 5.6%, C3H7O2 0.01%, C3H6O2 0.17%, C3H5O3
0.08%, C4H9O20.02% and C4H9O40.003%. The ROx
mix-ing ratio is clearly overestimated by the model, and the mean ratio of the calculated to the observed ROxmixing ratio (ROx
calc/obs) is 1.70.
Figure 3b shows the calculated and observed HCHO mix-ing ratios. The HCHO mixmix-ing ratios are also strongly over-estimated by the model. The daytime maximum HCHO mixing ratio calculated by the model ranges between 1.5 and 7.5 ppbv, while the observed values vary between 0.7
and 1.7 ppbv. The mean ratio of the calculated to observed
HCHO mixing ratio (HCHO calc/obs) equals 2.29, however, a good correlation can be found between the observed and calculated HCHO mixing ratios. When fitting a straight line through the data points, the correlation coefficient r is 0.80.
Possible reasons for the model overestimation of both the ROx and HCHO mixing ratios could either be an
underes-timation of the observed HCHO and ROxmixing ratios, an
overestimation of the precursor gas concentrations, which are used as input for the calculations or unknown model errors. Moreover, the assumption that the airmass is in steady state might be erroneous.
A comparison of the HCHO and ROx mixing ratios with
a previous measurement campaign at Iza˜na shows that the HCHO mixing ratios are a factor 2 lower than those observed nine years earlier, however, during this campaign the HCHO measurements were probably overestimated due to a spectral interference to CH4(Fischer et al., 1998). The ROxmixing
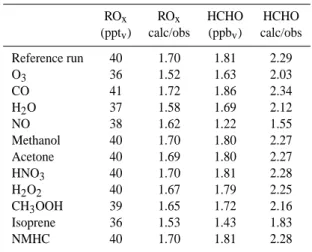
Table 4. Calculated ROx and HCHO mixing ratios and
calcu-lated/observed ratios for the sensitivity runs in which the mixing ratio of the trace gas in column 1 has been reduced by a factor 2 compared to the reference run.
ROx ROx HCHO HCHO (pptv) calc/obs (ppbv) calc/obs Reference run 40 1.70 1.81 2.29 O3 36 1.52 1.63 2.03 CO 41 1.72 1.86 2.34 H2O 37 1.58 1.69 2.12 NO 38 1.62 1.22 1.55 Methanol 40 1.70 1.80 2.27 Acetone 40 1.69 1.80 2.27 HNO3 40 1.70 1.81 2.28 H2O2 40 1.67 1.79 2.25 CH3OOH 39 1.65 1.72 2.16 Isoprene 36 1.53 1.43 1.83 NMHC 40 1.70 1.81 2.28
ratios are similar considering the large uncertainty in the ROx
measurements (see Table 3). The influence of the input con-centrations of different precursor gases for HCHO and ROx
will be studied in the next section.
6.2.2 Sensitivity simulations
To investigate the effects of a range of model input parame-ters, several sensitivity studies have been performed in which the mixing ratio of one trace gas has been reduced by a fac-tor two compared to the reference run. The results are sum-marised in Table 4.
The calculated ROxmixing ratio is rather insensitive to the
changes in the input mixing ratios of most trace gases, except for O3and H2O, which are direct precursors of HO2, and for
isoprene, which is a main precursor for different organic per-oxides. Since the organic peroxy radicals, not originating from isoprene, contribute only 6% to the total peroxy radical mixing ratio, changes in the higher hydrocarbon concentra-tions do not have a significant effect on the calculated ROx
mixing ratio.
The simulated HCHO mixing ratio is more variable, and especially sensitive to the input concentration of NO. A re-duction of the NO mixing ratio by a factor 2 causes the HCHO mixing ratio to decrease by 33%. At low NO mix-ing ratios the production of HCHO mainly occurs via the re-action of HO2with CH3O2and the subsequent photolysis of
CH3OOH, while at higher NO mixing ratios, the HCHO
pro-duction is dominated by the faster reaction of CH3O2 with
NO, leading to an enhanced production of HCHO.
The simulated HCHO mixing ratio is also sensitive to the input concentration of isoprene (21% reduction of HCHO when the isoprene mixing ratio is reduced with a factor 2),
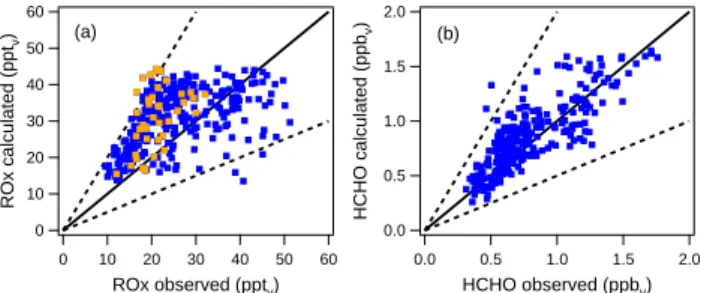
60 50 40 30 20 10 0 ROx calculated (ppt v ) 60 50 40 30 20 10 0 ROx observed (pptv) (a) 2.0 1.5 1.0 0.5 0.0 HCHO calculated (ppb v ) 2.0 1.5 1.0 0.5 0.0 HCHO observed (ppbv) (b)
Fig. 4. Comparison between the calculated and observed ROx(a)
and HCHO (b) mixing ratios (blue dots) for the model run without isoprene. The orange dots represent the ROxmixing ratios during the major Saharan dust event. The solid black line represents the 1:1 relationship, the dashed lines the 1:2 and 2:1 relationships.
O3 (10%), H2O (7%) and CH3OOH (5%). Isoprene and
CH3OOH are precursor gases of HCHO, so a reduction in the
mixing ratio of these trace gases will directly result in a re-duced HCHO production. O3and H2O influence the HCHO
mixing ratio through the change in OH mixing ratio. If the concentration of O3or H2O is reduced, less OH is produced
via the reaction of H2O with O1D and less OH will be
avail-able for the destruction of VOCs and notably isoprene, which results in a reduced production of HCHO.
The above described sensitivity studies show that the ROx
and HCHO mixing ratios are most sensitive to the mixing ra-tio of NO, O3, H2O, CH3OOH and isoprene. From these
gases, the measurement uncertainty, and hence the uncer-tainty of the boxmodel input mixing ratios, of isoprene and CH3OOH is the largest.
As has been discussed in the observations section, the iso-prene mixing ratio is probably determined by emissions close to the measurement station. Therefore, the airmass may not have reached equilibrium with respect to isoprene. We in-tend to calculate the equivalent isoprene mixing ratio, which corresponds to the observed HCHO and ROxmixing ratios.
While doing so we found that a simulation without taking isoprene into account provides the best agreement with the measurements, indicating that isoprene may not have a sig-nificant effect on the observed HCHO and ROxmixing ratio
and that the effect of the emissions of isoprene (and other biogenic compounds) on the HCHO budget will first show up during further evolution of the airmass.
Moreover, the isoprene mixing ratios observed during MI-NATROC were high relative to the isoprene mixing ratios observed during the OCTA campaign at Iza˜na in July/August 1993 (Fischer et al., 1998). Excluding the measurements per-formed during the major dust event, the mean isoprene mix-ing ratio was 270±206 pptv during the day and below the
detection limit at night. This is a factor 4.5 higher than the mean daytime isoprene mixing ratio observed during OCTA, which was 60±124 pptv(Fischer et al., 1998).
Putting the isoprene mixing ratio to zero leads to decreases in both the HCHO and ROxmixing ratios. The mean calc/obs
ratio of ROxdecreases from 1.70 in the reference run to 1.31
in the run without isoprene. The contribution of the different peroxy radicals to the total ROxmixing ratio changes, since
no organic peroxy radicals are formed during the isoprene degradation. The main constituents of ROx are still HO2
(72%) and CH3O2(26%), while the contribution of other
or-ganic peroxy radicals decreases to 2%. The effect of isoprene on the HCHO mixing ratio is even stronger than on ROx. The
calc/obs ratio of HCHO decreases from 2.29 in the reference run to 1.12 in the run without isoprene.
A detailed comparison between the observed and mod-elled ROxmixing ratios is shown in Fig. 4a. Here the solid
line represents the ideal 1:1 relationship between the mod-elled and observed values, while the dashed lines correspond to a deviation of this ideal relationship by a factor of 2, which about equals the total uncertainty of all measured parame-ters used as input for the model calculations. In total 304 model data points could be used for the comparison with ob-servations, from which 97% agree within a factor of two. A straight line fit through the calculated and observed ROx
mixing ratios gives a linear correlation coefficient r of 0.50. The diurnal variation and the absolute mixing ratios of HCHO are captured well by the model (see Fig. 3b). On average the model slightly overestimates the HCHO mixing ratio, the mean ratio of the calculated HCHO mixing ratio to the observed HCHO mixing ratio (HCHO calc/obs) is 1.12. From the 272 data points, 99% of the calculated HCHO mix-ing ratios are within a factor two of the observed HCHO mixing ratios (see Fig. 4b). Moreover, a good correlation is found between the observed and calculated HCHO mixing ratios. When fitting a straight line through the data points in Fig. 4b, the correlation coefficient r is 0.82.
Previous model studies using three dimensional global chemistry-transport or boxmodels have also investigated the HCHO budget. The comparison between modelled and ob-served HCHO concentrations provides very different results. In the remote marine boundary layer (Ayers et al., 1997; Weller et al., 2000) and the upper free troposphere (Kor-mann et al., 2003; Jaegle et al., 2000) models tend to un-derestimate the concentration of HCHO. For the above men-tioned marine boundary layer calculations this could at least partly be explained by a lack of higher hydrocarbons in the model, however, for the upper troposphere including higher hydrocarbons did not reproduce the high concentrations ob-served. For the polluted marine boundary layer and the lower free troposphere HCHO mixing ratios are generally overesti-mated by models (e.g. Wagner et al. 2002; Zhou et al., 1996). Possible explanations for the overprediction of HCHO by models are deficiencies in considering dry deposition, mul-tiphase chemistry in aerosols and clouds or halogen chem-istry in the marine boundary layer. On the other hand, Ol-son et al. (2004) found a good agreement between observed and modelled HCHO mixing ratios between 60 and 500 pptv
in the free troposphere. At higher HCHO concentrations the model increasingly underpredicts HCHO, which could be ex-plained by the transport of very polluted airmasses.
To investigate the effect of dry deposition in our sim-ulations we included a sinusoidal dry deposition rate for HCHO analogous to H2O2, which is explained in detail in
the next section. A noon time maximum dry deposition rate of 8.4×10⁻⁷s−1 is necessary to achieve good agreement between the calculated and observed HCHO mixing ratios. This is more than the dry deposition rate necessary to ex-plain the H2O2 measurements (see next section). Based on
the difference in solubility and reactivity, the dry deposition velocity of H2O2 should at least be a factor 2 higher than
HCHO (L. Ganzeveld, pers. comm., 2004), hence dry depo-sition can only partly explain the difference between model and observations.
6.2.3 Discussion
In this section we will discuss if the setup of the boxmodel is appropriate for the model simulations which are presented in this work. We will focus on the following three questions. Is it realistic to assume that the airmass is in steady state, when it takes the model up to 10 h to reach a steady state mixing ratio for HCHO and ROx? Wouldn’t it be more appropriate
to include a diurnal cycle of the photolysis rates, so that the photochemical components are simulated in a more realistic way? Why is the temporal development of the trace gases not taken into account during the simulations?
The model is used to calculate steady state concentrations and not to simulate the history of the airmass. By keeping the concentrations of relatively long lived trace gases and the photolysis rates constant we tried to simulate the “po-tential” concentrations of the gases when the airmass would have been in photochemical steady state. So we do not intend to perform a lagrangian simulation.
The definition of steady state time used in this paper is very harsh. Compared to the uncertainty of the measurements and the model a change of 1 in 30 min is very small. Neverthe-less, steady state mixing ratios of HCHO and ROxcould be
reached within a day.
The airmasses arriving at the measurement station orig-inate partly from the free troposphere and partly from the marine boundary layer. On average the contribution of the marine boundary layer was 17%. It is realistic to assume that the mixing ratios of the long lived trace gases, which are used as input for the boxmodel, in the free tropospheric airmass do not change dramatically within 6–10 h. The ma-rine boundary layer airmass, however, is subject to anthro-pogenic emissions in the coastal area and to biogenic emis-sions closer to the measurement site. We could show that the airmass was probably not in steady state with respect to isoprene, which has been emitted close to the measurement station, and that removing isoprene from the calculations did improve the agreement between observations and boxmodel calculations. Considering the average wind speed and wind direction of the measurement station during MINATROC, the average transport time of the airmass from the marine
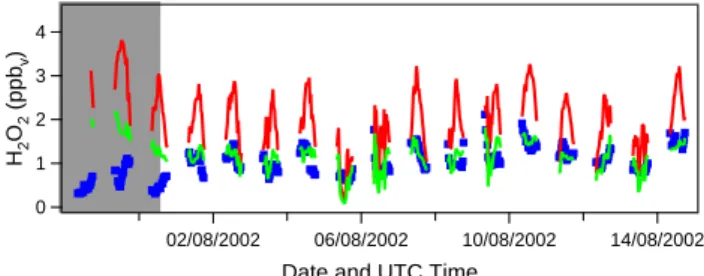
4 3 2 1 0 H2 O2 (ppb v ) 02/08/2002 06/08/2002 10/08/2002 14/08/2002
Date and UTC Time
Fig. 5. Observed (blue dots) and calculated (red solid lines) H2O2
mixing ratios for the model run in which the mixing ratios of H2O2 are not fixed to the observed values. The green solid line represents the model run in which dry deposition of H2O2is included. The major Saharan dust event is marked by the grey area.
boundary layer to the measurement station is estimated to be 1.5 h. After 1.5 h of simulation the ROxmixing ratio reached
93% of its end mixing ratio (after 10 days of simulation) and HCHO 69%. Taking into account the average contribution of marine boundary layer air of 17%, we estimated an uncer-tainty of 5% and 1% for HCHO and ROx, respectively, due
to this possible non steady state.
These numbers also show the uncertainty of the model simulations early during the day. 1.5 h after sunrise the steady state ROx mixing ratio was reached by 93% and
HCHO by 69% providing an uncertainty of 7% and 31% for ROxand HCHO, respectively. Note that the first simulations
we presented were at 08:15 UTC, which is about 2 h after sunrise.
In a further development of the boxmodel a diurnal cycle of the photolysis rates has been implemented, analogous to the work of Olson et al. (2004), to account for the diurnal cycle of photochemical components. From these simulations a diurnal steady state mixing ratio can be determined. With this setup of the model the NO mixing ratio cannot be fixed but a diurnal emission pattern had to be included so that the resulting NO concentration was similar to the observed con-centration. First tests with the new setup of the model for another measurement campaign, did not show large differ-ences between the two approaches (fixed photolysis rates or a diurnal cycle in the photolysis rates), however this com-parison has been done for a single model run in the upper troposphere, and provides no statistically significant results.
6.2.4 Simulation of hydrogen peroxide
Since we focus on the ability of the model to simulate ob-served H2O2mixing ratios, a model simulation has been
per-formed in which H2O2 is not fixed to the measured mixing
ratio but has been calculated freely by the model. For this, the model run without isoprene is taken as a reference. The results of this simulation are shown in Fig. 5. The H2O2
mixing ratio calculated by the model is much higher than the observed H2O2mixing ratio (H2O2calc/obs=2.16). This is
mainly due to the fact that dry deposition of H2O2at the
sur-face is not included in the model.
The discrepancy between the calculated and observed val-ues is largest during the Saharan dust event. Due to the high relative humidity observed during this period, relatively high H2O2mixing ratios are calculated, while much lower mixing
ratios were observed. Excluding the dust data points from the total dataset gives a much better agreement between ob-served and calculated values. For the dust-poor period, the mean calc/obs ratio of H2O2is 1.75.
To improve the agreement between the observed and mod-elled values, we included a sinusoidal dry deposition rate for H2O2in the model, with the highest deposition rate at local
noon, when the upslope winds and turbulent exchange in the boundary layer are relatively strong. Dry deposition was pa-rameterised such that after each steady state calculation the concentration of H2O2was reduced according to this dry
de-position rate. A calc/obs ratio of H2O2of one was obtained
(for the dust-poor period) when a maximum dry deposition rate of 6.5×10⁻⁷s−1at local noon was assumed, correspond-ing to a removal fraction of 56%. For the complex meteoro-logical situation at the measurement station with mixing of boundary layer air, which is subject to dry deposition and free tropospheric air, which is likely not influenced by dry deposition, it is difficult to translate this dry deposition rate into a deposition velocity. The results of this simulation are also presented in Fig. 5. From this figure it is clear that even if dry deposition is included in the model calculations, the H2O2mixing ratio is still strongly overestimated during the
major Saharan dust event. A reason for this may be the up-take of H2O2and/or HO2on the surface of the dust aerosols,
which will be investigated in the next section.
6.3 Heterogeneous chemistry
The observations during the Saharan dust event show re-duced mixing ratios of ROxand H2O2. The reduced H2O2
mixing ratios could not be explained by gas phase chemistry or through the reduction in photolysis rates. Even after in-cluding dry deposition the model strongly overestimates the H2O2mixing ratios during the dust event. Also the ROx
mix-ing ratios are overestimated by the (gas phase) model durmix-ing the dust event, however, there is no clear relation with the presence of Saharan dust. To investigate the influence of Sa-haran dust aerosol particles on the mixing ratio of peroxy radicals and hydrogen peroxide, heterogeneous uptake reac-tions of HO2 and H2O2 have been included in the model.
Note that radiation effects of mineral dust aerosol have been accounted for by the scaling of the photolysis rates to the observed JNO2value.
6.3.1 Heterogeneous removal reactions
The removal rate of gas-phase species j by aerosol particles can be described by a pseudo-first-order rate coefficient kj
(s−1), given by Heikes and Thompson (1983):
kj = r2
Z
r1
kd,j(r)n(r)dr (1)
where n(r)dr (cm−3)represents the number concentration of particles with a radius between r and r+dr, and kd,j(r)is
the size dependent mass transfer coefficient (cm3s−1), which can be calculated using the Fuchs and Sutugin (1970) inter-polation equation:
kd,j =
4π DjV
1 + Kn(x + 4(1 − α)/3α) (2)
where Dj (cm2s−1)is the gas phase molecular diffusion
co-efficient of species j , V the ventilation coco-efficient, which is close to unity, and Kn the dimensionless Knudsen number, defined as the ratio of the effective mean free path of a gas molecule in air, λ, to the particle radius r. α is the mass accommodation coefficient, a dimensionless number defined as the number of molecules adsorbed by the surface of an aerosol divided by the number of collisions with the aerosol;
x represents a correction factor for anisotropic movement and is dependent on the Knudsen number (Fuchs and Sutu-gin, 1970).
In the laboratory much effort has been undertaken to de-termine the reactive uptake coefficient (γ ) of different at-mospheric gases on mineral dust aerosol (e.g. Usher et al., 2003; Hanisch and Crowley, 2003; Underwood et al., 2001). The reactive uptake coefficient represents the fraction of col-lisions with a particle that leads to irreversible loss of the gas (thus including chemical reactions). For the calculation of the heterogeneous removal rate the accommodation coef-ficient α needs to be known, denoting the probability that a gas molecule, colliding with an aerosol particle, will be (physically) incorporated into the particle. Since we do not explicitly account for chemical reactions in the condensed phase, we substitute α by γ . Since γ is a measure for the net transfer of the species to the aerosol particle, α represents an upper limit of γ .
Unfortunately no laboratory studies of the uptake of the HO2 radical on mineral dust aerosol are documented,
how-ever, a few studies are performed to determine the uptake of HO2 on different types of surfaces. Hanson et al. (1992),
for example, determined the uptake of HO2on a water and
sulphuric acid surface and found reactive uptake coefficients of >0.01 and >0.05, respectively, while Cooper and Abbatt (1996) measured net uptake coefficients for HO2radicals on
supercooled sulphuric acid water-ice surfaces of 0.055 and 0.025, respectively. The presence of free Cu ions in the aerosol enhances the uptake of HO2 on aqueous surfaces
significantly (Mozurkewich et al., 1987). In a review Jacob (2000) concludes that the uptake of HO2by aqueous aerosols
takes place with a γ of 0.1–1, and he recommends including the uptake of HO2 by aerosols with γ =0.2 in atmospheric
chemistry models. This is also the value of γ we deploy in this study. The author also concludes that although the mech-anism for HO2uptake is uncertain, H2O2is the likely product
(Jacob, 2000).
Even fewer laboratory studies have been conducted on the uptake of H2O2on different types of surfaces. Worsnop et
al. (1989) determined the mass accommodation coefficient of H2O2on aqueous surfaces. They found a strong negative
temperature dependence of the mass accommodation coef-ficient, with an uptake coefficient of 0.18±0.02 at 273 K. Clegg and Abbatt (2001) determined the absolute uptake of H2O2on an ice surface to be 4×10⁹molecules cm−2, at an
average ambient H2O2 mixing ratio of about 1 ppbv. For
the maximum aerosol surface area of 500 µm2/cm3observed during the major Saharan dust event during MINATROC, this will cause a negligible decrease in H2O2mixing ratio of
much less than 1%. To our knowledge no laboratory studies on the uptake of H2O2on mineral dust aerosol have been
per-formed, therefore, different uptake coefficients will be tested in this study, starting with the value of 0.18.
The heterogeneous removal rate for HO2 and H2O2 has
been calculated off-line using the observed aerosol size dis-tribution, temperature and pressure. For this, the complete size range from 6 nm to 10 µm has been taken into account.
Trajectory analyses indicate that the dust-loaded airmasses travelled about 3 days from the source region in Africa (west-ern Algeria and Mauritania) to the measurement station. To calculate a realistic uptake coefficient we have to use a real-istic time for dust uptake. Therefore, heterogeneous removal reactions were only activated the last three days of the sim-ulation. We realise that here we mix up the steady state and lagrangian approach of the boxmodel.
6.3.2 Results of heterogeneous chemistry calculations
To find the accommodation coefficient for the heterogeneous uptake of H2O2 on Saharan dust particles we altered the
H2O2accommodation coefficient until the calc/obs ratio of
H2O2 was equal to one. For this all data points starting
at 29 July were used and dry deposition, as described in Sect. 6.2.3, was included. When the uptake coefficient for aqueous surfaces is used (γ =0.18) almost all H2O2is
scav-enged and the calc/obs ratio of H2O2decreases to 0.04. A
calc/obs ratio of H2O2of one was found for a much lower
accommodation coefficient, 5×10⁻⁴. The corresponding av-erage removal rate of H2O2, kj, during the major dust event
was 8×10⁻⁶s−1. The results of the simulation with this ac-commodation coefficient are shown in Fig. 6a. From the 265 data points 93% of the modelled H2O2 mixing ratios were
within a factor of 2 of the observed mixing ratio.
The influence of the reduced H2O2mixing ratios on ROx
appears to be relatively small; the calc/obs ratio of ROx
de-creases from 1.38 in the run without heterogeneous removal reactions to 1.36 in the run with H2O2scavenging. Hence,
the reduced ROxmixing ratios observed during the dust event
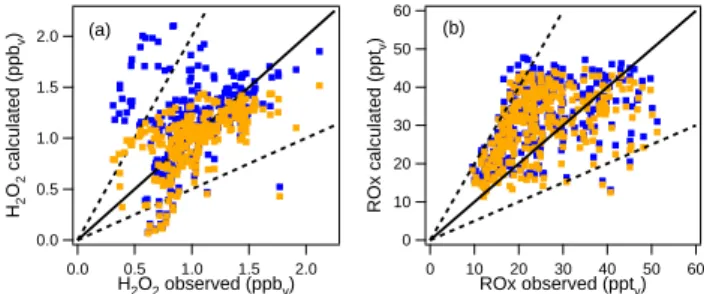
60 50 40 30 20 10 0 ROx calculated (ppt v ) 60 50 40 30 20 10 0 ROx observed (pptv) (b) 2.0 1.5 1.0 0.5 0.0 H2 O2 calculated (ppb v ) 2.0 1.5 1.0 0.5 0.0 H2O2 observed (ppbv) (a)
Fig. 6. Comparison between the calculated and observed H2O2and
ROxmixing ratios (blue dots). The orange dots represent the model run including heterogeneous removal of (a) H2O2(γ =5×10⁻⁴)and
(b) HO2(γ =0.2) on Saharan dust aerosol. The solid black line
rep-resents the 1:1 relationship, the dashed lines the 1:2 and 2:1 rela-tionships.
cannot be explained by heterogeneous removal of H2O2on
Saharan dust aerosol. Therefore, we investigated the effect of heterogeneous removal of HO2on Saharan dust particles
on the ROx mixing ratio. For this an uptake coefficient of
0.2 is assumed, according to the recommendation of Jacob (2000), corresponding to a first order rate coefficient, kj, of
2×10⁻³s−1 during the major dust event. Two simulations were performed: one in which the HO2 is irreversibly
re-moved by the dust aerosols, and one in which one molecule of H2O2is produced on the surface of a dust particle for each
molecule HO2which is taken up.
In spite of the relatively high uptake coefficient, hetero-geneous removal of HO2 causes only a small decrease in
the ROx mixing ratio. The calc/obs ratio of ROxdecreases
from 1.38 in the run without heterogeneous removal reac-tions to 1.30 in the run with heterogeneous removal of HO2
(see Fig. 6b). Even when an uptake coefficient of 1 is as-sumed the model still overestimates the ROx mixing ratio
(ROxcalc/obs=1.14). The relatively small change in the
cal-culated ROxmixing ratio indicates that the heterogeneous
re-moval reaction of HO2is slow compared to the fast gas phase
production and destruction reactions of HO2. The effect of
heterogeneous removal of HO2 on the H2O2 mixing ratio,
however, is very strong. The H2O2mixing ratio decreases to
almost the observed value (H2O2calc/obs=1.05) when
het-erogeneous removal of HO2with an uptake coefficient of 0.2
is included in the model. Hence, if no H2O2is formed during
the uptake reaction of HO2 on Saharan dust particles, only
including heterogeneous removal of HO2 leads to a good
agreement between the calculated and observed H2O2
mix-ing ratios. Note that a calc/obs ratio of H2O2of exactly one
is reached when heterogeneous removal of H2O2with an
ac-commodation coefficient of 7×10⁻⁵is additionally included in the model.
If we assume that H2O2is formed when HO2is taken up
in the Saharan dust aerosol the H2O2mixing ratio increases
strongly compared to the run without heterogeneous chem-istry, while the effect on ROxis marginal. During the major
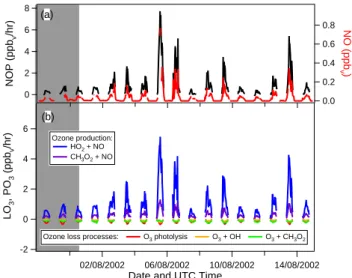
8 6 4 2 0 NOP (ppb v /hr) 0.8 0.6 0.4 0.2 0.0 NO (ppb v) (a) 6 4 2 0 -2 LO 3 , PO 3 (ppb v /hr) 02/08/2002 06/08/2002 10/08/2002 14/08/2002 Date and UTC Time
Ozone production: HO2 + NO
CH3O2 + NO
Ozone loss processes: O3 photolysis O3 + OH O3 + CH3O2 (b)
Fig. 7. Calculated net ozone production rate (NOP) for the
MINA-TROC campaign (a) and partitioning of the different production and loss processes (b). The major Saharan dust event is marked by the grey area.
dust event the calculated H2O2mixing ratio exceeds 5 ppbv,
and an average calc/obs ratio of H2O2of 1.89 is calculated.
Heterogeneous removal of H2O2with an accommodation
co-efficient of 2×10⁻³had to be included to restore the
agree-ment between calculated and observed values.
6.4 Ozone production rates
The model calculations have been set up to calculate the steady state concentrations of relatively short lived trace gases, while the observed mixing ratios of longer lived species, including ozone, were used as input parameters. This precludes the comparison of calculated and observed O3mixing ratios, and drawing conclusions about for
exam-ple ozone uptake on Saharan dust particles. This would re-quire a model calculation along a back-trajectory, however, the concentration values needed to constrain the model over the dust source region are not available.
Instead, we focus on the calculation of the net ozone pro-duction rate (NOP) during the campaign, to try to explain the low ozone mixing ratios observed during the major dust event by changes in the ozone production and loss rates. The method to determine the NOP has been introduced by Liu et al. (1980) and is summarised below. A detailed description of the procedure can also be found in Fischer et al. (2003) for the first part of the MINATROC project.
The net ozone production rate can be described as the difference between the ozone production (PO3={k1[HO2]+k2[CH3O2]}[NO]) and loss rates
(LO3=(f ×JO1D+k3[OH]+k4[HO2]) [O3]), where k1
and k2 are the reaction rates of the reaction of NO with
HO2 and CH3O2, respectively, f is the fraction of O1D
atoms reacting with H2O to produce OH rather than being
deactivated through collisions with air molecules, JO1D is
the photolysis rate of O3, and k3 and k4 are the reaction
rates of the reaction of O3 with OH and HO2, respectively.
In this approach, it is assumed that ozone loss due to dry deposition, heterogeneous reactions, uptake in cloud droplets and reactions with unsaturated VOCs are negligible. The mixing ratios of NO, O3, H2O (needed to calculate f)
and the ozone photolysis rate were measured during MINA-TROC, while the OH, HO2 and CH3O2mixing ratios were
calculated by the model (the run without isoprene is used here). The net ozone production rate is shown in Fig. 7a, and ranges between 0 and 7 ppbv/hr. During the major dust
event relatively low ozone production rates are calculated. The daytime mean NOP is 0.33±0.24 ppbv/hr during the
ma-jor dust event and 1.06±1.37 ppbv/hr in the dust-poor
air-masses. The NOP is dominated by the primary production of O3, which can be seen as a good correlation between NOP
and the NO mixing ratio in Fig. 7a. This also becomes clear in Fig. 7b, where the contribution of the different production and loss processes to the NOP is shown. The reactions of NO with HO2and CH3O2dominate the net O3 production
rate. On the other hand, the loss terms are very small. The difference between dust-loaded and dust-poor airmasses is also determined by the difference in primary ozone produc-tion through the relatively low ROxand NO mixing ratios in
the Saharan dust airmasses.
Since the ROx mixing ratio is overestimated by the
box-model during the dust event, the NOP is also calculated using the measured ROxvalues, maintaining the HO2/RO2ratio as
calculated by the boxmodel. Therefore, the modelled HO2
and CH3O2 concentrations were scaled using the calc/obs
ratio of ROx. When doing so, the mean daytime NOP
dur-ing the dust event decreased to 0.14±0.13 ppbv/hr, while the
NOP in the dust-poor airmasses remained the same.
The relatively low ROx and NO mixing ratios observed
during the major dust event cause a significant reduction in the net ozone production rate, however, the values remain positive. On average the difference in daytime mean O3
mix-ing ratio between the dust-loaded and dust-poor airmasses was 17 ppbv, while the difference in NOP was 0.73 and 0.92
ppbv/hr for the modelled and observed ROx mixing ratios,
respectively. Within 23 and 18 h of sunlight, respectively, a difference of 17 ppbvO3could be achieved, which
corre-sponds to an air mass “age” of 2 to 3 days (assuming 10 h sunshine per day), which is close to the estimated age of the dust-loaded airmasses. However, since the ozone mixing ra-tios observed in the dust-loaded airmasses are relatively low, a net ozone production of 0.14–0.33 ppbv/hr during the last
three days would mean that the O3mixing ratio in the source
region was even lower, about 25–30 ppbv. The low O3
mix-ing ratio observed in the dust-loaded airmasses would then be attributed to the transport of O3poor air from the North
African continent to the measurement site. On the other hand, the relatively high NO mixing ratios observed at the measurement site are at least partly due to transport from the local boundary layer, and probably not representative for the