HAL Id: halshs-02895359
https://halshs.archives-ouvertes.fr/halshs-02895359v2
Preprint submitted on 23 Apr 2021
HAL is a multi-disciplinary open access
archive for the deposit and dissemination of sci-entific research documents, whether they are pub-lished or not. The documents may come from teaching and research institutions in France or abroad, or from public or private research centers.
L’archive ouverte pluridisciplinaire HAL, est destinée au dépôt et à la diffusion de documents scientifiques de niveau recherche, publiés ou non, émanant des établissements d’enseignement et de recherche français ou étrangers, des laboratoires publics ou privés.
Does Holding Elections during a Covid-19 Pandemic Put
the Lives of Politicians at Risk?
Laurent Bach, Arthur Guillouzouic, Clément Malgouyres
To cite this version:
Laurent Bach, Arthur Guillouzouic, Clément Malgouyres. Does Holding Elections during a Covid-19 Pandemic Put the Lives of Politicians at Risk?. 2021. �halshs-02895359v2�
WORKING PAPER N° 2020 – 45
Does Holding Elections during a Covid-19
Pandemic Put the Lives of Politicians at Risk?
Laurent Bach
Arthur Guillouzouic
Clément Malgouyres
JEL Codes: I10, I18.
Keywords: Covid-19 pandemic; French elections; Electoral turnout; Municipal
elections; Regression discontinuity design.
Does Holding Elections during a Covid-19 Pandemic Put
the Lives of Politicians at Risk?
∗Laurent Bach Arthur Guillouzouic Cl´ement Malgouyres
February 2021
Abstract
We estimate the impact of French town hall elections held in mid-March 2020 on the mortality of 163,000 male candidates aged above 60. Their excess mortality during March and April was similar to the general population. We compare candidates in cities with two candidate lists to those in cities with only one list, as elections are more intense in contacts in the former group. We also use a regression discontinuity design and investigate mortality in 2020 depending on how candidates fared in the 2014 election. We cannot detect any causal effect of active participation in the 2020 elections on mortality.
Keywords: Covid-19 pandemic; French elections; Electoral turnout; Municipal elections;
Re-gression discontinuity design.
JEL codes: I10, I18.
∗Bach: ESSEC Business School. Guillouzouic: Paris School of Economics – Institut des politiques publiques and
Sciences Po Paris, Department of Economics. Malgouyres: Paris School of Economics and Institut des politiques publiques. The paper benefited from helpful comments from Paul Dutronc-Postel, Julien Grenet and seminar participants at the Institut des Politiques Publiques. We thank Insee and the Minist`ere de l’Int´erieur for providing the data. The authors thank the support of the EUR grant ANR-17-EURE-0001.
1
Introduction
In early 2020, the Covid-19 pandemic has forced most of the planet to stop any non-essential activity involving large groups of people until disease transmission is eventually controlled. Whether one should consider elections an essential activity in this context has become a matter of intense debates leading to dramatically different decisions across the globe. Some govern-ments have postponed elections (local elections in Austria, Italy & UK, Ohio primaries), some have switched to mail-in voting (Poland, Alaska primaries), and others have decided to hold the elections as planned with further sanitary precautions (Israel, South Korea, Wisconsin pri-maries). The empirical evidence to guide public policy is very scarce, owing to how sudden the Covid-19 outbreak has been and to the small number of elections held since it began.
This paper seeks to bridge this gap: we measure the impact of holding the first round of French town hall elections on the mortality of the individuals it exposed the most to Covid-19, i.e. politicians. These elections provide an unusual setting as they were held at the apex of the epidemic in France – on Sunday the 15th of March 2020 –, one day after the nationwide closure of non-essential retail businesses was ordered and two days before a shelter-at-home order.
Our analysis is based on individual death records from the French institute of statistics (In-see) matched with a public registry of candidates in town hall elections. The resulting dataset enables us to compare the mortality rates of male candidates in the 2014 and 2020 municipal elections relative to the general population as well as depending on the degree of participation into the 2020 election.
The correlations we can estimate between political activity and mortality using this new dataset do not necessarily reflect a causal relationship. In particular, citizens might choose to become candidates only after careful consideration of their health status and election partic-ipants may adapt their contact behavior to their current knowledge about the epidemic. To deal with these threats to identification, we implement two distinct strategies to estimate the causal effect of active participation in the election. First, in order to fill town hall seats, French voters choose between competing lists of candidates, and turnout and campaign intensity are much lower when only one candidate list is running for election. Therefore, one identifica-tion strategy is to compare the mortality rates of candidates when there are either one or two lists competing for entrance in the city council. Second, we examine whether, among the full population of male candidates in the previous election held in 2014, being either an incumbent councilor or a candidate in 2020 caused an increase in the probability of death. We implement a regression discontinuity design in the spirit ofLee(2008), since electoral success in the prior election has a large impact on active participation in the 2020 election. This strategy identifies the impact of running in the 2020 election at the individual level.
Three main sets of findings emerge from our empirical exercise. First, we compute the mortality rates in March and April 2020 among candidates in the March 15th election. This is a group of around 900,000 individuals, representing 1.8% of the adult French population. They were among the most likely to contract the disease as they actively participated in the campaign and closely monitored the voting process on election day. Many of them also belong
to demographic groups with a high risk of dying from Covid-19: 160,000 candidates were men aged between 60 and 79 years old, representing 2.6% of their category in the general population. We compare their mortality rates with overall mortality rates among individuals of same gender and same age. We find that, across March and April 2020, candidates died significantly less than members of the general population from the same age bracket. The weekly mortality rate among men aged between 60 and 79 years old from March to April was 4 for 10,000 in the general population against 1 for 10,000 among town hall candidates. This could reflect selection into candidacy based on good health. However, we do not find that this mortality “advantage” was smaller in areas where Covid-19 had the greatest incidence, i.e. the Ile-de-France and Grand-Est regions. The difference in mortality rates between the two groups was also of similar size around the onset of the epidemic and during the second wave of the Covid-19 pandemic in the fall of 2020, well after the election. This further suggests the excess mortality of candidates due to Covid-19 was in fact similar to the general population.
Second, we compare the mortality of candidates in cities where two candidate lists compete with the mortality of candidates in cities where there is only one candidate list. In the data, the number of competing candidate lists is a very strong determinant of turnout. Yet, we do not find any difference in mortality among candidates between the two types of cities, even though they otherwise do not differ much in observable characteristics. The lack of effect of electoral competition on mortality during the pandemic holds not only in the pool of candidates but also among city residents in general, which further suggests the lack of a large effect of holding the elections on epidemic diffusion.
Third, in order to go beyond estimating citywide effects of the election on mortality, we investigate the mortality patterns of the people who were candidates in the previous municipal elections, held in 2014. We find that, among them, those who decided to run again in 2020 were not more likely to die from March to April 2020. Using a regression discontinuity design, we observe that candidates in 2014 are far more likely to participate again in 2020 if their candidate list had won the election in 2014. However, we do not detect any significant effect of winning the election in 2014 on mortality in March-April 2020. This further confirms, using an entirely different identification strategy, that intense participation in the 2020 elections did not generate any specific mortality risk.
This is to our knowledge the first paper to document the mortality patterns of politicians in the middle of a Covid-19 pandemic. It is of interest in its own right as politicians are key decision-makers whose good health is of paramount value in times of crisis. By the nature of their occupation, politicians may also be more likely to contract the disease. Examples of how this has hampered policy-making abound: at certain times in the epidemic, the UK and the US governments were leaderless while the French National Assembly had to stop its pro-ceedings once an internal cluster developed.1 The main research hurdle is to obtain a large
enough sample of politicians to analyze. In this respect, our setting, which includes more than
1See “How the National Assembly became a new cluster”, LeMonde, March 21, 2020. Details on newspaper
160,000 politicians with significant exposure to mortality from Covid-19, provides a unique opportunity.
Our research also innovates by investigating the effects of elections on the diffusion of Covid-19 using individual data. Several studies have by now investigated this issue at higher levels of aggregation and for the general population. Some of this research (Zeitoun et al.,2020;
Cassan and Sangnier,2020;Cotti et al.,2020) has focused on Covid-19 outcomes measured at the level of each county and related them to turnout at the same level of aggregation, with conflicting results2. Those analyses seek to explain and predict the full development of the epidemic. This comes at the cost of making strong assumptions on the behavior of the disease and its diffusion patterns. This is why we focus instead on a narrower goal of identifying individual transmissions of the disease that were directly caused by the election.
The rest of the paper is organized as follows. Section2documents the context of the French election as well as the data we use. Section3discusses the hindrances to a causal identification and the solutions we implement. Section4provides and discusses the results of our analysis of mortality rates among candidates. Section5concludes.
2
Context and Data
2.1 Context
The 2020 town hall election. The town hall elections in France had long been planned to
be held on March 15th, 2020, with potential run-off elections to be held one week later. City governments traditionally hold substantial powers and represent most of local government employment and spending. Moreover, town halls in France are very numerous (less than 1 for every 2,000 French citizens), organized in large councils headed by a powerful mayor. As a result, town hall elections are grassroots events involving roughly 2% of the adult population as candidates and typically generate a lot of turnout: in 2014, 64% of registered voters went to the voting booth for those elections. In the days and weeks prior to election, the electoral campaigns typically involve the distribution of electoral documents on the streets, door-to-door canvassing and public meetings, even in small municipalities (Vignon,2016).
Concerns about Covid-19 ahead of the election. The development of a Covid-19 epidemic
in France, and in particular in the ˆIle-de-France and Grand Est regions (the so-called ”hotspot” areas in our analysis), became public knowledge in early March of 2020 but the reported inci-dence rates at county-level appeared to be rather low with a maximum of 841 and a median of 32 cumulative confirmed cases per one million inhabitants as of March 14th, 2020 (according to FigureB1). As a result, there were only very few calls to cancel the election up until significant lockdowns were announced by the central government in the evenings of March 12th (school closures) and March 14th (restaurant and non-essential shop closures). It might still have been
2Bertoli et al.(2020) estimate the citywide impact of electoral competition on mortality among the general
popu-lation. However, their findings were based on very inaccurate data which were eventually superseded by the data we use in this paper.
that campaign intensity decreased in the days prior to the election, when news about the pan-demic became very prevalent in the media. To explore this question, we collected regional press articles mentioning municipal election meetings on the one hand,3 and mentioning the same keywords plus a mention of either cancellation or coronavirus.4 Figure 1displays the daily count of articles entering both categories. The blue solid line shows the daily number of regional press articles mentioning public campaign meetings where voters are traditionally invited to learn about each political platform on offer and debate with candidates. This num-ber clearly increases as election day approaches, reaching a peak around a week before the election takes place, and then stops completely after the election. Similarly, the red dashed line shows the number of press articles mentioning public campaign meetings plus a term refer-ring to a cancellation or to coronavirus. It also displays a clear increasing trend in the period shortly preceding the elections, but the apex represents approximately 20% of all articles about public campaign meetings. This suggests that, while a non-negligible share of meetings were canceled due to the pandemic outbreak, most of these meetings took place nonetheless.5
Avoidance behavior on election day. The government therefore went on to organize the
first round with stricter sanitary guidelines issued to town halls organizing the election. Yet, turnout in the first round was much lower than usual, at 45%, which shows that many citizens abstained in order to avoid contracting the virus. This avoidance behavior, if particularly pro-nounced among the most vulnerable groups of citizens, might have contributed to limiting the epidemic damage from holding the election. We investigate this possibility in what follows.
Figure2documents how the age structure of the population correlated with abstention at the city level for different levels of population density. In particular, the upper panel of Figure
2 displays the coefficient of a regression of abstention on the share of the population (at the city-level) who is 60 and above. The coefficients are estimated separately for each decile of the distribution of population density, for the 2014 (red diamonds) as well as 2020 elections (blue circles). We see that for 2014 the share of older people in the local population is consistently associated with lower abstention – a well-documented pattern in empirical studies on individ-ual predictors of turnout (Buisson and Penant,2017). Moreover, we notice that this association is much stronger in denser cities. We see that this association has changed in 2020 in particu-lar among dense cities where the share of individuals aged 60 or more is associated with less negative coefficients than in 2014. Yet, the share of the population older than 60 remains neg-atively associated with abstention in all deciles of population in 2020, meaning that avoidance behavior was not strong enough to offset the greater propensity to vote of older people and thus their greater exposure to the virus on election day.
3We conducted an Europresse (https://nouveau.europresse.com) search over the “Presse g´en´eraliste
r´egionale” set of sources with keywords “´elections municipales” and “r´eunion publique”
4i.e. adding a mention of either “annulation”, “annuler”, “annul´ee” or “coronavirus”, which was the way
Covid-19 was referred to in the press at the time.
5Note that this proportion is likely an upper bound: election meeting announcements are often grouped in an
article gathering all short announcements for many municipalities in an area. Therefore, the cancellation of any event, even unrelated to municipal elections, is enough to count it as part of the category represented in the red dashed line.
Figure 1: Number of regional press articles mentionning campaign meetings and their cancellation Election day 0 50 100 150 200 Number of articles
05feb2020 12feb2020 19feb2020 26feb2020 04mar2020 11mar2020 18mar2020
Day
Articles about municipal election meetings ... mentionning cancellation or coronavirus
NOTES: This figure presents the number of articles in the regional press mentioning local electoral meetings (blue line) and local electoral meetings plus a term referring to cancellation or coron-avirus. Searches are conducting using Europresse (https://nouveau.europresse.comover the “Presse g´en´eraliste r´egionale” set of sources. The blue line is constructed with searches of articles mentioning both “´elections municipales” and “r´eunion publique” (which is the generic French term for local campaign meetings). The red line is constructed with searches of articles men-tioning both “´elections municipales” and “r´eunion publique”, and either “annuler”, “annul´ee”, “annulation”, or “coronavirus” (the term covid was hardly used at the time).
Some voters might have been able to vote without showing up in person on election day. In principle, voting in the French municipal elections occurs in-person only. However, in precise circumstances, it is possible to delegate one’s vote to a relative who will go to the voting booth on one’s behalf, with a maximum of one delegation per in-person voter. The procedure costs time and energy as one must go in person to the police station days ahead of the election in order to register the delegation mandate. The number of delegations is not reported nation-wide but it is available for a few cities. In Paris, which was greatly affected by the first wave of Covid-19, only 3.6% of those who voted on March 15th, 2020 did so by delegation, against 3% for the previous town hall elections.6 These numbers show that citizens did not significantly use delegated voting to avoid being exposed to the virus.
Another type of avoidance behavior might have consisted in wearing masks while going to the voting booth. There is anecdotal evidence that some voters and some ballot organizers wore masks on election day7. However, the electoral law requires in France that voters can be identified by their face. As a result, citizens had to remove their mask upon voting8. More importantly, until the end of March 2020, the public guidance towards the wearing of masks was very dismissive of its utility9 except for medical professions and, starting on March 4th, the commercial distribution of masks was forbidden by the government so as to make sure medical professions would not be short of masks in the critical period of the epidemic. As a result, it is unlikely that mask wearing was sufficiently widespread to prevent the diffusion of the epidemic during the first wave.
The post-election fallout. Once abstention numbers were known, criticisms over the
deci-sion to keep the election built up so much that the government decided on the day after the first round to postpone the second round of the election until further notice. It is now widely con-sidered in French public opinion that holding the first round was one of the big mistakes made by the central government in managing the sanitary crisis.10 The French media have collected
ample anecdotal evidence of individuals being contaminated by Covid-19 because of this elec-tion.11 Most of the gathered evidence is on cases of candidates, city councilors and mayors, since they were deeply involved in the campaign, they monitored the voting process on elec-tion day and they celebrated the results on the evening of the elecelec-tion. Furthermore, many of them belong to high-risk categories. Incidentally, the first reported fatality from Covid-19 contracted on French soil was on February 26th, one day before the call for candidates closed, and it was a city councilor aged 61. However, it remains unknown to this day whether this pile
6Those figures are drawn from the Paris Town Hall:link 7link
8link
9 For instance, on March 21st, the general director of health stressed that masks are “useless for the healthy”
(link).
10According to a poll by YouGov on the 17th and 18th of March, 2020 for the Huffington Post, 81% of respondents
thought the first round of the elections should have been cancelled, and 74% believed the results to be biased by the Covid-19 pandemic. Source:link.
11 Stories have been featured in several national or regional newspapers, online media or on the website of
Figure 2: Effect of the share of people older than 60 y.o. on abstention relative to population density −.6 −.4 −.2 0
Impact of share of 60+ y.o. on abstention
6 7 8 9 10
(log) Population density
Impact of age in 2014 Impact of age in 2020
NOTES: This graph presents coefficients of linear regressions of abstention on the share of people older than 60, by decile of population-weighted density, for the 2014 election (blue dots) and the 2020 election (red diamonds).
of anecdotal evidence represents a significant shock to the mortality rate of this category of the French population. The aim of this paper is precisely to shed statistical light on this issue.
Electoral rules in French town hall elections. In order to make sense of how politicians are
involved in town hall elections in France, a brief description of the electoral system is in order. Those elections are held every six years and follow a two-round list system with proportional representation together with a seat premium for the list gathering the most votes. Candidates to the municipal council gather in lists containing as many names as there are positions to be taken (plus two optionally), and respecting strict gender parity. The number of available posi-tions as municipal councillors depends on population size, and ranges from 7 for municipali-ties with less than 100 inhabitants to 69 for municipalimunicipali-ties above 300,000 inhabitants. Because the number of candidates in each list is unusually high, list members personally contribute a lot to the campaigning effort (Vignon,2016).
Voters then vote for one of the available lists.12 In the first round, if a list obtains the absolute majority, it obtains half of the seats on the city council. The other half is allocated to all lists that received more than 5% of the votes in proportion to their share of the recorded votes. A second round is organized whenever no list obtains an absolute majority during the first round. Only the lists with voting shares 10% and higher can participate in the second
12The system is a bit more flexible in municipalities with less than 1000 inhabitants, where councillor selection
follows a multi-member ballot rule (scrutin plurinominal in French), meaning that voters can freely pick candidates from different lists, and where votes are counted individually rather than per list.
round. The list receiving the most votes is allocated half of the seats. The other half of the seats is shared between all lists in proportion to their share of the recorded votes during the second round.
Due to the seat premium, the destiny of individual candidates heavily relies on whether the vote share reached by their list surpasses, even marginally, the others. Candidates in losing lists may be elected in the city council if they are high enough in their predetermined ranking in the list but, in this case, they will belong to the opposition and will not participate in the daily business of the town hall until the next election held six years later.
The allocation of seats to the lists of candidates gives rise to a cut-off rank in each list. Can-didates whose rank on the list is below this cut-off will be allocated a seat while those above it will not. This specific feature will be useful when examining the 2020 mortality patterns among individuals who were candidates during the 2014 elections.
2.2 Data
Data on the deceased. We obtain information on the identity of all the deceased in France
from the Fichier Nominatif des D´ec`es (henceforth, FND) held by the National Institute of Statistics (Insee). The dataset includes the names, surnames of birth, date and location of birth, date and location of death of all deceased French residents. Crucially, the dataset is updated monthly by Insee, which centralizes death certificates from all around the country. It usually takes less than a month for deaths to be reported in the dataset, so that the last batch of the data published on January 12th 2021 has close to full coverage of all deaths taking place until mid-December 2020, well after the peak of mortality linked with the first wave of Covid-19 in France. Another useful feature of the dataset is that it is available on the French govern-ment open data website, the reason being that information on the deceased is not deemed to be personal data under French laws.13
Data on candidates. Based on name and birth information, we match the FND dataset with
the registry of candidates in town hall elections held by the Minist`ere de l’Int´erieur. The reg-istry includes current name and surnames, date and location of birth of all candidates in the 2014 and 2020 town hall elections, on top of the number of votes obtained by each candidate. The call for candidates closed on February 27th, and the list of candidates cannot be updated after this date, even when one of its members dies prior to the election14. We match the
candi-date registry with the FND dataset on name, surname, candi-date and location of birth. Since women often change surnames over their lifetime, we restrict our analysis to male candidates. More details on the matching procedure are provided in the AppendixC.1.
13Under GDPR regulations, information on the deceased is not considered as personal data, which is why the
FND data is publicly available with full identities disclosed. Because we also use some demographic information on living candidates, we have registered our treatment of personal data for this paper and we provide information on personal data access and correction rights in the Appendix (see SectionC.2).
Additional data. We gather data on the number of confirmed cases in each county as of March 14th from the website https://github.com/opencovid19-fr/data (for which the primary
sources are the regional health agencies). Demographic data (including population density, age structure, class structure and mortality rates) for each county and city are derived from Census data available on the Insee website.
2.3 Descriptive statistics on nationwide excess mortality
Using the assembled data, we now provide a description of the excess mortality observed at the national level for male candidates in the municipal elections. The comparison of the excess mortality of candidates in the municipal elections with the excess mortality in the overall pop-ulation already gives indications on the impact of participation in the municipal elections one might expect to find.
Figure3 shows mortality over time from the very end of February 2020 (week 9) to mid-December 2020 (week 50) for the whole population of men aged between 60 and 79 (in blue) and for male candidates in the same age category (in red), depending on whether they were in first-wave hotspots (ˆIle de France and Grand Est regions), represented with solid lines and circles, or in the rest of France, displayed with dotted lines and diamonds. The figure shows that there was indeed an excess mortality of election candidates concentrated in the hotspots during the peak of the first wave of the Covid-19 epidemic. However, this excess mortality does not appear to be starkly higher than the one observed for the whole population. The second wave of Covid-19 related deaths started in mid-October 2020 (week 42) and it was much more geographically widespread than the first one. Because the electoral campaign had by then ended a long time ago, the comparison of mortality rates between candidates and the general population provides us with a very useful counterfactual. The data we present show that the increase in mortality rates in the second wave was of similar magnitude (in percentage points of mortality rates) in the population of candidates and in the general population, which suggests that we should not have expected the first wave of the epidemic to have been less deadly (in percentage points of mortality rates) for candidates if no election had been held.
Figure 3: Aggregate mortality rates for candidates and overall population 0 .2 .4 .6 .8 1 1.2 1.4 1.6
Mortality rate (per thousand)
9 13 17 21 25 29 33 37 41 45 49
Biweek
Whole pop. Gd. Est & IdF Candidates Gd. Est & IdF Whole pop. rest of France Candidates rest of France
NOTES: This graph presents mortality rates at a biweekly frequency for men aged between 60 and 79 for the whole French population and for the pool of candidates in this demographic category, in Grand Est and ˆIle-de-France (where most Covid-19 cases have been located during the first wave of the epidemic) and the rest of France. Mortality rates are expressed per thousand inhabitants. Results for candidates are weighted by the population in the area.
While suggestive, this absence of correlation between candidacy in 2020 and excess mor-tality does not rule out a causal link. This is why we implement a more structured empirical design in the rest of the paper.
3
Empirical Design
In this section, we present the challenges associated with measuring the impact of active par-ticipation in the election on excess mortality, and then detail the solutions we implement in order to address them.
3.1 Empirical challenges
Challenges in disentangling different effects caused by the elections. First of all, the elec-tion may affect the diffusion of the disease through at least three different channels: the cam-paign in the weeks prior to election, the meetings between voters and organizers at the vot-ing location, and the celebrations between campaign members on the evenvot-ing of the election. There is unfortunately no direct measure of how intense each of those mechanisms were in each locality. This makes it in particular very difficult to use the timing of confirmed cases, hospitalizations and deaths in order to identify the impact of the election as opposed to the
effects of other important shocks such as lockdowns. Our approach will not make any specific assumption on the timing of fatalities caused by the election.
Challenges in the measurement of epidemic diffusion. The measures researchers can access
are usually aggregated at the level of a d´epartement (the denomination for counties in French) or a city, while the underlying behavior is individual. This leads to a statistical issue known as the ecological inference problem15: the estimates of the impact of election intensity on the diffusion of Covid-19 may vary widely and even change sign depending on the level of aggregation at which campaign intensity is measured. This motivates our focus on individual measures of both participation in the election and transmission of the disease.
On top of this aggregation problem, the measure of the diffusion of Covid-19 into the ter-ritory is itself problematic. There is to this day no systematic and randomized testing of the French population at a disaggregated geographic level, which would be ideal for our pur-poses. Instead, we have on one hand incidence measures and on the other hand measures of tail events such as deaths: the former are naturally higher where testing is more frequent, while the latter are less likely biased but also, thankfully, much less frequent outcomes. In this paper, we use mortality as an outcome but we are aware that this is at the expense of statistical power. We therefore pay careful attention to maximizing the number of observations we have at our disposal.
Reverse causality: evidence of avoidance behavior at city-level. People have been
increas-ingly aware of the diffusion of the virus in the days and weeks prior to the election and might have adjusted their behavior accordingly, through lower participation in the campaign and lower turnout. Crucially, as shown infra in the case of dense cities with large old-age popu-lations, this type of behavioral adjustment seems to have been more common in areas where the epidemic was more damaging. As a result, places where observed campaign intensity and turnout have been low could display high mortality with the causality running from the latter to the former.16
To avoid such strategic avoidance biasing our results, we use proxies for election inten-sity that were largely predetermined at the time Covid-19 started its diffusion on the French territory. At the city-level, we use various measures of electoral competition, which were ef-fectively fixed on February 27th just before the development of the epidemic in France became public knowledge, while at the individual level we examine the decision to be a candidate in the election.
Omitted variable bias Lastly, the epidemic is likely to spread faster in areas with specific
characteristics. For instance,Gascard et al.(2020) show that excess mortality rates are higher
15SeeKing(1997) for an overview of the issue.
16Zeitoun et al.(2020) andCassan and Sangnier(2020) look for such strategic avoidance behavior using
county-level data and do not find evidence for it. However, at this county-level of aggregation, the analysis may lack statistical power, which is why we prefer to analyze turnout at the level of each city.
in denser areas across the French territory. As knowledge on Covid-19 progresses, the scien-tific literature is likely to identify other characteristics of territories that enhance its diffusion. The issue for our purpose is that some of those characteristics are likely to be correlated with turnout and campaign intensity, so any attempt to derive causation from observed correlations between turnout and epidemic outcomes will likely be affected by omitted variable biases. In order to tease out causation, we rely on the existence of discontinuities in drivers of campaign intensity and of participation to the election as a candidate.
3.2 Identification strategies
Variation in the number of lists in the election Our first strategy aims at estimating the
effect of electoral competition intensity on the citywide mortality rate among candidates. In order to circumvent the issues exposed above, we use the stark discontinuity of electoral com-petition between one and two candidate lists as an exogenous source of variation in exposure to the disease for candidates running in the municipal election. The identifying assumption underlying this strategy is that the number of lists in the municipal election in 2020 can only affect mortality through its influence on the intensity of electoral competition.
Out of 9836 municipalities with candidate lists,173812 had only one list in the first round of the 2020 election while 3852 had two lists. As Figure4ashows, there is a sharp drop in the av-erage abstention rate between municipalities with candidates in the municipal elections from only one list, who will therefore be elected no matter how high the electoral participation, and the ones with two lists, where the stakes of the election are much higher. There is also empirical evidence from surveys based on the 2014 election that the intensity of the electoral campaign is usually far lower when only one list is competing (Vignon,2016). In contrast, as Figures4and
B2show, the differences in relevant characteristics between municipalities having one versus two lists are very small and/or follow a continuous linear trend. In particular, the number of confirmed cases per 1 million inhabitants (at county-level) is very similar, and so is the share of dense municipalities. Interestingly, the abstention rates in the previous municipal election are nearly identical in the two groups, indicating that there is low persistence in the fact of having only one competing list across municipal elections.
A drawback of this strategy is that municipalities with either 1 or 2 lists tend to be located in low density areas: as Figure4dshows, only around 10% of these municipalities are denser than 2000 inhabitants per square kilometer. This limits the external validity of our approach since the Covid-19 epidemic developed less strongly in low density areas. Therefore, obtain-ing null or weak results of the electoral participation on covid-related mortality could reflect heterogeneity in the effects of elections according to population density. We could in princi-ple extend the comparison to cities with more than 2 lists. Panels b to e in Figure4however illustrate why the full support of the number of lists cannot be used to obtain causal esti-mates of elections on mortality: higher competition is associated with systematic differences in characteristics relevant to both virus diffusion / lethality and electoral participation, such as
17Municipalities with less than 1,000 inhabitants hold the election with the scrutin plurinominal rule, where people
confirmed cases at the time of the election, population density, and the average age of candi-dates 60 or more. To circumvent this issue, we implement an alternative strategy which allows inference along the whole population density support.
Figure 4: Number of candidate lists in the first round of the election and observ-able municipal characteristics.
(a) Abstention rate in 2020
0.620 (0.005) 0.455 (0.005) .45 .5 .55 .6 .65
Abstention rate in 2020 (bin averages)
1 2 3 4+
Nb. of lists in first round 2020
(b) Abstention rate in 2014 0.327 (0.005) 0.318 (0.005) .3 .35 .4 .45
Abstention rate in 2014 (bin averages)
1 2 3 4+
Nb. of lists in first round 2020 (c) Confirmed cases per 1m inhab.
72.85 (15.75) 70.32 (13.36) 40 60 80 100
# cases/1m inhab. on March 14 (bin averages)
1 2 3 4+
Nb. of lists in first round 2020
(d) Share of dense municipalities
0.191 (0.021) 0.326 (0.029) .2 .4 .6 .8 1
Share of dense municipalities (bin averages)
1 2 3 4+
Nb. of lists in first round 2020 (e) Age 66.08 (0.10) 66.56 (0.07) 65.8 66 66.2 66.4 66.6 66.8 67 67.2 67.4 67.6 67.8
Age (bin averages)
1 2 3 4+
Nb. of lists in first round 2020
NOTES: This figure presents the number of candidate lists in the first round of the 2020 French municipal election confronted to (a) the absention rate in 2020, (b) the abstention rate in 2014, (c) the number of confirmed cases on March 14, 2020 per million of inhabitants, (d) the share of municipalities with population density higher than 2000 inhabitants per square kilometer (e) age of candidates. Dots represent averages, brackets 95% CI using standard errors clustered at the d´epartment-level. Cities with 4 or more lists are binned together (the full distribution of the number of lists is presented in TableA1)
Discontinuity in the win margin in the 2014 municipal elections In an alternative strategy, we exploit the fact that candidates in the 2014 winning list are disproportionately more likely to be candidates again in 2020 than candidates in 2014 losing lists (as inLee,2008, for the U.S.). The winners of 2014 are also much more likely to be incumbent city councilors by late 2019 and to participate in the organization and monitoring of the 2020 elections. The sample comprises all first-past-the-post municipal elections held in 2014: this includes all run-off elections, and elections in which only two lists faced each other in the first round in a city with more than 1,000 inhabitants. We adaptLee(2008) to a setting with more than two competing lists, as in
Eggers and Spirling(2017). Doing so requires defining a win margin for each candidate, which is the vote share margin between the candidate’s list and its best competitor in 2014.18
As Figure5shows, there is a very clear discontinuity in the relationship between the prob-ability to be a candidate again in 2020 and the victory margin in 2014 just around the winning threshold, both for the entire country (Figure 5a) and for places most strongly affected by Covid-19 (Figure5b).
18Thus, when the candidate wins in 2014, the running variable is the difference in vote share between his/her
Figure 5: First stage – Probability of being a candidate in 2020 / elected official in 2019 according to the win margin in 2014
(a) Candidacy in 2020 (whole country)
.1 .2 .3 .4 .5 Probability to be candidate in 2020 -.5 0 .5 Win margin in 2014
(b) Elected position at the end of 2019 (whole country)
0 .2 .4 .6 .8 Probability to be in position in 2019 -.5 0 .5 Win margin in 2014
NOTES: This figure presents averages and confidence intervals of the probability of being (a) a candidate in the 2020 election or (b) an incumbent city councilor in late 2019 for males older than 60 y.o., depending on the win (or loss) margin of the list the candidate belonged to in 2014.
4
Results
4.1 Electoral competition
Here, we compare cities which had only one candidate list in the first round of the 2020 elec-tion, implying low competition and low turnout, to the ones which had two lists and thus exhibited much higher political participation – as explained in section3.
FigureB7shows differences in mortality during the peak of the epidemic, between Feb. 26 and April 28, 2020, depending on the number of lists present in the first round of the election, for the whole country (panel a) and focusing on hotspots (panel b). This figure shows no excess mortality on average in cities with two lists relative to the ones with one list only: if anything, mortality is even slightly higher in cities with one list in hotspot areas.
Figure 6: Mortality during the Covid-19 pandemic by number of lists in the first round of the 2020 municipal election.
(a) Whole country
0.001 (0.000) 0.001 (0.000) .0006 .0008 .001 .0012 .0014 .0016 .0018 .002 .0022
Mar-Apr. 2020 mortality (bin averages)
1 2 3 4+
Nb. of lists in first round 2020 (b) Hotspots 0.002 (0.001) 0.002 (0.001) 0 .0005 .001 .0015 .002 .0025 .003 .0035 .004 .0045
Mar-Apr. 2020 mortality (bin averages)
1 2 3 4+
Nb. of lists in first round 2020
NOTES: These graphs present the probability of death of candidates between February 26, 2020 and April 28th, 2020 in the election by number of lists in the first round of the 2020 municipal election, (a) for the whole country, and (b) in ˆIle de France and Grand-Est. the sample includes all male candidates aged 60 and above. Cities with 4 or more lists are binned together (the full distribution of the number of lists is presented in TableA1).
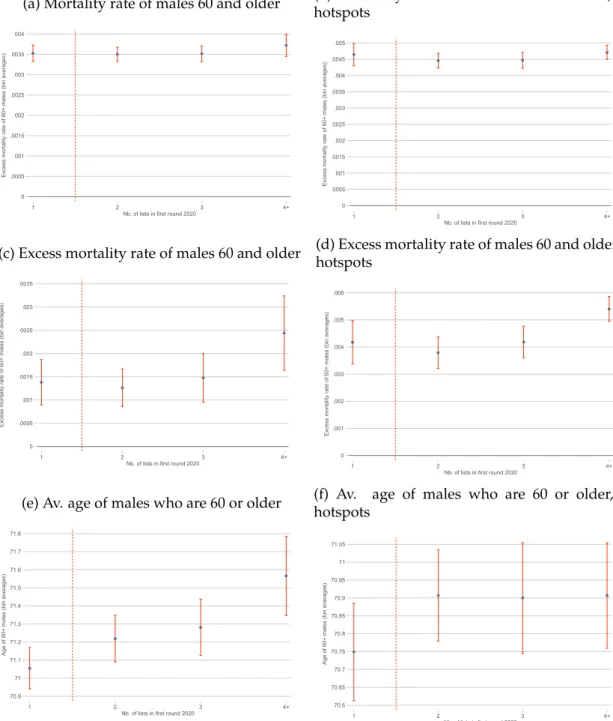
We find a broadly similar pattern among the general population of males 60 and older. The results are presented in Figure7below. Computing mortality rates and excess mortality rates with respect to 2018 and 2019, we find no differences for the whole country (panels7aand7d) or focusing on the most affected counties (panels7aand7d). This result is very important as it shows that holding the election is unlikely to have had a significant mortality effect in the general population. Since there is every reason to think that candidates were more exposed to the virus than the general population, this last result is also reassuring for our conclusion that the Covid-19-related mortality of candidates was unaffected by the election. Supporting the notion that the structure of the population is comparable between these cities with one and
two candidate lists, we find only very limited differences in the average of age of the relevant population (male age 60 or older) between the two categories of cities (panels7eand7f).
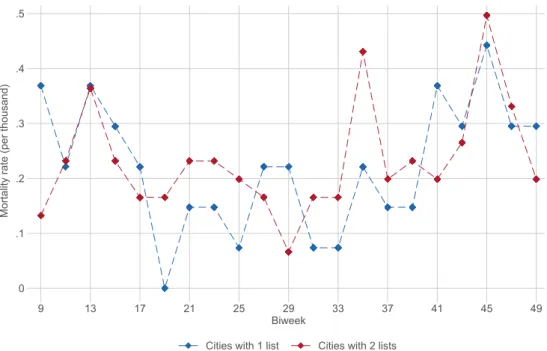
Finally, one must check that the effect of electoral competition we estimate is not washed out by other sources of mortality. To this effect, Figure8shows mortality over time from the very end of February 2020 (week 9) to mid-December (week 50) for male candidates in cities with only one competing list (in blue) and for male candidates in cities with two competing lists (in red). We also show in FigureB3the mortality rates of candidates at the peak of the epidemic (weeks 13 and 14) depending on the number of competing lists in the 2020 elections. There is no evidence that the mortality rates significantly differed according to the number of competing lists at any point in time, and especially not at the peak of the first wave.
Figure 7: Mortality outcome and age in the general population among 60+ males, depending on number of lists in the first round of the election.
(a) Mortality rate of males 60 and older
0 .0005 .001 .0015 .002 .0025 .003 .0035 .004
Excess mortality rate of 60+ males (bin averages)
1 2 3 4+
Nb. of lists in first round 2020
(b) Mortality rate of males 60 and older, in hotspots 0 .0005 .001 .0015 .002 .0025 .003 .0035 .004 .0045 .005
Excess mortality rate of 60+ males (bin averages)
1 2 3 4+
Nb. of lists in first round 2020
(c) Excess mortality rate of males 60 and older
0 .0005 .001 .0015 .002 .0025 .003 .0035
Excess mortality rate of 60+ males (bin averages)
1 2 3 4+
Nb. of lists in first round 2020
(d) Excess mortality rate of males 60 and older, in hotspots 0 .001 .002 .003 .004 .005 .006
Excess mortality rate of 60+ males (bin averages)
1 2 3 4+
Nb. of lists in first round 2020
(e) Av. age of males who are 60 or older
70.9 71 71.1 71.2 71.3 71.4 71.5 71.6 71.7 71.8
Age of 60+ males (bin averages)
1 2 3 4+
Nb. of lists in first round 2020
(f) Av. age of males who are 60 or older, in
hotspots 70.6 70.65 70.7 70.75 70.8 70.85 70.9 70.95 71 71.05
Age of 60+ males (bin averages)
1 2 3 4+
Nb. of lists in first round 2020
NOTES: This figure presents the number of lists in the first round of the 2020 French municipal election confronted to (a), (b) the mortality rate in 2020 between February 26 and April 28, (c), (d) the mortality rate over the same period in excess of the average of 2019 and 2018, (e), (f) aver-age aver-age of males who are 60 or older as of 2016. Dots represent averaver-ages, brackets 95% CI using standard errors clustered at the d´epartment-level when considering the entire country and at the city-level when considering hotspots only. Cities with 4 or more lists are binned together (the full distribution of the number of lists is presented in TableA1). The data used to compute mortal-ity rate based on place of residence can be found at:https://www.insee.fr/fr/statistiques/
4487988?sommaire=4487854(data published on 01/12/2021). Average mortality and excess
mor-tality rates are weighted by the relevant denominator (here, the number of male residents aged 60 and above).
Figure 8: Mortality rates for candidates according to the intensity of electoral competition 0 .1 .2 .3 .4 .5
Mortality rate (per thousand)
9 13 17 21 25 29 33 37 41 45 49
Biweek
Cities with 1 list Cities with 2 lists
NOTES: This graph presents mortality rates at a biweekly frequency for men aged between 60 and 79 for candidates in cities with one competing list in 2020 and for candidates in cities with two competing lists in 2020, for the entire country. Mortality rates are expressed per thousand candidates.
As noted in section3, this strategy mechanically focuses on low density and therefore low Covid-prevalence places, and thus carries the risk of ignoring the areas where excess mortality due to Covid-19 was effectively high. We address this problem by studying the mortality of all candidates in 2014 to gain as much statistical power as we can, and then by exploiting a discontinuity in the win margin in 2014 to eliminate potential biases in this approach.
4.2 The causal effect of candidacy on death: RDD results
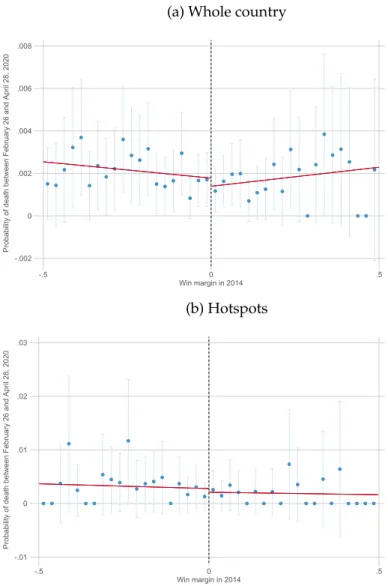
In this section, we present the RDD results regarding the causal effect of being on a winning list in 2014 on the probability of dying between February 26 and April 28, 2020. This specification is a reduced form and we consider that any causal effect of being on a winning list in 2014 on 2020 mortality will run through the probability of either running as candidate or being an incumbent councilor in 2020 – which as we saw in Figure 5reacts strongly to being on a winning list in 2014. Figure9presents the results. Whether for the whole country (subfigure
9a) or just when focusing on hotspots (subfigure9b), we find no evidence of an effect of being on a 2014 winning list on mortality in early 2020.
These graphical results are confirmed by a formal RDD estimation of the ITT effect. The results of the main specification are presented in Table1in the Internet Appendix. The RDD estimator suggests that, in response to being part of a winning list in 2014, there is a large
in-Figure 9: Intention-to-treat – Probability of death of males older than 60 y.o. between February 26 and April 28, 2020 according to the win margin in 2014
(a) Whole country
-.002 0 .002 .004 .006 .008
Probability of death between February 26 and April 28, 2020
-.5 0 .5 Win margin in 2014 (b) Hotspots -.01 0 .01 .02 .03
Probability of death between February 26 and April 28, 2020
-.5 0 .5
Win margin in 2014
NOTES: This figure presents averages and confidence intervals of the probability of being a can-didate in the first round of the 2020 municipal election using the win (or loss) margin of the list to which the candidate belonged in 2014 as the running variable, (a) for the whole country, and (b) in ˆIle de France and Grand-Est. The sample is composed of all male candidates in the 2014 municipal election born before 1960.
crease in the probability of being a candidate in 2020 (+15.7 pp) or of being an elected councilor in 2019 (+53.1 pp) but there is no significant effect on mortality in 2020.
In the Internet Appendix, we run various robustness checks, including falsification tests using candidates’ personal characteristics that were predetermined prior to the 2014 election (age) and prior to the 2020 pandemic (probability of dying prior to 2020 and number of com-peting lists in 2014) – see Table1and FigureB5. We also implement the density test suggested byCattaneo et al.(2018) – see FigureB4. We also assess the sensitivity of our results to the spec-ification of the local polynomial used in the estimation (TableA4andA5) and to the method used for selecting the estimation bandwidth (TableA6andA7). Finally, we also check in Ta-bleA3and FigureB6that the excess mortality estimates do not significantly differ at the very
peak of the epidemic. These tests all support the validity of our identification strategy and the robustness of our results.19
Table 1: Main RDD specification: full sample
Outcomes Falsification
(1) (2) (3) (4) (5) (6)
Candidate in ’20 Councilor in ’19 Death Mar.-Apr. ’20 Age Death bef. Feb. ’20 # lists
RD Estimate 0.156*** 0.528*** -0.000547 0.0490 0.00376 0.440
(0.0127) (0.0108) (0.000750) (0.158) (0.00440) (0.530)
Sample size 106767 106767 106767 106767 106767 106767
Effective samp. size 43400 43130 45358 43157 39812 56758
Bandwidth 0.169 0.167 0.179 0.167 0.149 0.251
NOTES: This table presents RDD estimates using the win (or loss) margin of the list to which the candidate belonged in 2014 as the running vari-able. The sample is composed of all male candidates in the 2014 municipal election born before 1960. Bias-corrected confidence intervals are constructed following the method proposed byCalonico et al.(2014b) as implemented inCalonico et al.(2014a). The local polynomial used to construct the point estimate is of order 1 and is fitted weighing observations with a triangular kernel. The local polynomial used to construct the bias correction is of order 2. The bandwidth selection is chosen based on a MSE-minimizing criterion. Robust standard errors clustered at the county (d´epartement) level are reported in parentheses. *p < 0.1, ** p < 0.05, *** p < 0.01.
To obtain more precise estimates, we fit a simple OLS regression of mortality on the deci-sion to be a candidate in 2020 using the entire sample of 2014 candidates who were alive as of February 26th. We control for age and the rank of entrance into the city council in 2014. Re-sults are presented in Table2. Once rank is controlled for (Column 3 of Table2), this delivers a negligible estimate of the effect of being a candidate in 2020 on mortality that is strikingly similar to our RDD estimate: -0.0402% for OLS and -0.0410% for the RDD (Column 3 of Table
A4).
Table 2: Coefficients of OLS regressions of Covid-related mortality on being a candidate in 2020 in the whole sample of candidates in 2014.
Whole country Hotspots
(1) (2) (3) (4) (5) (6)
Dep. Var.:Probability of death between Feb. 26 and Apr. 28, 2020 Candidate in 2020 -0.00109*** -0.000790*** -0.000521** -0.00108** -0.000573 -0.0000694
(0.000202) (0.000201) (0.000217) (0.000522) (0.000519) (0.000594)
Age 0.000181*** 0.000178*** 0.000319*** 0.000312***
(0.0000219) (0.0000217) (0.0000637) (0.0000630)
Rank w.r.t. last elected -0.000942*** -0.00164**
(0.000248) (0.000646)
Constant 0.00248*** -0.0101*** -0.00988*** 0.00344*** -0.0186*** -0.0182*** (0.000157) (0.00144) (0.00143) (0.000358) (0.00425) (0.00421)
Observations 227369 227369 227369 41742 41742 41742
NOTES: This table presents OLS coefficients of regressions of the probability of dying between Feb. 26, 2020 and Apr. 28, 2020
on the fact of being a candidate in the 2020 municipal election, the age of the candidate, and its rank in the list relative to the last candidate elected. The sample is composed of all male candidates in the 2014 municipal election born before 1960 and alive on February 25, 2020. Robust standard errors clustered at either the county (d´epartement) level or the city level (in the hotspot-only samples) are reported in parentheses. * p < 0.1, ** p < 0.05, *** p < 0.01.
19In particular, we do not find that being among the winners of an election reduces mortality in the following
six years. This goes againstBorgschulte and Vogler(2019), who identify a mortality benefit of winning elections, but our focus (short-term mortality vs. longevity) and context (municipal vs. gubernatorial elections) are very different.
4.3 The causal effect of candidacy on death: Power analysis
One limitation of our approach is that it may lack statistical power to detect substantial effects of participation in the election on mortality. However, while mortality rates are low, our esti-mation samples of candidates in the 2014 election are large enough that the absolute number of candidates who die between February 26, 2020 and April 28, 2020 is very substantial, with 480 candidate deaths in our OLS sample and 217 in our RDD sample. We provide in what follows a thorough power analysis to follow up on this insight and make sure our sample size is large enough to detect substantial effects of the election on mortality.
In Figure 10, we plot the statistical power for both our OLS and RDD baseline estimates (with a risk of type I error set to α = 0.10) as a function of the true size of the effect. The RDD analysis allows us to detect an increase in mortality rates greater than 0.15 percentage points with a power of 80%. Given a fatality rate (i.e. mortality conditional on contracting the disease) of 2%, this allows us to detect a positive effect greater than 7.5 percentage points on the attack rate (probability of contracting the disease) with a power of 80%. We obtain significantly lower minimum detectable effects based on our OLS estimates. Again, given a fatality rate of 2%, the OLS analysis allows us to detect a positive effect of running for office on the attack rate greater than 3 percentage points with a power of 80%.
It is useful to compare those marginal impacts on the cumulative attack rate with the av-erage cumulative attack rate measured by the French institute of statistics using randomized antigenic testing at the end of the first wave (Warszawski et al.,2020). They find an average attack rate equal to 4.5% in the entire country. With 80% power, our RD design therefore can help us detect a multiplication of the attack rate due to being a candidate by a factor of at least 2.67, while our OLS design can detect a multiplication by a factor of at least 1.67.
Another way of gauging the size of the effect we can detect with some degree of confidence is to express the estimated coefficient in percent of the baseline mortality rate (in our RDD control group) which is equal to 0.22% over the period. The OLS estimation allows use to detect a relative increase in mortality of at least 23% with power of 80% while the RDD allows us to detect a positive relative impact greater than 68%.
Given this power analysis and the widespread priors that the election had a very big impact in both the spread of the disease and the rise in mortality, we view our OLS and RDD empirical designs as very informative.
Figure 10: Power function for OLS and RDD 0 .2 .4 .6 .8 1 power=P(H 0 rejected|H 0 false, α =0.10) 0 .001 .002 .003 .004
size of the effect
ols rdd
NOTES: Power computations are based on the estimates and standard errors from Table1for the OLS (column 3) and Table2for the RDD (column 3). The power function of the OLS estimator is based on the standard asymptotic formula. For the RDD estimator, the power function is directly computed using the Stata package rdpow (Cattaneo et al.,2019).
5
Conclusion
In times of social distancing and bans of non-essential activities, it is crucial to know more about the risks implied by elections. The French context allows an in-depth analysis of this question: in March 2020, after heated debates, the French government decided to maintain the municipal elections on March 15th, two days before the countrywide lockdown.
The key contribution of this paper is to evaluate the effect of running for local office during a pandemic. We fail to detect any positive effect of active participation in the 2020 elections on mortality among politicians aged 60 and above.
Our results do not, of course, fully exhaust the debate on whether elections should be held in those times and in which format. The elections we have analyzed may have spared the can-didates in part because voters strategically did not turn out. This lack of voter participation is concerning as it reduces the legitimacy of voting results. For this reason, a better understand-ing of turnout decisions in pandemic times and their long-term consequences should be on the research agenda for the years to come.
References
BERTOLI, S., GUICHARD, L. and MARCHETTA, F. (2020). Turnout in the Municipal Elections of March 2020 and Excess Mortality during the COVID-19 Epidemic in France. Discussion-Paper 13335, IZA.
BORGSCHULTE, M. and VOGLER, J. (2019). Run for your life? the effect of close elections on the life expectancy of politicians. Journal of Economic Behavior & Organization, 167, 18–32. BUISSON, G. and PENANT, S. (2017). ´Elections pr´esidentielle et l´egislatives de 2017 : neuf inscrits
sur dix ont vot´e `a au moins un tour de scrutin. Insee-premi`ere.
CALONICO, S., CATTANEO, M. D. and TITIUNIK, R. (2014a). Robust data-driven inference in the regression-discontinuity design. The Stata Journal, 14 (4), 909–946.
—, — and — (2014b). Robust nonparametric confidence intervals for regression-discontinuity designs. Econometrica, 82 (6), 2295–2326.
CASSAN, G. and SANGNIER, M. (2020). Libert´e, egalit´e, fraternit´e... contamin´e? estimating the impact of french municipal elections on covid-19 spread in france.
CATTANEO, M. D., JANSSON, M. and MA, X. (2018). Manipulation testing based on density discontinuity. The Stata Journal, 18 (1), 234–261.
—, TITIUNIK, R. and VAZQUEZ-BARE, G. (2019). Power calculations for regression-discontinuity designs. The Stata Journal, 19 (1), 210–245.
COTTI, C. D., ENGELHARDT, B., FOSTER, J., NESSON, E. T. and NIEKAMP, P. S. (2020). The relationship between in-person voting, consolidated polling locations, and absentee voting on covid-19: evidence from the wisconsin primary. Working-paper, NBER.
EGGERS, A. and SPIRLING, A. (2017). Incumbency effects and the strength of party preferences: Evidence from multiparty elections in the united kingdom. Journal of Politics, 79 (3), 903–920. GASCARD, N., KAUFFMANN, B. and LABOSSE, A. (2020). 26% de d´ec`es suppl´ementaires entre
d´ebut mars et mi-avril 2020: les communes denses sont les plus touch´ees. Insee-focus.
KING, G. (1997). A solution to the ecological inference problem: Reconstructing individual behavior from aggregate data. Princeton University Press.
LEE, D. S. (2008). Randomized experiments from non-random selection in us house elections. Journal of Econometrics, 142 (2), 675–697.
VIGNON, S. (2016). Des maires en campagne (s). Politix, (1), 17–42.
WARSZAWSKI, J., BAJOS, N., MEYER, L.,DELAMBALLERIE, X., SENG, R., BEAUMONT, A.-L., SLAMA, R., HISBERGUES, M., RAHIB, D., LYDIE, N. et al. (2020). En mai 2020, 4, 5% de la´ population en france m´etropolitaine a d´evelopp´e des anticorps contre le sars-cov-2. premiers r´esultats de l’enquˆete nationale epicov.
ZEITOUN, J.-D., FARON, M., MANTERNACH,S., FOURQUET, J., LAVIELLE, M. andLEFEVRE,J. (2020). Reciprocal association between participation to a national election and the epidemic spread of COVID-19 in France: nationwide observational and dynamic modeling study. medrxiv working-paper.
O
NLINE
A
PPENDIX
A
Additional tables
Table A1: Distribution of number of lists per city in 2020.
Unweighted fraction Weighted –
(in %) (in %) Num. lists = 1 38.76 14.68 Num. lists = 2 39.16 32.93 Num. lists = 3 12.75 19.01 Num. lists = 4 4.53 10.78 Num. lists = 5 2.00 6.65 Num. lists = 6 1.04 4.53 Num. lists = 7 0.62 3.56 Num. lists = 8 0.46 2.89 Num. lists = 9 0.26 1.77 Num. lists = 10 0.22 1.64 Num. lists = 11 0.15 1.06 Num. lists = 12 0.01 0.16 Num. lists = 13 0.02 0.16 Num. lists = 14 0.01 0.18 Total 100.00 100.00 N 9836 9836
NOTES: This table presents the marginal distribution of the
num-ber of lists by city. Column (1) presents the unweighted distri-bution while column (2) present the distridistri-bution weighted by the number of candidates.
Table A2: Main RDD specification: hot spots
Outcomes Falsification
(1) (2) (3) (4) (5)
Candidate in ’20 Councilor in ’19 Death Mar.-Apr. ’20 Age Death bef. Feb. ’20
RD Estimate 0.162*** 0.519*** 0.000334 -0.0817 0.0109
(0.0215) (0.0220) (0.00188) (0.282) (0.00846)
Sample size 18617 18617 18617 18617 18617
Effective samp. size 8969 7962 8671 9250 9907
Bandwidth 0.214 0.185 0.202 0.228 0.255
NOTES: This table presents RDD estimates using the win (or loss) margin of the list to which the candidate belonged in 2014 as the running variable. Bias-corrected confidence intervals are constructed following the method proposed byCalonico et al.(2014b) as implemented inCalonico et al.(2014a). The local polynomial used to construct the point estimate is of order 1 and is fitted weighing observations with a triangular kernel. The local polynomial used to construct the bias correction is of order 2. The bandwidth selec-tion is chosen based on a MSE-minimizing criterion. Robust standard errors clustered at the city level are reported in parentheses. *p <0.1, ** p < 0.05, *** p < 0.01.
Table A3: RDD specification: death in April March versus death during the peak weeks
Entire country Hotspot
(1) (2) (3) (4)
Death Mar.-Apr. ’20 Peak Weeks (13 & 14) Death Mar.-Apr. ’20 Peak Weeks (13 & 14)
RD Estimate -0.000547 -0.0000769 0.000363 0.00114
(0.000750) (0.000377) (0.00162) (0.00146)
Sample size 106767 106767 18617 18617
Effective samp. size 45358 52047 9008 8721
Bandwidth 0.179 0.220 0.215 0.204
NOTES: This table presents RDD estimates using the win (or loss) margin of the list to which the candidate belonged in 2014 as the run-ning variable. The sample is composed of all male candidates in the 2014 municipal election born before 1960. Bias-corrected confidence intervals are constructed following the method proposed byCalonico et al.(2014b) as implemented inCalonico et al.(2014a). The lo-cal polynomial used to construct the point estimate is of order 1 and is fitted weighing observations with a triangular kernel. The lolo-cal polynomial used to construct the bias correction is of order 2. The bandwidth selection is chosen based on a MSE-minimizing criterion. Robust standard errors clustered at the county (d´epartement) level are reported in parentheses. *p < 0.1, ** p < 0.05, *** p < 0.01.
Table A4: RDD specification checks: local polynomial of order 2 (all of France)
Outcomes Falsification
(1) (2) (3) (4) (5)
Candidate in ’20 Councilor in ’19 Death Mar.-Apr. ’20 Age Death bef. Feb. ’20
RD Estimate 0.145*** 0.523*** -0.000825 0.123 0.00263
(0.0166) (0.0141) (0.000982) (0.181) (0.00503)
Observations 106767 106767 106767 106767 106767
NOTES: This table presents RDD estimates using the win (or loss) margin of the list to which the candidate belonged in 2014 as the running variable. Bias-corrected confidence intervals are constructed following the method proposed byCalonico et al.
(2014b) as implemented inCalonico et al.(2014a). The local polynomial used to construct the point estimate is of order 2 and is fitted weighing observations with a triangular kernel. The local polynomial used to construct the bias correction is of order 2. Robust standard errors clustered at the county (d´epartement) level are reported in parentheses. *p < 0.1, ** p < 0.05, *** p <0.01.
Table A5: RDD specification checks: local polynomial of order 2 (hotspots)
Outcomes Falsification
(1) (2) (3) (4) (5)
Candidate in ’20 Councilor in ’19 Death Mar.-Apr. ’20 Age Death bef. Feb. ’20
RD Estimate 0.157*** 0.515*** 0.000162 -0.267 0.0106
(0.0285) (0.0282) (0.00237) (0.379) (0.0106)
Observations 18617 18617 18617 18617 18617
NOTES: This table presents RDD estimates using the win (or loss) margin of the list to which the candidate belonged in 2014 as the running variable. Bias-corrected confidence intervals are constructed following the method proposed byCalonico et al.
(2014b) as implemented inCalonico et al.(2014a). The local polynomial used to construct the point estimate is of order 2 and is fitted weighing observations with a triangular kernel. The local polynomial used to construct the bias correction is of order 2. Robust standard errors clustered at the city level are reported in parentheses. *p < 0.1, ** p < 0.05, *** p < 0.01.
Table A6: RDD specification changing the bandwidth selection method: Whole country
Candidate in 2020 Death Mar.-Apr. ’20
(1) (2) (3) (4) (5) (6)
RD Estimate 0.156*** 0.157*** 0.159*** -0.000547 -0.000442 -0.000513
(0.0127) (0.0125) (0.0118) (0.000750) (0.000713) (0.000703)
Sample size 106767 106767 106767 106767 106767 106767
Effective samp. size 43400 47900 49133 45358 47273 49133
BW selection method MSE opt. 2-sided MSE opt. Manual (-.2,.2) MSE opt. 2-sided MSE opt. Manual(-.2,.2)
BW value .168 (.158;.244) .2 .178 (.222;.153) .2
NOTES: This table presents RDD estimates using the win (or loss) margin of the list to which the candidate belonged in 2014 as the running
vari-able. The sample is composed of all male candidates in the 2014 municipal election born before 1960. Bias-corrected confidence intervals are
constructed following the method proposed byCalonico et al.(2014b) as implemented inCalonico et al.(2014a). The local polynomial used to
construct the point estimate is of order 1 and is fitted weighing observations with a triangular kernel. The local polynomial used to construct the bias correction is of order 2. The bandwidth selection is chosen based on a MSE-minimizing criterion. Robust standard errors clustered at the county (d´epartement) level are reported in parentheses. *p < 0.1, ** p < 0.05, *** p < 0.01.
Table A7: RDD specification changing the bandwidth selection method: Hotspots
Candidate in 2020 Death Mar.-Apr. ’20
(1) (2) (3) (4) (5) (6)
RD Estimate 0.162*** 0.163*** 0.117*** 0.000334 0.000306 0.00305
(0.0215) (0.0210) (0.0420) (0.00188) (0.00192) (0.00206)
Sample size 18617 18617 8567 18617 18617 8567
Effective samp. size 8969 9283 2872 8671 8261 2687
BW selection method MSE opt. 2-sided MSE opt. MSE opt. in (-.2,.2) MSE opt. 2-sided MSE opt. MSE opt. in (-.2,.2)
BW value .213 (.22;.241) .052 .202 (.203;.178) .047
NOTES: This table presents RDD estimates using the win (or loss) margin of the list to which the candidate belonged in 2014 as the running variable. The
sample is composed of all male candidates in the 2014 municipal election born before 1960. Bias-corrected confidence intervals are constructed
follow-ing the method proposed byCalonico et al.(2014b) as implemented inCalonico et al.(2014a). The local polynomial used to construct the point estimate
is of order 1 and is fitted weighing observations with a triangular kernel. The local polynomial used to construct the bias correction is of order 2. The bandwidth selection is chosen based on a MSE-minimizing criterion. Robust standard errors clustered at the municipality (commune) level are reported in parentheses. *p < 0.1, ** p < 0.05, *** p < 0.01.
B
Additional figures
Figure B1: Number of confirmed Covid-19 cases on March 14, 2020 by county (d´epartement)
0
200 400 600 800
Nb. of confirmed cases per 1M inhab. on March 14, 2020
09 1536 1008 8703 4118 2262 6140 7923 1633 8584 5266 4853 2446 7681 5964 8619 5865 4438 8272 6345 3149 3730 4332 0435 2855 2921 1789 5127 7391 1206 3971 5093 5477 8313 0769 0134 7094 4214 9211 2678 9575 7447 802B 5788 0256 0525 6760 2A9068
NOTES: This figure presents the number of confirmed cases on March 14, 2020 by d´epartement. The y-axis indicates the d´epartement identifier in the French nomenclature.
Figure B2: Number of lists in the first round of the election and observable mu-nicipal characteristics – focus on hotspots.
(a) Abstention rate in 2020
0.670 (0.003) 0.502 (0.004) .5 .55 .6 .65 .7
Abstention rate in 2020 (bin averages)
1 2 3 4+
Nb. of lists in first round 2020
(b) Abstention rate in 2014 0.368 (0.004) 0.362 (0.003) .36 .38 .4 .42 .44 .46
Abstention rate in 2014 (bin averages)
1 2 3 4+
Nb. of lists in first round 2020 (c) Confirmed cases per 1m inhab.
186.26 (9.41) 158.34 (7.87) 50 100 150 200
# cases/1m inhab. on March 14 (bin averages)
1 2 3 4+
Nb. of lists in first round 2020
(d) Share of dense municipalities
0.418 (0.021) 0.623 (0.019) .4 .6 .8 1
Share of dense municipalities (bin averages)
1 2 3 4+
Nb. of lists in first round 2020 (e) Age 66.13 (0.12) 66.51 (0.08) 65.8 66 66.2 66.4 66.6 66.8 67 67.2 67.4 67.6 67.8
Age (bin averages)
1 2 3 4+
Nb. of lists in first round 2020
NOTES: This figure presents the number of lists in the first round of the 2020 French municipal election in hotspots (ˆIle de France and Grand-Est) confronted to (a) the absention rate in 2020, (b) the abstention rate in 2014, (c) the number of confirmed cases on March 14, 2020 per million of inhabitants, (d) the share of municipalities with population density higher than 2000 inhabitants per square kilometer (e) age of candidates. Dots represent averages, brackets 95% CI using robust standard errors clustered at the city-level. Cities with 4 or more lists are binned together (the full distribution of the number of lists is presented in TableA1).