HAL Id: cea-02384087
https://hal-cea.archives-ouvertes.fr/cea-02384087
Submitted on 2 Dec 2019HAL is a multi-disciplinary open access archive for the deposit and dissemination of sci-entific research documents, whether they are pub-lished or not. The documents may come from teaching and research institutions in France or abroad, or from public or private research centers.
L’archive ouverte pluridisciplinaire HAL, est destinée au dépôt et à la diffusion de documents scientifiques de niveau recherche, publiés ou non, émanant des établissements d’enseignement et de recherche français ou étrangers, des laboratoires publics ou privés.
Modeling of the chemical behavior of sodium fire
aerosols during atmospheric dispersion
Alice Plantamp, Thierry Gilardi, Hervé Muhr, Christophe Perrais
To cite this version:
Alice Plantamp, Thierry Gilardi, Hervé Muhr, Christophe Perrais. Modeling of the chemical behavior of sodium fire aerosols during atmospheric dispersion. Aerosol Science and Technology, Taylor & Francis, 2016, 50 (7), pp.705-716. �10.1080/02786826.2016.1178852�. �cea-02384087�
1
Modelling of the chemical behavior of sodium fire aerosols during
atmospheric dispersion
PLANTAMP Alicea*, GILARDI Thierrya, MUHR Hervéb et PERRAIS Christophea aCEA, DEN, DTN/SMTA/LIPC
13108 Saint-Paul-Lez-Durance, France
bLRGP CNRS UMR 7274, ENSIC, Université de Lorraine 1 rue Grandville, 54 001 Nancy, France
Abstract:
The use of liquid sodium, as a coolant in Sodium cooled Fast Reactors (SFR) circuits requires studying the consequences of a sodium fire for safety analysis, and particularly the toxicological impact of sodium fire aerosols. More particularly, the carbonation of sodium fire aerosols from sodium hydroxide (NaOH) to sodium carbonate (Na2CO3) is investigated.
A new kinetic model, based on the CO2 reactive absorption and the two-film theory, is developed to describe the carbonation process of NaOH solutions, taking into account the NaOH aerosols’ initial characteristics in equilibrium with the atmosphere. This model is applied for the case of NaOH aerosols, considering the CO2 absorption at the particle external surface. By comparisons with experimental data, the model is validated over the studied range of relative humidity and initial particle diameter. However, the values of the interfacial area need to be consolidated and justified.
A new experimental device is developed for monitoring the physicochemical behavior of aerosols from a sodium fire in controlled conditions of reactive atmosphere (especially humidity). The preliminary experimental results are compared to new literature data (Anantha Narayanan et al., 2015) and with the reactive absorption model.
Keywords: reactive absorption, carbonation, sodium fire, aerosol
Highlights: - description of aerosols initial state by thermodynamic approach
- new modelling of NaOH aerosols carbonation by reactive absorption
- design of an experimental device and preliminary results for monitoring aerosols carbonation kinetics
2
1. Introduction
In the context of research on Generation IV nuclear reactors, the sodium-cooled fast reactor (SFR) technology is currently developed in France through the ASTRID project of a semi-industrial prototype reactor for technological demonstration, and through the implementation of supporting R&D facilities. Within the scope of nuclear safety analyses for these facilities, the risk of sodium fires must be taken into consideration when evaluating the consequences of accidental sodium leakage scenarii. Due to their corrosive or irritant nature, it is important to be able to evaluate the release of sodium fire aerosols likely to be partially dispersed into the atmosphere.
In case of sodium combustion, the aerosols are composed of sodium oxides (Na2O and Na2O2). Then they quickly react with humidity in the air and are transformed into sodium hydroxide aerosols (NaOH), which are toxic owing to their corrosive nature. These aerosols are very hygroscopic and form fine droplets of soda that then carbonate by reaction with carbon dioxide (CO2) in the atmosphere. Sodium carbonate aerosols (Na2CO3) are, however, much less toxic. This is why the aerosol chemical transformation must be described more precisely. Among the reactions mentioned, sodium oxidation and oxide hydration can be considered to be instantaneous reactions, because of a very quick transfer (less than one second) of water vapor in gas phase to the oxides aerosols surface (Cooper, 1980). As proposed previously by different authors like Cooper (1980), Ramsdale (1989), Cherdron et al. (1984), the carbonation of soda aerosols is slower due to the transfer of CO2 through a porous solid layer of Na2CO3, and represents the limiting step of the chemical evolution to complete the carbonation of aerosols. This is why the present study has therefore focused on the carbonation reaction kinetics. During the chemical evolution of aerosols from a sodium fire, the sodium hydroxide carbonation with atmospheric CO2 can be written as follows:
2 NaOH (solid or liquid) + CO2(gas) → Na2CO3, H2O (solid).
Because of the low NaOH aerosols concentration in the atmosphere (maximum measured around 25g/m3 in a natural venting cell (Jordan and Cherdron, 1988)), the aerosols are diluted (volume fraction below 1.10-4) and so they can be considered as isolated particles.
Previous studies by Clough and Garland (1971), Cooper (1980) and Ramsdale (1989) have shown that the shrinking core model appears to be suitable for predicting the chemical conversion of soda aerosols into sodium carbonate. This model has been validated (Gilardi et al., 2013 and Plantamp et al., 2014) with experimental results provided by Hofmann et al. (1979), Cherdron et al. (1984) and
3
Subramanian et al. (2009), for aerosols with small diameters (≤ 1 micron) and for relative humidity levels above 20%. The shrinking model is devoted to study a heterogeneous reaction between a fluid reagent and a solid reagent particle.
However, analysis of the initial state of sodium hydroxide aerosols shows that this compound is found in liquid form, in more or less concentrated aqueous solution depending on the atmospheric humidity. The quantity of water absorbed by the sodium hydroxide aerosols (hygroscopic and deliquescent) varies according to the atmospheric relative humidity (Twomey, 1953). It has a direct impact on the initial physical state of these aerosols, as well as on their physicochemical properties (particle size, density, solubility and diffusivity of CO2, which determine its transfer into aqueous solution). As seen in the previous section, the impact of relative humidity on the total conversion time must also be described in a more in-depth manner by integrating CO2 absorption into the kinetic model.
This is why we choose to implement a modelling that is more adapted to reactions coupled with transfer between two fluids. Studies by Danckwerts (1970) and Colle (2006), among others, reveal that the reactive absorption of CO2 in a sodium hydroxide solution can be used to describe carbonation kinetic reactions. Consequently, this type of reactive absorption model is incorporated into our kinetic model to describe the carbonation of soda aerosols. This model is compared to the available experimental results in the literature and the new ones coming from an experimental device designed for monitoring aerosols carbonation kinetics in controlled atmosphere.
2. Theory
Considering the fact that the limiting reagent is CO2 and to quantify its transfers at the gas-liquid interface, the physical phenomena occurring during the transfer of CO2 from the atmosphere into the soda particles needs to be specified. More specifically, the location of the gas-liquid interface needs to be described. This interface can be located:
• either on the outer surface of the particle, with the sodium carbonate pores filled with the aqueous solution of sodium hydroxide (case 1),
• or on the inner surface of the particle, with the sodium carbonate pores filled with air which adds a transfer stage for gaseous diffusion into the porous environment (case 2).
4
These two configurations in porous environments (comprising the Na2CO3 layer on the external surface of NaOH aerosols) are represented in Figure 1 along with the corresponding CO2 concentration profiles.
Depending on the case, two or three main stages can be distinguished in the mechanism of this reaction, i.e.:
• External transport of CO2 in the atmosphere towards the surface of the particle in the gas film, • CO2 diffusion (in gas phase) through the sodium carbonate pores that are formed (case 2
only),
• Reactive absorption of CO2 in the NaOH solution on the surface of the particle in the liquid film.
The concentration profile for the gas in the particle can be represented as shown in Figure 1, for cases 1 and 2, in which the absorption and reaction of CO2 can both be distinguished.
Figure 1: CO2 concentration profile in the particle: a) for case 1 - pores filled with aqueous soda and b)
5
Among the theories used to quantify transfers at the gas-liquid interface during the physical absorption of a gas at a liquid surface, the most frequently used is Whitman's two-film theory (Whitman, 1923). In this theory, resistance to mass transfer is found on either side of the interface in two thin films in which transfers are controlled by molecular diffusion. The occurrence of a chemical reaction after absorption leads to a diminution of the transferred reagent concentration and consequently an increase of the transfer rate in the liquid film (and thus the overall absorption) due to the enhanced concentration gradient. This increase is modelled by the enhancement factor, E, defined as the rate of the material flow in liquid phase with the chemical reaction and the ratio obtained in the case of pure absorption (without chemical reaction).
The CO2 specific flow rates in the liquid film NL (in mol.m-2.s-1) and in the gas film NG are given by the following expressions for the two-film model with reactive absorption:
𝑁𝑁𝐿𝐿= 𝑘𝑘𝐿𝐿 𝐸𝐸 �𝐶𝐶𝐶𝐶𝐶𝐶2,𝑖𝑖− 𝐶𝐶𝐶𝐶𝐶𝐶2,𝐿𝐿� (1)
𝑁𝑁𝐺𝐺= 𝑘𝑘𝐺𝐺 �𝐶𝐶𝑔𝑔𝐶𝐶𝐶𝐶2,∞− 𝐶𝐶𝑔𝑔𝐶𝐶𝐶𝐶2,𝑖𝑖� (2)
with: kL: liquid-side transfer coefficient (m.s-1) E: enhancement factor
CCO2,x: concentration of CO2 in liquid phase, x = i at the interface or L in the liquid (mol.m-3).
kG: gas-side transfer coefficient (m.s-1) Cg
CO2,x: concentration of CO2in gas phase, x = i at the interface or ∞ in the gas (mol.m-3).
The global flow rates of CO2 (mol.s-1) for one aerosol particle are related to the NG and NL specific flow rates, as well as the NaOH conversion rate - written XNaOH - according to the following relations defined for each step:
• External transport: 𝐽𝐽𝐶𝐶𝐶𝐶2= 4 𝜋𝜋 𝑅𝑅2 𝑁𝑁
𝐺𝐺 (3)
• Reactive absorption: 𝐽𝐽𝐶𝐶𝐶𝐶2= �4 𝜋𝜋 𝑅𝑅2 𝜏𝜏𝑠𝑠𝑠𝑠𝑠𝑠𝑠𝑠 𝑁𝑁𝐿𝐿 𝑓𝑓𝑓𝑓𝑓𝑓 𝑐𝑐𝑐𝑐𝑐𝑐𝑐𝑐 1 4 𝜋𝜋 𝑓𝑓2 𝜏𝜏
𝑠𝑠𝑠𝑠𝑠𝑠𝑠𝑠 𝑁𝑁𝐿𝐿 𝑓𝑓𝑓𝑓𝑓𝑓 𝑐𝑐𝑐𝑐𝑐𝑐𝑐𝑐 2 (4) • Diffusion through the pores: 𝐽𝐽𝐶𝐶𝐶𝐶2= 4 𝜋𝜋 𝑅𝑅2 𝑁𝑁
𝐺𝐺 (case 2 only) (5)
• Relation with the NaOH conversion rate (reaction): 𝐽𝐽𝐶𝐶𝐶𝐶2=1
2 𝑛𝑛°𝑁𝑁𝑁𝑁𝐶𝐶𝑁𝑁
𝑑𝑑𝑑𝑑𝑁𝑁𝑁𝑁𝑁𝑁𝑁𝑁
𝑑𝑑𝑑𝑑 (6) with: τsurf : ratio of accessible surface area ,at the external surface, with radius R (case 1) or r (case 2)
n°NaOH: initial quantity of NaOH contained in the aerosol (mol) t: reaction time (s).
6
3. Modelling
For the reactive absorption model, the main parameter to be calculated during the reaction time and for the various conditions is the enhancement factor E. According to Danckwerts (1970), this factor can be easily calculated if the reaction considered is a pseudo first-order reaction (with respect to the limiting reagent). In order to determine the chemical reaction order, the ratio between the Hatta number and the enhancement factor for an instantaneous reaction (Einst) needs to be calculated. The Hatta number (Ha) compares the kinetic rate of reaction in a liquid film to the transfer flow rate of diffusion through the film. When the ratio Ha/Einst is lower than one, the reaction can be considered as pseudo first-order according to the operating conditions, as described by Danckwerts (1970).
The Hatta number Ha and the enhancement factor for an instantaneous reaction Einst are respectively defined in the case of NaOH carbonation by Colle (2006):
𝐻𝐻𝑐𝑐 = �𝑘𝑘𝑁𝑁𝑁𝑁− 𝐷𝐷𝐶𝐶𝑁𝑁2,𝐿𝐿 𝐶𝐶𝑁𝑁𝑁𝑁−,𝐿𝐿
𝑘𝑘𝐿𝐿 (7)
𝐸𝐸𝑖𝑖𝑖𝑖𝑠𝑠𝑑𝑑 = 1 + 12 𝐷𝐷𝐷𝐷𝑁𝑁𝑁𝑁−,𝐿𝐿𝐶𝐶𝐶𝐶2,𝐿𝐿 𝐶𝐶𝐶𝐶𝑁𝑁2,𝑖𝑖 𝐶𝐶𝑁𝑁𝑁𝑁−,𝐿𝐿 (8) with: kOH- : kinetic constant of reaction rate (m3.mol-1.s-1)
DCO2,L: diffusion coefficient of CO2 in the liquid (m2.s-1)
DOH-,L: diffusion coefficient of OH- ions in the liquid (m2.s-1)
COH-,L: concentration of OH- ions in the liquid (mol.m-3).
The Hatta number can also be used to determine the apparent kinetic order of the reaction depending on the atmospheric conditions. When the reaction is pseudo first-order, the chemical reaction occurs completely in the liquid film and the enhancement factor (E) is calculated according to the simplified equation below:
𝐸𝐸 = 𝑑𝑑𝑁𝑁𝑖𝑖ℎ(𝑁𝑁𝑁𝑁)𝑁𝑁𝑁𝑁 ≈ 𝐻𝐻𝑐𝑐 𝑖𝑖𝑓𝑓 𝐻𝐻𝑐𝑐≥ 3. (9)
3.1 Hatta number and enhancement factor calculations
The mass balance enables to link the NaOH conversion rate XNaOH with NaOH concentration, by taking into account the sodium carbonate solubility into the NaOH aqueous solution, before crystallization, and assuming that the quantity of water is constant in the particle. This initial quantity of water depends on the relative humidity and is determined on the basis of the hygroscopic property of
7
sodium hydroxide (assuming that the liquid-vapor equilibrium of water on the particle surface has been reached).
Based on the experimental data provided by Hamer and Wu (1972) on the osmotic coefficient of a NaOH solution, a relationship is established between the relative humidity and the NaOH mole fraction depending on the molarity of the solution, and consequently with the radius of the hydrated particle. It is assumed that the particle's thermal and mechanical equilibrium with the environment is reached. A linear relationship is established between the mole fraction of NaOH and the solution's density based on data provided in Lide (1998).
♦ The rate of reaction kOH- is calculated according to the expression given by Pohorecki and Moniuk (1988), which assume that extrapolation is possible at ionic strengths exceeding 6mol.L-1:
𝑙𝑙𝑓𝑓𝑙𝑙 𝑘𝑘𝐶𝐶𝑁𝑁−
𝑘𝑘∞ 𝐶𝐶𝑁𝑁−
� = 0.221 𝐼𝐼 − 0.016 𝐼𝐼2 (10)
with: I: ionic strength of the solution (mol.m-3)
k∞OH-: reaction rate at infinite dilution (m3.mol-1.s-1) depending on the temperature T (K)
according to the following relationship: log 𝑘𝑘∞𝐶𝐶𝑁𝑁−= 11.895 − 2382 𝑇𝑇� defined by Pohorecki and Moniuk (1988).
♦ The diffusion coefficient of CO2 in a NaOH solution with a concentration COH-,L is calculated according to the following equation based on experimental data provided by Nijsing et al. (1959):
𝐷𝐷𝐶𝐶𝐶𝐶2= 𝐷𝐷𝐶𝐶𝐶𝐶2/𝑤𝑤𝑁𝑁𝑑𝑑𝑤𝑤𝑠𝑠 �𝜇𝜇𝑠𝑠𝑠𝑠𝑠𝑠�𝜇𝜇𝑤𝑤𝑁𝑁𝑑𝑑𝑤𝑤𝑠𝑠�𝛼𝛼 𝑤𝑤𝑖𝑖𝑤𝑤ℎ 𝛼𝛼 = 0.85 (11)
with: DCO2/water:diffusion coefficient of CO2 in pure water (m2.s-1), depending on the temperature T according to the equation given by Pohorecki and Moniuk (1988)
μsol: viscosity of the solution (Pa.s), according to the fraction of NaOH - data from Lide (1998)
μwater: viscosity of water at the temperature T (Pa.s) - data from Lide (1998).
♦ The concentration of CO2 at the liquid-side interface, CCO2,i, is assumed to be in equilibrium with the partial pressure pCO2,i at the interface. This equilibrium is expressed here using Henry's law by incorporating Henry's constant for CO2 or solubility, H (mol.m-3.bar-1): 𝐶𝐶𝐶𝐶𝐶𝐶2,𝑖𝑖 = 𝐻𝐻 𝑝𝑝𝐶𝐶𝐶𝐶2,𝑖𝑖.
The solubility of CO2 in a NaOH solution, which varies as a function of the ionic strength of the medium, is calculated using data provided by Schumpe (1993) and the following equation:
𝑙𝑙𝑓𝑓𝑙𝑙 𝐻𝐻 𝐻𝐻°� = � 𝐶𝐶𝑖𝑖 �ℎ𝑖𝑖+ ℎ𝑔𝑔𝑁𝑁𝑠𝑠� 𝑖𝑖𝑠𝑠𝑖𝑖 𝑖𝑖
8
(12)
with: H°: solubility of CO2 in water (mol.m-3.bar-1) as a function of the temperature
hi and hgas: ion and gas contributions whose values are given by Schumpe (1993) and Danckwerts (1970).
♦ The diffusion coefficient of OH- ions in the aqueous NaOH solution can be estimated according to the expression below given by Danckwerts (1970). It involves the ionic conductivity of Na+ and OH -ions - written λNa+ and λOH- respectively - and the mean activity coefficient of the electrolyte γ, as well as Faraday's constant (F) and the ideal gas constant Rgas.
𝐷𝐷𝐶𝐶𝑁𝑁− =𝑅𝑅2 𝐹𝐹𝑔𝑔𝑁𝑁𝑔𝑔2 𝑇𝑇
λ𝑁𝑁𝑁𝑁+ λ𝑁𝑁𝑁𝑁−
λ𝑁𝑁𝑁𝑁++ λ𝑁𝑁𝑁𝑁−�1 +
𝑑𝑑 𝑠𝑠𝑖𝑖 𝛾𝛾
𝑑𝑑 𝑠𝑠𝑖𝑖 𝐶𝐶𝑁𝑁𝑁𝑁𝑁𝑁𝑁𝑁� (13)
♦ The mass transfer coefficient in liquid phase kL is calculated using Sherwood's number ShL, which is calculated in the case of natural convection in a spherical particle based on Schmidt's number ScL and Grashof's number Gr according to the following expression given by Churchill (1983):
𝑆𝑆ℎ𝐿𝐿= 2 + 0.569 (𝑆𝑆𝑐𝑐𝐿𝐿 𝐺𝐺𝑓𝑓)1�4 𝑓𝑓𝑓𝑓𝑓𝑓 𝑆𝑆𝑐𝑐𝐿𝐿≥ 0.7𝑐𝑐𝑤𝑤 𝐺𝐺𝑓𝑓. 𝑆𝑆𝑐𝑐𝐿𝐿< 108 (14)
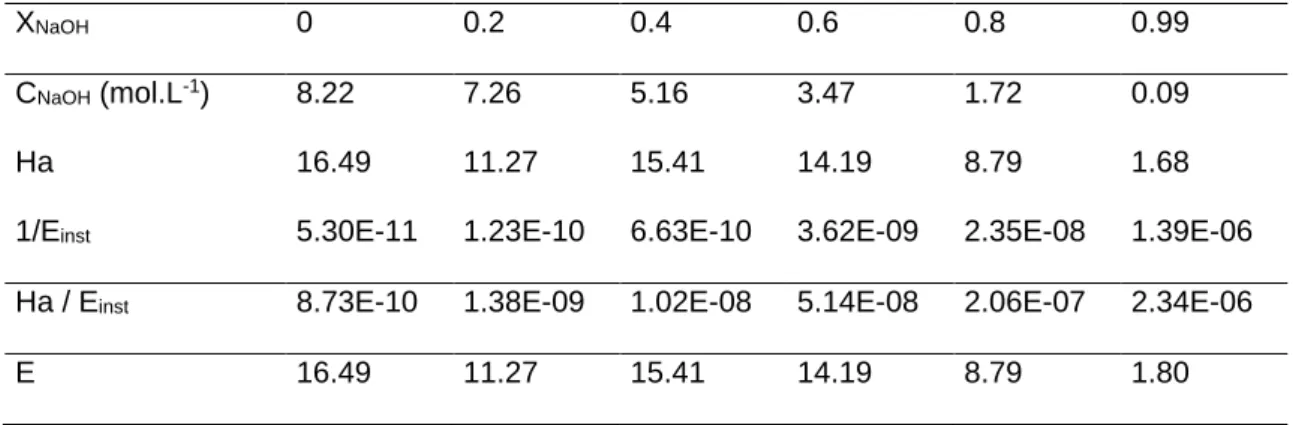
Table 1 below lists the physical parameters that are calculated in order to determine the Hatta number and the enhancement factor, as a function of the NaOH conversion rate, at a relative humidity of 50% and a temperature of 20°C.
Table 1: Some physical parameters used to calculate the Hatta number, the enhancement factor as a function of the conversion rate of NaOH for 50% of relative humidity at 20°C
XNaOH 0 0.2 0.4 0.6 0.8 0.99
CNaOH (mol.L-1) 8.22 7.26 5.16 3.47 1.72 0.09
Ha 16.49 11.27 15.41 14.19 8.79 1.68
1/Einst 5.30E-11 1.23E-10 6.63E-10 3.62E-09 2.35E-08 1.39E-06 Ha / Einst 8.73E-10 1.38E-09 1.02E-08 5.14E-08 2.06E-07 2.34E-06
E 16.49 11.27 15.41 14.19 8.79 1.80
Since the Hatta number is generally over 3 and the Ha/ Einst ratio is smaller than one, it can be deduced that the carbonation reaction can be considered as pseudo first-order regarding CO2 (NaOH in great excess), which therefore made it possible to calculate easily the enhancement factor. Variation of this enhancement factor with the conversion rate shows that, when carbonation
9
progresses, the reaction enhancement effect on the reactive absorption stage decreases. We also can indicate that the trend is all the more significant since the relative humidity is high.
3.2 Transfer model
Based on the molar flow rate expressions for CO2 described above (equations (1) to (6)), the following expression of the kinetic model, which associates the reaction time and the NaOH conversion rate, is inferred: 𝑑𝑑𝑤𝑤 = 𝑖𝑖°𝑁𝑁𝑁𝑁𝑁𝑁𝑁𝑁 8 𝜋𝜋 𝐶𝐶𝑔𝑔𝐶𝐶𝑁𝑁2,∞ 1 𝑅𝑅2 � 1 𝑘𝑘𝐺𝐺+ 1 𝑘𝑘𝐿𝐿𝜏𝜏𝑔𝑔𝑠𝑠𝑠𝑠𝑠𝑠 𝐸𝐸 𝑁𝑁 𝑅𝑅𝑔𝑔𝑁𝑁𝑔𝑔 𝑇𝑇� 𝑑𝑑𝑋𝑋𝑁𝑁𝑁𝑁𝐶𝐶𝑁𝑁 (15)
As this equation cannot be integrated simply, the variation in the reaction time is calculated by applying successive increments of the conversion rate (with an increment size of dXNaOH = 0.01). The parameter τsurf (ratio of accessible absorption surface in the open porosity at the external surface) is supposed to be a function of both the atmospheric conditions (relative humidity and initial diameter of aerosol) and the conversion rate. Though an obvious decrease of this parameter has to be considered (reduction of accessible surface with time), it has to be estimated since to our knowledge there is no model available to determine this variable. Currently this parameter has been adjusted in this study, according to the experimental results of Anantha Narayanan et al. (2015) , Subramanian et al. (2009), Cherdron et al. (1984) and Hofmann et al. (1979), as explained and discussed further in section 5.
On the base of this preliminary validation of the kinetic model (including an estimation of the ratio of accessible absorption surface), a correlation XNaOH = f(t) will be determined, with possible application in terms of relative humidity, initial granulometry and CO2 concentration, so it can be directly integrated into the aerosol dispersion model.
4. Material and methods
In the aim of model validation, an experimental device was developed to study the physicochemical behavior of aerosols generated from a sodium fire in controlled conditions of atmosphere composition (especially water vapor content) and for an appropriate sampling of aerosol (conditioning under inert gas).
The device comprises two removable parts covered with thermal insulation. The top part (aerosol chamber) has a volume of 40 liters and is heated by an external electric resistance. The top part is
10
equipped with three circular openings (100 mm diameter) which can be fitted with nozzles to connect incoming gas pipes or sampling lines, as well as various sensors. The bottom part includes a sodium compartment and an inert gas flushing system (here argon); and is heated by a hotplate. A manual shut-off device is used to isolate the sodium compartment (with about 10 g of sodium) from the atmosphere of the aerosol chamber, and when the combustion is required to put the liquid sodium in contact with the combustion atmosphere contained in the top part. When the aerosol chamber is settled at the desired operating conditions (humidity and temperature), the combustion is started and lasts 1 minute, during which the aerosols are produced. Then the shut-off system is closed and the reactive gas inlet keeps the aerosols in suspension. Samples of aerosols are taken during 30 to 60 seconds at fixed times, up to several minutes after the combustion. The schematic diagram of the device is shown in Figure 2.
Figure 2: Process flow diagram of the experimental device
The composition of the chamber atmosphere is controlled by a hygrometer and a mass spectrometer (for respectively H2O, CO2, and O2 concentrations) and the reactive gas mixture (containing O2, N2, H2O and CO2) is provided by a steam generating system mixing the desired water vapor content with a gas mixture of the other components. The gas mixture supply is adjusted by a regulation system in order to compensate the consumption of the gas reagents during the test. This device also contains a system designed to sample at given times the aerosols by filtration and at the end of the test by
11
sedimentation. The samples collected by filtration are conditioned by flushing an inert gas (argon) in order to stop the progress of all chemical reactions and their chemical analysis is performed for kinetic monitoring and is completed with morphology characterizations (by scanning electron microscopy for instance). The chemical analysis is made by an acid-base titration with hydrochloric acid monitored by conductometry, with a correct precision (relative error below 10%) for sample mass above 10 mg.
5. Results and discussions
The reactive absorption model as described previously is compared with several available sets of experimental data provided by Hofmann et al. (1979), Cherdron et al. (1984), Subramanian et al. (2009) and Anantha Narayanan et al. (2015), then with the new experimental results coming from the device presented above. The model parameters are adapted to the experimental data of each study, such as the relative humidity, the initial diameter of the aerosols, the partial pressure of CO2 and the temperature.
Moreover, the ratio of accessible surface area τsurf is adjusted for each relative humidity studied, for the data provided in the literature. Until the sodium carbonate crystallization begins (Na2CO3 solubility depending on NaOH concentration, and so on relative humidity), all the surface of the liquid particle is accessible to react (τsurf =100%). Then the sodium carbonate crystallization begins, and we notice the decrease rate of this parameter (∆τsurf) is linear with the ratio of accessible surface area, as shown on Figure 3 (parabolic form integrated curve). This figure represents the ratio of accessible surface area (τsurf) according to the conversion rate (XNaOH) for the different cases of relative humidity (cases A to G).
12
Figure 3: Ratio of accessible surface area (τsurf) adjusted for Subramanian et al. (2009), Cherdron et al. (1984) and Hofmann et al. (1979) and Anantha Narayanan et al. (2015)
The adjustments of the ratio of accessible surface area made for the studies at relative humidity over 50% (cases A to E) show that the slope of the evolution curve is the same though the decrease of the surface rate starts at higher NaOH conversion rate for more humid atmosphere conditions (i.e. for more dilute NaOH aerosol droplets). For lower relative humidity, below 40% (cases F and G), the estimation of the ratio of accessible surface area needs some adaptations on the decrease slope of the curve to be in agreement with the experimental data. For low relative humidity, the initial crystallization point is low (at XNaOH=0.05 for RH=20%), so the Na2CO3 crystallization begins at a smaller quantity of this compound and the carbonation process should be slower than for higher relative humidity. Moreover, the adaptations needed to fit the ratio of accessible surface area might be due to some differences of crystallization mechanism depending on humidity, such as the crystallite size and growth direction or the porosity created.
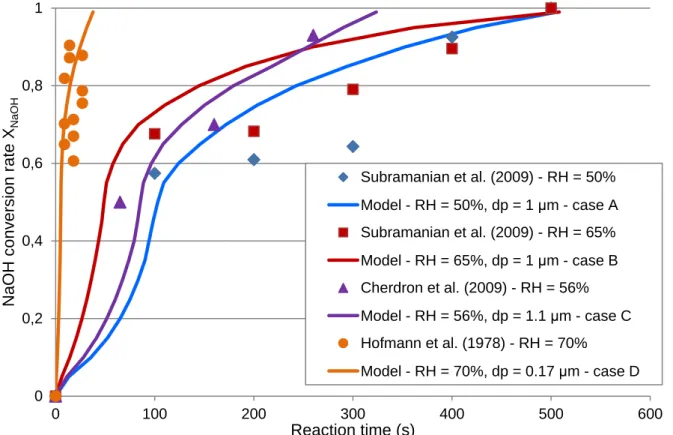
The following graph (Figure 4) represents the comparison at relative humidity between 50% and 70% for the experimental data provided by Subramanian et al. (2009), Cherdron et al. (1984) and Hofmann et al. (1979) with the model simulation for each case. The model curves are calculated for the humidity, initial diameter and ratio of accessible surface area corresponding to each case of relative humidity. 0% 20% 40% 60% 80% 100% 0,0 0,2 0,4 0,6 0,8 1,0 R ati o of ac c es s ibl e s ur fac e τsu rf
NaOH conversion rate XNaOH
τsurf - Case E - RH = 80% τsurf - Case D - RH = 70% τsurf - Case B - RH = 65% τsurf - Case C - RH = 56% τsurf - Case A - RH = 50% τsurf - Case F - RH = 38% τsurf - Case G - RH = 20%
13
Figure 4: Comparison of the experimental data by Subramanian et al. (2009), Cherdron et al. (1984) and Hofmann et al. (1978) with the reactive absorption model (solid line), at relative humidity between
50% and 70%
It can be seen in Figure 4 the influence of the operating conditions, such as the relative humidity and the aerosols diameter. With the cases A to C, it is seen that a slight difference of humidity needs to be taken into account to predict the conversion rate evolution, by means of the ratio of accessible surface area especially. Comparing the cases B and D show the large effect of aerosols diameter (at relative humidity between 65% and 70%), the final conversion time goes to 38 seconds for initial diameter of 0.17 micron (case B) up to 506 seconds for a diameter of 1 micron. During representative sodium fire, the measured aerosols diameter is comprised between 1 to 5 microns approximatively (Jordan and Cherdron, 1988), so this study will focus on experimental comparison with data with those aerosols sizes.
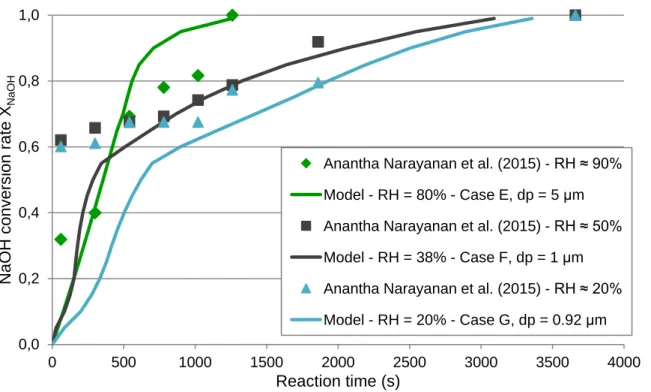
The Figure 5 shows the comparison between the latest experimental data of Anantha Narayanan et al. (2015) with the reactive absorption model. As before, the model curves are calculated for the average humidity, initial diameter and ratio of accessible surface area corresponding to each case of relative humidity of 20%, 50% (with an average at 38%) and 90% (with an average at 80%).
0 0,2 0,4 0,6 0,8 1 0 100 200 300 400 500 600 N aO H c onv er s ion r ate X N aOH Reaction time (s) Subramanian et al. (2009) - RH = 50% Model - RH = 50%, dp = 1 μm - case A Subramanian et al. (2009) - RH = 65% Model - RH = 65%, dp = 1 μm - case B Cherdron et al. (2009) - RH = 56% Model - RH = 56%, dp = 1.1 μm - case C Hofmann et al. (1978) - RH = 70% Model - RH = 70%, dp = 0.17 μm - case D
14
Figure 5: Graph comparing experimental data from Anantha Narayanan et al. (2015) with the reactive absorption model (solid line) at relative humidity of 90%, 50% and 20%
For the three relative humidity studied, the model, with the adjusted evolution of the ratio of accessible surface area, represent well the experimental points for the higher conversion rates. For the first moments, the model underestimates the conversion rate for relative humidity below 50%, but is successful for the case at 90%. This might be due to both experimental and modelling uncertainties. The modelling ones are mainly due to the estimation of Na2CO3 solubility into soda aqueous solution and also to the influence of NaOH concentration on the mass transfer coefficient kL. For the experimental ones, they might be due to the interval between each sampling and the chemical speciation (quench into water that lets the reactions proceed slowly) and the difficulties to control the reactive atmosphere in the aerosol chamber, as explained by Anantha Narayanan et al. (2015). For the highest relative humidity, the aerosols diameter used for the comparison is 5 microns, which is higher than the initial value measured (around 2 microns) in the same conditions (Anantha Narayanan et al., 2015). This difference may due to agglomeration into the aerosol chamber during the carbonation process up to the Na2CO3 crystallization, which happens around XNaOH=0.7 (corresponding time around 300 seconds).
Two successful experiments are performed in our experimental device presented on Figure 2 at relative humidity around 20% (temperature around 75°C), and at CO2 concentration of 390 ppm. The
0,0 0,2 0,4 0,6 0,8 1,0 0 500 1000 1500 2000 2500 3000 3500 4000 N aO H c onv er s ion r ate X N aOH Reaction time (s)
Anantha Narayanan et al. (2015) -RH ≈ 90% Model - RH = 80% - Case E, dp = 5 μm Anantha Narayanan et al. (2015) -RH ≈ 50% Model - RH = 38% - Case F, dp = 1 μm Anantha Narayanan et al. (2015) -RH ≈ 20% Model - RH = 20% - Case G, dp = 0.92 μm
15
results obtained after chemical speciation are presented in Table 2, the time mentioned corresponding to the beginning of each sampling interval, and counted from the beginning of sodium combustion.
Table 2: Results obtained from carbonation of sodium fire aerosols experiments after chemical speciation
Exp # 1 - HR = 23% [CO2] = 390 ppm, T = 77°C
Exp # 2 - RH = 22.5% [CO2] = 390 ppm, T = 75°C
Time (s) XNaOH (-) Time (s) XNaOH (-)
300 0.498 240 0.640
600 0.609 540 0.561
1200 0.740 900 0.587
1200 0.706
The following graph (Figure 6) represents the comparisons between our experimental results and the experimental points of Anantha Narayanan et al. (2015) at relative humidity around 20% and with the reactive absorption model.
Figure 6: Graph comparing experimental data from the present study and from Anantha Narayanan et al. (2015) with the reactive absorption model (solid line) at relative humidity
around 20% 0 0,2 0,4 0,6 0,8 1 0 500 1000 1500 2000 2500 3000 3500 4000 N aO H c onv er s ion r ate X N aOH Reaction time (s) Exp # 1 - HR = 23%, [CO2] = 390 ppm, T = 77°C Exp # 2 - RH = 22.5%, [CO2] = 390 ppm, T = 75°C Anantha Narayanan et al. (2015) -RH ≈ 20% Model - RH = 23% - Case G, dp = 0.92 μm
16
A good agreement can be observed in Figure 6 between the two experiments (Exp #1 and Exp #2) at the same conditions, which confirms a good repeatability of the results (relative error around 5%) for this low relative humidity. Moreover, the experimental results obtained in this study are in good agreement with those of Anantha Narayanan et al. (2015) at equivalent conditions, and with the modelling curve, for which the ratio of accessible surface area is considered with the same values as used before the comparison at 20% of relative humidity (case G).
As a global analysis, a good agreement between the model and the experimental data is obtained for the range of humidity (20 to 90%) and initial diameters (0.17 to 1.1μm) investigated by adjusting the ratio of accessible surface area. Furthermore, variations in the total reaction time with the relative humidity agree with the experimental observations: for equivalent particle sizes, this total reaction time decreases when the relative humidity increases, as shown in the experiments by Subramanian et al. (2009). Finally, the preliminary results from our new experimental device are promising because they are in good agreement with both experimental data of Anantha Narayanan et al. (2015) and the reactive absorption model presented here.
6. Conclusions
A reactive absorption model based on the two-film theory is adapted to describe the chemical behavior of aerosols produced by sodium fires during their atmospheric dispersion. This reactive absorption model is applied to the case of aerosols produced by a sodium fire, taking into account the reactive absorption of CO2 at the outer surface of the particles and by using a parameter to estimate the fraction rate of liquid-gas interfacial area accessible for CO2 absorption. The first comparisons carried out using data from Hofmann et al. (1979), Cherdron et al. (1984), Subramanian et al. (2009) and Anantha Narayanan et al. (2015) seems enough satisfactory to validate this model. These preliminary comparisons must however be confirmed by new experimental data covering a broader range of relative humidity and better controlled atmospheric conditions.
A new experimental device is developed for studying the physicochemical behavior of aerosols from a sodium fire in controlled conditions of reactive atmosphere (especially humidity) and for aerosol sampling (with immediate conditioning under inert gas). Two successful experiments are carried out at relative humidity around 20% (temperature around 75°C), and at CO2 concentration of 390 ppm, which are in good agreement with the model. The further experiments will be performed in order to show the
17
influence of relative humidity (up to 80%) on the chemical conversion of NaOH aerosols, in order to validate the reactive absorption model for a large range of relative humidity.
Notations
CEA French Alternative Energies and Atomic Energy Commission SFR Sodium-cooled fast reactor
ASTRID Advanced Sodium Technological Reactor for Industrial Demonstration RH Relative humidity
CATANA Device designed to test sensors for Na aerosols
References
Anantha Narayanan, R., Subramanian, V., Sahoo, P., Jitendra Misra, Amit Kumar, Baskaran, R., Venkatraman, B. and Murali, N., 2015. Experimental investigations on carbonation of sodium aerosol generated from sodium fire in the context of fast reactor safety. Ann. Nucl. Energy, 80, 188-194. Cherdron, W., Jordan, S. and Linder, W., 1984. Sodium fire particles - chemical transformation and properties. Proc. Conf. Liquid Metal Engineering and Technology, Oxford, Avril 1984, 287-290.
Churchill, S. W., 1983. Free Convection around Immersed Bodies. Heat Exchanger Design Handbook, Schlunder, E.U., ed. Hemisphere Publishing, New York.
Clough, W. and Garland, J., 1971. The behaviour in the atmosphere of the aerosol from a sodium fire. J. Nuclear Energy, 25, 425–435.
Colle, S., 2006. Etude thermodynamique et cinétique de l’absorption du dioxyde de soufre dans des solutions d’acide sulfurique de moyennes et fortes concentrations contenant du peroxyde d’hydrogène. Ph.D. thesis (in French), Chapters 5 and 10, Faculté polytechnique de Mons, Belgium. Cooper, D., 1980. Prediction of the rates of chemical transformation of sodium fire aerosols. Proc.
CSNI Specialist Meeting on Nuclear Aerosols in Reactor Safety, Gatlinburg, Tennessee, USA, Avril
1980, 181-195.
Danckwerts, P. V., 1970. Gas-liquid reactions, McGraw-Hill Book Co., New York.
Gilardi, T., Chassery, A., Baskaran, R., Subramanian, V., Latgé, C. and Perrais, C., 2013.Modelling of the chemical behavior of sodium fire aerosols during atmospheric dispersion. Int. Conf. Fast Reactors and Related Fuels, IAEA, March 2013, Paris.
18
Hamer, W. J. and Wu, Y-C., 1972. Osmotic coefficients and mean activity coefficients of uni-univalent electrolytes in water at 25 °C. J. Phys. Chem. Ref. Data, 1, 1047-1099.
Hofmann, C., Jordan, W. and Linder, S., 1979. Chemical reactions of sodium fire aerosols in the free atmosphere. J. Aerosol Sci., 10, 191-192.
Jordan S. and Cherdron, W., 1988. Sodium aerosol behaviour in liquid-metal fast breeder reactor containments. Nucl. Technol., 81, 1983-192.
Lide, D., 1998. CRC Handbook of chemistry and physics, 79th ed CRC Press, New York.
Nijsing, R.A.T.O., Hendriksz, R.H. and Kramers, H., 1959. Absorption of carbon dioxide in jets and falling films of electrolyte solutions, with and without chemical reaction. Chem. Eng. Sci 10, 88–104. Plantamp, A., Gilardi, T., Perrais, C. and Muhr, H., 2014. Studies on the chemical behaviour of sodium fire aerosols during atmospheric dispersion. European Nuclear Conference, ENS, May 2014, Marseille.
Pohorecki, R. and Moniuk, W., 1988. Kinetics of reaction between carbon dioxide and hydroxyl ions in aqueous electrolyte solutions. Chem. Eng. Sci., 43, 1677-1684.
Ramsdale, S., 1989. The chemical conversion and dispersion of toxic sodium fire aerosols in the atmosphere. J. Aerosol Sci., 20, 1401-1404.
Schumpe, A., 1993. The estimation of gas solubilities in salt solutions. Chem. Eng. Sci., 48, 153-158. Subramanian, V., Sahoo, P., Malathi, N., Ananthanarayanan, R., Baskaran, R. and Saha, B., 2009. Studies on chemical speciation of sodium aerosols produces in sodium fire. Nuclear Technology, 165, 257-269.
Twomey, S., 1953. The identification of individual hygroscopic particles in the atmosphere by a phase-transition method. J. Appl. Phys., 24, 1099-1102.