HAL Id: hal-01628395
https://hal.archives-ouvertes.fr/hal-01628395
Submitted on 31 Jan 2019HAL is a multi-disciplinary open access archive for the deposit and dissemination of sci-entific research documents, whether they are pub-lished or not. The documents may come from teaching and research institutions in France or abroad, or from public or private research centers.
L’archive ouverte pluridisciplinaire HAL, est destinée au dépôt et à la diffusion de documents scientifiques de niveau recherche, publiés ou non, émanant des établissements d’enseignement et de recherche français ou étrangers, des laboratoires publics ou privés.
Green autofluorescence, a double edged monitoring tool
for bacterial growth and activity in micro-plates
Irina Mihalcescu, Mathilde Van-Melle Gateau, Bernard Chelli, Corinne Pinel,
Jean-Luc Ravanat
To cite this version:
Irina Mihalcescu, Mathilde Van-Melle Gateau, Bernard Chelli, Corinne Pinel, Jean-Luc Ravanat. Green autofluorescence, a double edged monitoring tool for bacterial growth and activity in micro-plates. Physical Biology, Institute of Physics: Hybrid Open Access, 2015, 12 (6), �10.1088/1478-3975/12/6/066016�. �hal-01628395�
1
Green auto-fluorescence, a double edged monitoring tool for bacterial
growth and activity in micro-plates
Irina Mihalcescu*, Mathilde Van-Melle Gateau*, Bernard Chelli*, Corinne Pinel*
Jean-Luc Ravanat1
*University Grenoble Alpes/ CNRS, LIPhy UMR 5588, Grenoble, F-38041, France
1Univ. Grenoble Alpes, INAC/SCIB/LAN 38000 Grenoble, France & CEA, INAC-SCIB/LAN,
2
ABSTRACT
The intrinsic green autofluorescence of an Escherichia coli culture has long been overlooked and empirically corrected in green fluorescent protein (GFP) reporter experiments. We show here, by using complementary methods of fluorescence analysis and HPLC, that this autofluorescence, principally arise from the secreted flavins in the external media. The cells secrete roughly 10 times more than what they keep inside. We show next that the secreted flavin fluorescence can be used as a complementary method in measuring the cell concentration particularly when the classical method, based on optical density measure, starts to fail. We also demonstrate that the same external flavins limit the dynamical range of GFP quantification and can lead to a false interpretation of lower global dynamic range of expression than what really happens. In the end we evaluate different autofluorescence correction methods to extract the real GFP signal.
3
INTRODUCTION
Fluorescent proteins are an excellent tool for monitoring internal activity in living cells and in the last decade they have been highly diversified and extensively used [1]. For bacteria, fluorescent proteins have been used either in single cell microscopy [2], [3] or in a more extended use in microplate culture monitoring [4], [5], [6]. The former method easily yields quantitative information for a large range of conditions, genes, promoters etc.
To monitor the average dynamic response of a bacterium to an external stimulus, two pieces of information are required: i) the total reporter activity of the population as a function of time, e.g. the total fluorescence of a suspension when a fluorescent protein reporter is used, and ii) the number of cells in the suspension during this time. The first of these requires that the fluorescence of other molecules emitting in the same spectral range as the reporter ones is either negligible or can be robustly evaluated. The second is generally acquired by monitoring the turbidity of the liquid suspension of bacteria and it is based on a bijective relationship between the measured optical density (OD) and the cell density. However this is not always the case: for the same microplate OD measurement, the number of colony forming units (CFU) can change as a function of either physiological (e.g. bacterial type, shape and the nutritional state of the cell) or experimental factors (e.g. cell biofilm formation at the bottom of the microplates). Thus for a dynamical study, the meaning of the OD in terms of CFU will change while the bacterial population gradually goes, for example, from exponential growth to stationary phase [7].
Beside fluorescent proteins, the intrinsic fluorescence of the cells (generally called auto-fluorescence) has also been used, especially in bacteria to monitor aerobic growth in microplates [8]. The main molecular species which could emit in a non-photosynthetic bacterium devoid of exogenous reporters are aromatic amino acids such as tryptophan, tyrosine, phenylalanine with maximum of fluorescence in the ultraviolet, or some co-factors like nicotinamide adenine dinucleotide, NAD or NADH (in blue) and flavins (in green).
In this paper we inquire into a previously unused piece of information: the green auto-fluorescence of a standard bacterial culture in minimal medium. We focus here on Escherichia coli BW25113, a specific K-12 strain commonly used in several systems biology programs [9]. We call it “green” autofluorescence because we use the same combination of excitation/emission filters as for the Green Fluorescent Protein (GFP) reporters (470/525nm). The paper is organized as follows: we first characterize the origin, the dynamics and the distribution (intracellular versus extracellular) of the intrinsic fluorophores. In the second part we establish an empirical method that combines the OD and
4
auto-fluorescence measurement to obtain an extended range of estimated CFU along the growth curve in the microplate. In the third part we measure the effect of the auto-fluorescence background on the quantitative evaluation of a promoter activity and its dynamic range. And in the last part we compare different existent methods of autofluorescence correction to obtain the real GFP reporter signal.
METHODS
Bacterial culture and microplate monitoring.
Escherichia coli BW25113 were inoculated from frozen stock in 5ml minimal media M9 with 0.2%
glucose, at an approximate initial concentration of 5105 cell/ml. Depending on the experiment, after 16-20 hours of vigorous shaking (200rpm) at 37°C in the dark, the main culture was started by diluting the preculture in fresh M9 with 0.2% glucose previously preheated to 37°C. The dilutions ranged between 20 to 3000 times, depending on the experiment. The experiment continued either in the incubator, in a 250 ml flask shaken vigorously at 37°C or in the 96 well plate reader. From time to time samples were collected for direct plating in the 96 well plate or for supernatant extraction. The supernatant was then partly plated for fluorescence measurement and partly frozen for HPLC analysis. After plating in 200µl/well, in a pre-warmed 96 well plate, the optical density at 600 nm (OD) and GFP-like fluorescence were acquired every 8-12 minutes, with the microplate continuously shaken in between, for a 10-24 hour experiment. The microplates used were black with transparent bottom and lid (Thermo scientific Nunc 165305) and the evaporation over a 24 hour experiment was less than 20µl. The microplate reader used was a Tecan Infinite 200MPro. The sequence of the reading protocol was as follows: first 2 minutes linear shaking with 3 mm amplitude and 452.1 rpm frequency, followed by 10 sec pause before OD reading (at 600 nm, 9 nm bandwidth, 25 flashes); then 2 minutes orbital shaking with 3mm amplitude and 218.3 rpm frequency, 10 seconds wait before fluorescence reading. This was done with a gain of 107, excitation wavelength 470 nm and bandwidth 9 nm and detection 525nm (20nm bandwidth), with 25 flashes and 40µs integration time, 0µs lag time and 0µs settle time. For the double wavelength fluorescence reading, another 4 minutes sequence was added to the cycle as follows: 2 min orbital shaking as previous, then 10 seconds wait and the second fluorescence reading with the same number of flashes, lag time and settle time. The 585nm fluorescence had the same excitation and gain but a different detection wavelength 585nm (20nm bandwidth). The red fluorescence reading had been done with a gain of 130, excitation wavelength 575 nm (9nm bandwidth) and detection 650nm (20nm bandwidth). The manual OD control at 600nm was made ordinarily with a bench Eppendorf Biophotometer and consolidated with
5
a Jasco V650 spectrometer. Each manual measurement at OD nominally> 0.3cm-1 was previously diluted to avoid non linearity. Supernatant and riboflavin spectra were compared in situ with the same microplate reader (excitation 446nm and emission 480-850nm) and verified with a Horiba Fluoromax-4 spectrofluorometer.
Strains
We used 3 strains in this work: one is the wild type BW25113. The two other strains are the same BW25113 harboring the chloramphenicol resistant pZA31 plasmid, with the inducible promoter Ptet, controlling a fluorescent protein expression respectively, Ptet : gfpmut2 and Ptet : mcherry.
HPLC Fluorescence.
Detection of riboflavin derivatives was performed by HPLC using an HP1200 series (Agilent technologies, Massy, France) equipped with quaternary pump, auto sampler, oven and fluorescent detector. Separation was performed on a C18 reversed phase (upstiphere C18, 5µ, 250 x 4.6 mm i.d.) (Interchim, Montluçon, France) using a linear gradient starting with 100% of ammonium formate 5 mM and reaching 30% CH3CN in 30min. The column was maintained at 28°C and the flow rate was set at 1 mL/min. Detection was provided by the fluorescent detector set up at 450 nm for excitation and 525 nm for emission. Quantification of riboflavin, FAD and FMN was performed by external calibration (see Supplementary Information).
Microscopy
We use a motorized inverted microscope (Zeiss Axiovert 200M) with a phase contrast objective lens (Zeiss PlanNeofluar, Ph3 100x/1.3), placed in a thermostated box at 37°C. Fluorescence illumination was provided by an mercury lamp (Osram, 1xHBO 103X/2) and visualization was performed with narrow bandpass excitation and emission filters (Chroma, #49002 ET-GFP and Chroma, #49005 TR/DsRED ET). The light source exposure time was externally controlled by mechanical shutters (Uniblitz-VS35). Images were acquired with a 16-bit grays level CCD camera cooled to-80°C (Roper Scientific, Princeton Instruments PHOTOMAX 512) controlled by Winview software (Princeton Instruments).
Data and image analysis
Raw individual well data are first grouped by replica (6 to 20) of one type of experimental condition. Each cluster formed in this way is averaged to extract the mean and its standard error (s.e.m.). The average of a cluster of wells filled only with the medium was used for the background. Microplate measured absorbance, corrected for background, was then converted to optical density (measured in
6
cm-1) by multiplying by 3.4. Image analysis was performed with custom software that allowed to segment cell using the phase contrast image, then to go into the fluorescence files and extract information such as: the total fluorescence/cell and the density of fluorescence per cell defined as the fluorescence/cell/number of pixels detected in the segmented phase contrast image. The number of cells used to obtain an average density of fluorescence is 200-1500, depending on the experiment and sample. Origin (OriginLab) software was used to analyze, merge and plot the data.
Colony forming unit (CFU) counting
Colony forming unit (CFU) counting was performed by collecting 10 µl samples, at different times, from the reference culture in 1ml of M9 media without glucose. Depending of the estimated initial concentration of cells, this was followed immediately by one or 2 serial dilutions with vigorous vortexing in between. The last dilution was done in DM25 supplemented with 1% Tween. The cells were then plated on DM25 agarose plates supplemented with 1% arabinose by a laboratory engineered bacterial plater. We used 15cm diameter plates for improved counting precision going up to 5000 cells/plate. For that a semi-automatic colony counting program was used, in which the red staining of the colony by the arabinose was an important factor in the counting efficiency. Tests were made over all the whole 9 growth curve to ensure that the present counting method does not change the counting result, compared to hand plating on LB plates without the presence of Tween in the preliminary dilution media.
RESULTS
Auto-fluorescence, a “history” effect
We monitored the optical density and the autofluorescence of wild type Escherichia coli BW25113 diluted from a preculture in minimal media (see Methods). Figure 1 shows the OD and the autofluorescence for the same wild type culture in 7 identical wells. Here the preculture was strongly diluted, to an initial OD ≊ 0.001 cm-1. Both curves show an exponential growth with quite similar doubling time of 60 min (orange continuous line). For OD ≥ 0.5 cm-1 the optical density growth slows and begins to saturate while the autofluorescence continues the exponential increase approximately for another 3 hours. Then, both OD and autofluorescence have a sharp break of slope and this is where the stationary phase starts. In this regime, the well-to-well repeatability of autofluorescence is always better than that of OD.
7 0 3 6 9 12 15 18 21 1E-3 0.01 0.1 0.5 1 10 101 102 103 104 Time(hr) OD (cm -1 ) Flu o re sce n ce /we ll (a rb . u n its) 1/2=60min
Figure 1: Optical density (left axis, brown colored lines) and green autofluorescence (right axis, and
blue-green lines) measured for 7 identical wells as a function of time (in hours measured from dilution). The curves are presented raw, with only the background extracted. The mean of these values with standard error of the mean (s.e.m.) as error bars are superimposed. Both Y axes are logarithmic and cover the same relative range (have the same ratio between the maximum/minimum values). The orange continuous line depicts an exponential growth with a 60 min doubling time.
In Figure 2 we show a set of 7 independent experiments with different preculture conditions and initial dilution of the culture (for details see Table S1, Supplementary Information). To be able to compare experiments with a different initial cell concentration we time shift each experiment representation to arrive simultaneously at an OD of 0.05 cm-1 at t = 0 (Figure 2a). From one experiment to another, during the late exponential growth and stationary phase plateau, the average values of replica wells for the OD and autofluorescence are quite reproducible. For the OD, this reproducibility works also at early growth stages, in agreement with the well-known idea that once the lag phase of a culture is completed the culture grows identically provided the external conditions are the same. This is not the case for the initial time dependence of the average autofluorescence. Here, the effects of the preculture “history” and initial dilution last longer (up to 3 hours) and this could be a problem for low activity green fluorescent reporters interpretation.
However, if the time derivative of the autofluorescence is used instead of its absolute value, the experiment to experiment reproducibility is restored. The time derivative grows exponentially with the same slope as the OD, with the advantage of extending the exponential dynamic range by approximately 3 hours, up to the beginning of the stationary phase (supposedly at t ≊ 7hr, Figure 2b and Insert).
8 0 3 6 9 12 15 18 21 0.05 0.1 0.5 1 0 3 6 9 12 15 18 21 102 103 Time (hr) O D ( cm -1 ) Time (hr) a) 0 3 6 0.06 0.6 60 600 Time (hr) b) A utof luor es cen ce (a rb unit s) Time derivatives
Figure 2: Autofluorescence is dependent of the preculture conditions and initial dilution of the
culture. a) Average OD (red curves) and b) average autofluorescence (cyan curves) for a set of 7 different experiments where either the initial dilution or the preculture conditions are changed (Table S1). Green and blue stars represent independent manual measurements of OD with a spectrometer for 2 experiments. Insert: the time derivatives of respectively OD (left axis, red curves, expressed in cm-1 ⋅hr-1) and fluorescence (right axis, cyan curves expressed in hr-1) for the same experiments. Orange lines depict an exponential growth with a 60 min doubling time. Error bars are s.e.m.
Supernatant versus internal autofluorescence
We next inquired into the origin of the green autofluorescence and its distribution comparing extracellular versus intracellular. During the exponential growth and early stationary phase of a
100ml flask culture, we collected 4ml samples at 4-8 different time points (depending on the
experiment, see Methods). At each time point, a part of that sample was passed through a 0.2µm filter to extract the supernatant. Each time-point sample (culture and supernatant) was sequentially added to 6-10 replica wells in the same 96 well plate, in their respective empty locations. The autofluorescence and OD of the microplate were continuously monitored. The superposition of average autofluorescence curves, for the various time-point derived cultures shows that growth in the flask culture and in the 96 well plate proceed in the same way (Figure 3a).
9 0 3 6 9 12 15 18 21 102 103 104
Aut
of
luorescence
(ar
b
uni
ts)
Time(hr)
a)
0.0 0.1 0.2 0.3 0.4 0.1 0.5 1 1 10 100 F ba ct / F sup b)c)
External/Internal rate of fluorescence prod uctionOD (cm
-1)
Figure 3: Supernatant versus internal autofluorescence a) Autofluorescence of a culture (cyan
curves) and its supernatant (red curves) extracted at different time points from a flask culture, then plated and monitored. Data are averages of 4-8 replicas and error bars are the s.e.m. The exact time point where the culture and its supernatant were collected and plated are indicated by black arrows. The orange line gives an exponential growth with a doubling time of 60min. b) The ratio of the bacterial fluorescence and the supernatant versus the OD of the culture measured in 4 independent experiments, similar to that shown in a) (solid symbols) and 2 others (open symbols) measured by dilution to a constant OD (see main text). The OD is represented in a log scale. c) The ratio of the rate of production of the supernatant fluorescence and that of the internal fluorescence. Same experiments and representation as in b).
The supernatant fluorescence is stable in time and is not bleached by repetitive readings or biochemical degradation. For each new sample added to the plate, we obtain at the corresponding time point (arrows in Figure 3a) a comparison between the total and the supernatant autofluorescence. To our surprise, the supernatant and the total autofluorescence are almost equal and, paradoxically, for the last 2 time points, they have a larger value: with increasing bacterial density, light scattering becomes important and consequently, the excitation and the detection of the emitted fluorescence are affected too. As the supernatant is free of scattering particles (bacteria), its fluorescence is not affected by scattering.
Light scattering correction can be made [10], [11] but in a well determined and generally simple optical configuration. However as the geometry of the emission and detection light path inside our microplate reader is not simple and not known in detail, we repeated the same experiments in a
10
slightly different configuration: the samples from the culture flask were first diluted to a lower cell density, then plated (see Supplementary information, Figure S1). By taking into account the dilution, we reconstructed the autofluorescence curve F(t) of the culture corrected for scattering (see Supplementary information, Figure S1). Note that this correction extends the range of analysis to the early stationary phase and only slightly affects the results in the exponential growth regime.
Figure 3b, gives the ratio between the bacterial autofluorescence Fbact and the supernatant Fsup, with
sup
F F
Fbact . The X axis of the figure is the OD, the common parameter describing the variation of the ratio of intracellular to extracellular fluorescence in 6 independent experiments. The bacterial green autofluorescence is at most 10% of that of the supernatant throughout the exponential growth phase (i.e. OD ≲ 0.5 cm-1). Close to the stationary phase, the relative preponderance of the internal autofluorescence increases slightly to 25%, before decreasing later in the stationary phase.
Origin of supernatant green autofluorescence.
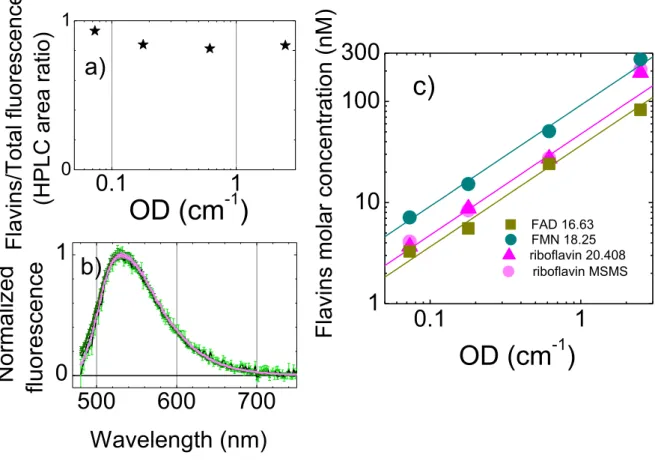
We next analyzed the origin of this supernatant autofluorescence by fluorescence HPLC. We identified flavins (FMN, FAD and riboflavin) as responsible for more than 80% of the fluorescence at wavelength 525nm (Figure 4a, Supplementary Informations Fig.S2). The riboflavin molar concentration was confirmed by Mass Spectrometry (Supplementary information). Note that with HPLC we mainly identified free flavin molecules. However, a large part of the remaining 20% of fluorescent molecules may be attributed to other flavin derivatives. Indeed, the shapes of the fluorescent spectra for the supernatant and riboflavin normalized by their 525nm maximum are indistinguishable (Figure 4b). This also confirms the hypothesis of a large predominance of flavin compounds in the supernatant fluorescence. The largest molar concentration in the supernatant is FMN, followed by riboflavin and FAD with about half that concentration (Figure 4c). The molar concentrations in the supernatant are approximately a linear function of OD. For example the lines in Figure 4c exhibit the following linear dependence: 𝑐𝐹𝑀𝑁 = 92nM ∙ cm, 𝑐𝑟𝑖𝑏𝑜 = 47nM ∙ cm and 𝑐𝐹𝐴𝐷= 36nM ∙ cm.
11
0.1
1
0 10.1
1
1
10
100
300
500
600
700
0
1
OD (cm
-1)
Flav
ins
/Total
fluor
esc
en
ce
(
H
P
LC
ar
ea
r
atio)
a)
c)
OD (cm
-1)
F
lav
ins
mol
ar c
onc
entrati
on (nM)
riboflavin MSMS riboflavin 20.408 FAD 16.63 FMN 18.25b)
Wavelength (nm)
Normalized
flu
o
resce
n
ce
Figure 4: Flavins at the origin of supernatant green autofluorescence a) The proportion of the
identified flavins in the supernatant with respect to the total fluorescence of the HPLC run. The supernatant was collected at 4 different time points, and the corresponding optical density (OD) of the bacterial culture at that time is the X axis. b) Normalized fluorescence spectra of the same 4 time point supernatants (different green shade curves) compared to that of riboflavin (pink curve), excitation 450nm. c) Molar concentration of specific flavins identified in the supernatant of the same 4 time points as a function of OD : flavin mononucleotide – FMN cyan circles, FAD – Flavin adenin dinucleotide, brown squares, R – riboflavin, pink triangles. Gray circles are the corresponding measurements of riboflavin concentration by mass spectrometry. Both X and Y axes are logarithmic. The continuous straight lines have a slope 1 and display a linear dependence on the OD.
Quantitative description of autofluorescence dynamics
As previously noted the autofluorescence F(t) is the sum of two components, both of which are time dependent: the internal Fbact(t) and the supernatant Fsup(t) autofluorescence. The internal
autofluorescence is proportional to the total volume of bacterial cells V(t): Fbact(t) f V(t) with f
the internal density of autofluorescence per unit of volume. In the exponential regime, the total volume of cells grows as V(t)Viniexp(kt), where k is the growth rate experimentally determined
as
dt dOD OD
12
From a dynamical point of view, the supernatant autofluorescence, Fsup(t), has 2 contributions:
) ( )
( sup sec sup t F 0 F t
F . The first Fsup0, is what has already accumulated in the supernatant before
starting the experiment and depends on the “history of the culture” (like the preculture conditions and folds of the initial culture dilution).
0
sup
F can only decrease as a function of time with a degradation rate γflavin. The second contribution Fsec(t) depends on what the cells secrete from the
time where the measurement starts. Its time variation is a balance between the production and degradation: sec( ) V(t) Fsec(t)
dt t dF flavin
, where β is the flavin secretion rate.
The measurements presented in Figure 2a show a supernatant fluorescence that is impressively stable, with a degradation rate γflavin ≲ 0.01hr-1, much smaller than other dynamical parameters such
as the growth rate k ≊ 0.7 hr-1. This allows us to neglect the flavins degradation term flavinFsup(t), which means the flavins fluorescence will continuously accumulate in the supernatant with negligible degradation. It means also that the “historical” component Fsup0 remains constant all along
the exponential growth regime. One can therefore write: sup( ) V(t)
dt t dF
. Once the exponential growth regime starts, one can expect that internal parameters, such as the internal density of fluorescence f, the rate of flavin secretion β or the growth rate of the culture k, are constant in time. With these assumptions ( ) fk V(t)
dt t dFbact
and the time derivative of the total autofluorescence will be proportional to the total volume of the cells: ( )
fk
V(t)dt t dF
. This is why the time derivative of the fluorescence grows exponentially, like the time derivative of OD (Figure 2b insert). Furthermore, the time derivative is independent of the preculture history or dilution, as the term that carries this information, Fsup0, is eliminated in the derivative.
The total value of autofluorescence, ( ) ( / ) ( )
0
sup f k V t
F t
F , at the beginning is indeed strongly dependent on
0
sup
F (as shown in Figure 1b). As time passes, the influence of
0
sup
F will be overcome by the second term which contains the exponential increase of both the bacterial and supernatant autofluorescence. In the end, the total autofluorescence will also be proportional to the total volume of cells.
13
From experimental data we can measure directly the ratio of the extracellular to the intracellular rate of fluorescence production (see Figure3c):
1 ) ( ) ( 1 1 sup i i t t dt F t F t dF k fk i i
This can be evaluated only at the time point ti where Fsup is measured independently of F. One finds
that, a wild type bacterial cell in exponential growth secretes roughly 10 times more flavin molecules per unit of time, than it keeps inside. This value is consistent with the ratio Fbact∕Fsup = 10% found
during the early exponential growth. Moreover, this ratio is also the same for the early stationary phase.
Autofluorescence time derivative and bacterial concentration CFU/ml
In a complementary experiment, we monitored for different inoculation levels, the concentration of bacterial cells (counted as colony forming units), the autofluorescence and OD (Methods). Figure 5 shows a linear relationship between the time derivative of autofluorescence dF∕dt and the bacterial cell concentration, over the whole range of the exponential growth. Compared to the OD, the validity of this linear relation is extended by approximately 3 hours. In the exponential phase this linearity is quite obvious: the rate of flavin secretion and internal growth rates are constant. Consequently the flavin fluorescence (internal or external) grows linearly with the number of cells. In late exponential phase and close to stationary phase, the culture detected autofluorescence increases faster than the microplate measured OD. One possibility is that in this regime both secretion and internal autofluorescence growth rate are increasing temporarily to compensate the scattering losses.
The green autofluorescence can therefore be used to obtain an in situ evaluation of the CFU count independently of the OD. However, for bacterial cell concentrations lower than ≈ 108CFU∕ml the
time derivative of autofluorescence is quite noisy. Therefore if both OD and autofluorescence can be monitored, the 2 measurements can be combined to overcome the non-linearity effects of OD measurement in late exponential growth phase: for OD ≤ 0.5cm-1 we take the usual linear relation between CFU and OD, CFU(t) = c1⋅OD(t) and for OD > 0.5cm-1, we will take CFU(t) = c2⋅dF∕dt
with 5 . 0 2 1 2 OD dt dF c
c . The last term
5 . 0 OD dt
dF represents the time derivative of the
autofluorescence measure at the OD = 0.5cm-1. Note that this method can be used either in bacterial population lacking any reporter or in reporter gene experiments for which the reporter doesn’t emit in green like flavins.
14 0 3 6 9 12 0.01 0.1 1 10 60 600 6000 107 108 109 Time (hr) O D( cm -1 ) A uto fluo res cen ce d erivati ve (c ts /hr -1 ) CFU /ml
Figure 5: The time derivative of the autofluorescence is proportional to the CFU count CFU per ml
(left axis), OD and time derivative of the autofluorescence (right axis) for 3 experiments started at different initial bacterial concentration: 108 cell/ml (black and gray), 5⋅107 cell/ml (red and orange) and 5⋅106 cell/ml (light and dark green). Circles are the CFU/ml from samples taken from either flask culture (black, red and dark green) or microplate wells (gray, orange and light green). Black, red and dark green triangles are the time derivative of the autofluorescence and the gray, orange and light green squares are their corresponding OD. All Y axes are logarithmic and cover the same relative range. Error bars are s.e.m.
Autofluorescence effect on green fluorescent reporter evaluation
The flavin fluorescence investigated so far can have serious consequences for data interpretation where the GFP reporter gene is used to monitor dynamical parameters: the GFP and the flavin fluorescence are both collected, without distinction, by the same set of GFP specific filters. We performed here a typical induction experiment to highlight the amplitude of this problem.
We used a well-known inducible reporter system Ptet : gfpmut2 carried on a pZA plasmid. All strains have not only the same growth characteristics but also the same preculture “history”. Moreover, as a control experiment we used an identical strain but with a red fluorescent reporter protein mCherry, Ptet : mcherry. The cultures were induced very early in the exponential growth phase, monitored continuously in a microplate reader and also sampled for microscopy in early stationary phase (18-22 hours after induction, depending on the specific sample). The amplitude of the fluorescence induction as a function of the inducer concentration was then measured.
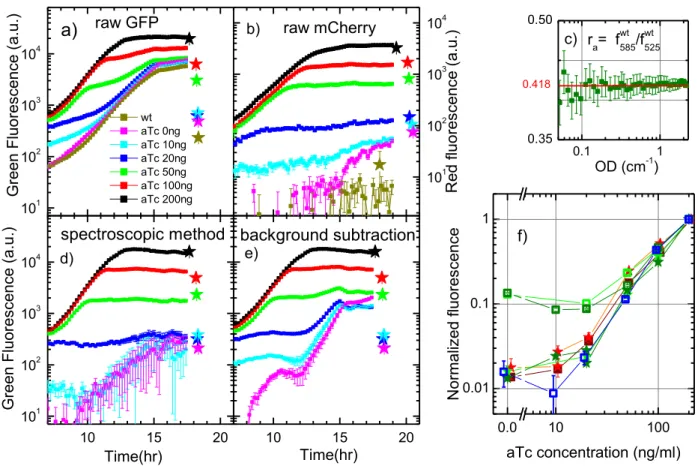
For different inducer concentration (in ng/ml from 200, 100, 50, 20, 10 down to 0), Figure 6 shows the time change of the raw average green fluorescence per well for the GFP reporter strain (Figure
15
6a) and red fluorescence for mCherry strain (Figure 6b). Note that the curves were slightly time shifted to have a synchronized growth (see Supplementary Informations, Figure S3).
By changing the inducer concentration (anhydrotetracycline -aTc) the average density of fluorescence per bacterium measured by fluorescence microscopy, in either red or green, varied by almost 2 orders of magnitude (stars) in Figure 6 a,b. This happens also for the average fluorescence/well measured in microplate for the red fluorescence reporter as the plateau reached after induction varies also over the same order of magnitude (Figure 6b). However, the GFP reporter strain in microplate showed a much weaker dependence of the inducer of about 3 times (Figure 6a). The reason of this discrepancy is the autofluorescence. The wild type fluorescence in the red spectral range is negligible compared to the lowest value of non-induced fluorescence. This is to be expected, as it is known that in this spectral range (excitation 575nm/detection 650nm) the media as well as the bacterial internal autofluorescence are negligible. For the green fluorescence, this is of course different since the flavin fluorescence is stronger than the GFP fluorescence when non-induced. And in a well, where the supernatant fluorescence of flavins adds to the internal bacterial cell autofluorescence, the background is much larger than the non-induced strain. This strong background limits the detectable range of GFP fluorescence variations, in a similar manner as trying to catch a firefly flickering in too bright a room.
Correction of green fluorescence curves in a GFP reporter experiment
An important step is therefore the correction of the fluorescence curves to extract the real GFP fluorescence. The green autofluorescence background has been over the years a concern in quantitative reporter gene studies and scientists have implemented different methods to circumvent this problem. One idea [6], [12] is to synchronize the growth of the strain of interest with that exempt of reporter and then extract the corresponding background: Freporter(t,aTc) Ftotal(t,aTc)Fwt(t), with Ftotal(t,aTc) the total reporter fluorescence/well at a time t and inducer concentration aTc and Fwt(t) the autofluorescence of the wild type culture at the same time.
A more recent method [13] discriminates the flavin autofluorescence from the GFP directly on the strain of interest by using the spectral differences between the two fluorophores. Although this method has been proposed in yeast studies, we tested it on our E.coli strain BW25113. The basis of this method is to excite the fluorescence at a given wavelength (in our case 470nm) and measure its emission at two different wavelengths (here 525nm and 585nm). As the flavin and GFP quantum yields are different between the 2 detection wavelengths, this enables us to separate the two different contributions. For a wild type strain a ratio of autofluorescence at 585nm to that at 525nm can be
16 defined: wt wt
a f f
r 585/ 525. To be able to discriminate between the two emissions, this ratio should be
independent of the growth stage of the wild type culture, which indeed is the case (Figure 6c). We approximate ra 0.418 which is valid for an OD interval of 0.1cm-1 to 3cm-1. The value of
02 . 0 415 . 0 a
r is also obtained from the ratio of the fluorescence spectra of the riboflavin standard, integrated respectively between 576-594nm and 516-534nm. These intervals correspond to the 20nm bandwidth of the detection monochromator inside the microplate reader, around the detection wavelengths 525nm and 585nm.
To obtain the signal of interest g, i.e. the GFP reporter only, for any given strain the following relationship can be applied:
g a a r r f f r g 525 585
with f525 and f585 respectively the detected total fluorescence at 525nm and 585nm. The value of rg =
0.118 is the ratio of our GFPmut2 emission at 585nm to that at 525nm, with their respective 20nm bandwidth [14].
Figure 6d shows the GFP fluorescence (g) obtained using this method while Figure 6e shows the GFP fluorescence obtained by first growth synchronization of curves, then wild type autofluorescence extraction from the total fluorescence curves. Note that we have been able to compare the two methods safely, as the preculture history effect was made negligible by strong dilution of the culture. It can be observed that at high level of induction both methods are valid and almost indistinguishable. At a lower level of induction, the comparison with mCherry reporter strain and also the average level of fluorescence/cell measured by single cell microscopy shows that the spectroscopic method performs a better correction of the autofluorescence.
For samples with slightly different growth speeds, or levels of flavin secretion the spectroscopic method is superior to background autofluorescence extraction. This comes of course from the knowledge of flavin as the autofluorescence source and an independent complementary measurement at a different wavelength, which allows uncorrelating flavin and GFP fluorescence. However in wider context, for different bacterial strains or complex culture media, when the flavin might not be the main source of autofluorescence, without a detailed knowledge of the autofluorescence sources, the empirical method of the background subtraction, even with its flaws, becomes again the only available method.
17 101 102 103 104 10 15 20 10 15 20 101 102 103 104 101 102 103 104 0.1 1 0.35 0.50 0.0 10 100 0.01 0.1 1 Gr ee n Fluor es cen ce (a. u. ) wt aTc 0ng aTc 10ng aTc 20ng aTc 50ng aTc 100ng aTc 200ng a) raw GFP background subtraction e) Time(hr) spectroscopic method Gr ee n Fluor es cen ce (a. u. ) d) Time(hr) b) R ed fluo res cen ce (a. u. ) raw mCherry c) ra= fwt585/fwt525 OD (cm-1) 0.418 aTc concentration (ng/ml) f) N or maliz ed fluo res cen ce
Figure 6: Effect of green autofluorescence on reporter experiments. An aTc inducible reporter strain
measured either by microtiter reader as a function of time (squares) or by single cell microscopy (stars) at a given time point. a) Raw green fluorescence of a GFP and b) raw red fluorescence of a mCherry reporter strain measured for different levels of inductor concentration 200ng/ml, 100ng/ml, 50ng/ml, 20ng/ml, 10ng/ml, 0ng/ml and the wild type strain, respectively, black, red, green, blue, cyan, magenta and dark yellow squares (see legend). The corresponding average density of fluorescence per cell is represented by the equivalent colored stars plotted at the equivalent time point where the measure has been made. Note that XY axes are linked to represent the same time window and fluorescence range of variation. c) Ratio of the wild type autofluorescence detected at 585nm over the one detected at 525nm as a function of the optical density of the culture. The value underlined in red is the one we used ra = 0.418. Corrected GFP fluorescence deduced using the spectroscopic method (d) and background subtraction method (e) for microtiter reader experiments. The colored stars represent the average density of fluorescence/cell with the value of wild type autofluorescence extracted. Same color code as in a). f) Comparison at a given time point (18 hours for the microtiter measurements) between different fluorescences as a function of the induction level. The average green fluorescence/well (green squares), average red fluorescence/well (dark red squares) are corrected for the autofluorescence and normalized by their respective value at the highest inducer level (200ng/ml). The density of fluorescence/cell (measured by single cell microscopy) is represented by the green and red stars, respectively for the green and red fluorescent reporters at the same values and time. All values were normalized by the value at the highest inducer level. The two shades of green (dark and light), for single cell and microtiter measurements represent replica experiments for the GFP reporter. The blue square dots represent the same measures as the dark green squares but uncorrelated from the flavin fluorescence by the spectroscopic method. Error bars are s.e.m.
18
DISCUSSION
Flavin fluorescence has been studied over the last 65 years [15]. Their contribution to eukaryotic cellular autofluorescence started long ago to be addressed [16] and different methods to separate their fluorescence from exogenous GFP reporters are currently explored [17], [13]. In prokaryotes the focus has been mainly on internal flavin driven autofluorescence, for example for bacterial cell counting with microfluidic diagnostic devices [18] or for autofluorescence quantification with dedicated flow-cytometers [19].
Here we have identified flavins as the preponderant emitters of green autofluorescence in the supernatant of a culture of wild-type E.coli strain BW25113, a strain used in many system biology programs [9]. By using different complementary methods, in-vivo autofluorescence and OD measurements, CFU counting and HPLC analysis of supernatant, we show that for this specific strain, the rates of flavin secretion are much higher than the internal growth rate. We monitored this phenomenon for different growth stages (early and late exponential growth, beginning of stationary phase). Our results are in agreement with previous studies [20], [21] which has also shown that
E.coli and Pseudomonas fluorescens constitutively synthesize riboflavin, most of which indeed
appears be secreted. The external concentrations of flavins that accumulate in the media have been evaluated in other studies [21], [22] in different strains and/or growth conditions. Our results show a similar extracellular flavin concentration (see Supplementary information).
Flavins are essential components of cellular biochemistry in all prokaryotic and eukaryotic cells. Riboflavin (vitamin B2) is the precursor of FMN and FAD and is produced by all plants and most
micro-organisms. Animals and some rare prokaryotic and eukaryotic micro-organisms cannot synthesize riboflavin and need to obtain it from their diet [23]. Escherichia coli is among the riboflavin producer organisms that cannot import exogenous flavins [24]. Although the genetic and synthesis pathways of riboflavin are now well known, the secretion mechanism is not yet well explored.
Escherichia coli, like many other bacteria and microorganisms, produces and exports flavins at rates
that can be as large as 10 times their own growth rate, as in the present report. The purpose of flavin export to the media is yet unknown. An early suggestion [20] (1962) was that the cells do not know how to do better: the control mechanisms are too weak to prevent flavin of being produced. A more recent hypothesis is that it participates in the mobilization of practically insoluble Fe3+ by its reduction to Fe2+ form [25]. Finally, one can also speculate that the excess of flavin production and secretion plays a role in the interaction with higher organisms, as gut microbiota emerges as a factor with a strong impact on host metabolism [26].
19
Flavin export, regardless of its purpose, is a hindrance to dynamical gene reporter studies and its influence on the data interpretation has to be taken into account. By comparing the fluorescence level of an inducible strain carrying either a GFP reporter or a red fluorescent reporter mCherry we have shown that the green autofluorescence indeed complicate the interpretation of reporter experiment data. Figure 6f summarizes this by taking for each induction curve the value at t 18hrs (early stationary phase) and plotting it as a function of the induction level. One can see that microscopy measurements (red and green stars), as well red fluorescence microtiter measurements (brown squares) are not affected by the background extraction, all showing the same variation with the level of induction over roughly 2 orders of magnitude. The green fluorescence microtiter experiments are strongly affected and dependent on how the autofluorescence is uncorrelated from the GFP signal. The background extraction methods appears here as limiting the apparent dynamic range to only one decade (green squares), while the spectroscopic method (blue squares) restores the expected signal. Having solved the uncorrelation of GFP from the flavin fluorescence however doesn’t completely solve all the problems. Too large a dynamic range cannot be followed in a 96 well plate because the supernatant fluorescence (even uncorrelated from that of the GFP) will mask and give unreliable values at low GFP fluorescence. The best methods to avoid this hindrance are either to use a different reporter, such as mCherry, that emits far from flavins, or else to resort to single cell studies where the sensibility threshold is 10 times lower [27].
CONCLUSIONS
Green autofluorescence has always been a hindrance for scientists monitoring GFP like activity in a culture. In this paper we inquired into the precise origin of this autofluorescence and showed that this is due mainly to secreted flavins. The secretion rate largely surpasses the internal rate of flavin building during the exponential growth regime as well as during the early stationary phase. This strong secretion appears to be a double edged sword. We show on one hand that it can be directly used to follow the CFU count in a well, by taking the time derivative of the green fluorescence of the strain exempt of external reporter. On the other hand, we also show that the same external flavins limit the dynamical range of green reporter quantification and suggest that great care should be taken with the autofluorescence background correction methods.
Competing interests
The authors declare that they have no competing interests.
20
IM, MVG, BC and JLR designed and made the experiments; CP made the strains; IM, MVG and JLR analyzed the data, IM wrote the paper.
Acknowledgments
We thank B. Houchmandzadeh, J.Geiselmann, E. Geissler, V.Zulkower and S.Lacour for discussions and for comments on the manuscript. This work has been supported by the Investissements d’Avenir Bio-informatique program, project RESET (ANR-11-BINF-0005, https://project.inria.fr/reset/)
21
Bibliography
[1] D. M. Chudakov, M. V. Matz, S. Lukyanov et K. A. Lukyanov, «Fluorescent proteins and their applications in imaging living cells and tissues.,» Physiol Rev, vol. 90, n° %13, pp. 1103-1163, Jul 2010.
[2] J. C. W. Locke et M. B. Elowitz, «Using movies to analyse gene circuit dynamics in single cells.,» Nat Rev Microbiol, vol. 7, n° %15, pp. 383-392, May 2009.
[3] G.-W. Li et X. S. Xie, «Central dogma at the single-molecule level in living cells.,» Nature, vol. 475, n° %17356, pp. 308-315, Jul 2011.
[4] S. Kalir, J. McClure, K. Pabbaraju, C. Southward, M. Ronen, S. Leibler, M. G. Surette et U. Alon, «Ordering genes in a flagella pathway by analysis of expression kinetics from living bacteria.,» Science, vol. 292, n° %15524, pp. 2080-2083, Jun 2001.
[5] H. de Jong, C. Ranquet, D. Ropers, C. Pinel et J. Geiselmann, «Experimental and computational validation of models of fluorescent and luminescent reporter genes in bacteria.,» BMC Syst Biol, vol. 4, p. 55, 2010.
[6] S. Berthoumieux, H. de Jong, G. Baptist, C. Pinel, C. Ranquet, D. Ropers et J. Geiselmann, «Shared control of gene expression in bacteria by transcription factors and global physiology of the cell.,» Mol Syst Biol, vol. 9, p. 634, 2013.
[7] B. Volkmer et M. Heinemann, «Condition-dependent cell volume and concentration of
Escherichia coli to facilitate data conversion for systems biology modeling.,» PLoS One, vol. 6, n° %17, p. e23126, 2011.
[8] H. F. Zimmermann, H. Trauthwein, U. Dingerdissen, M. Rieping et K. Huthmacher,
«Monitoring aerobic Escherichia coli growth in shaken microplates by measurement of culture fluorescence.,» Biotechniques, vol. 36, n° %14, pp. 580--2, 584, Apr 2004.
[9] T. Baba, T. Ara, M. Hasegawa, Y. Takai, Y. Okumura, M. Baba, K. A. Datsenko, M. Tomita, B. L. Wanner et H. Mori, «Construction of Escherichia coli K-12 in-frame, single-gene knockout mutants: the Keio collection.,» Mol Syst Biol, vol. 2, p. 2006.0008, 2006.
[10] J. Wu, M. S. Feld et R. P. Rava, «Analytical model for extracting intrinsic fluorescence in turbid media.,» Appl Opt, vol. 32, n° %119, pp. 3585-3595, Jul 1993.
[11] Y. Chen, Z.-P. Chen, J. Yang, J.-W. Jin, J. Zhang et R.-Q. Yu, «Quantitative fluorescence spectroscopy in turbid media: a practical solution to the problem of scattering and absorption.,»
Anal Chem, vol. 85, n° %14, pp. 2015-2020, Feb 2013.
[12] A. Zaslaver, A. Bren, M. Ronen, S. Itzkovitz, I. Kikoin, S. Shavit, W. Liebermeister, M. G. Surette et U. Alon, «A comprehensive library of fluorescent transcriptional reporters for Escherichia coli.,» Nat Methods, vol. 3, n° %18, pp. 623-628, Aug 2006.
[13] C. A. Lichten, R. White, I. B. N. Clark et P. S. Swain, «Unmixing of fluorescence spectra to resolve quantitative time-series measurements of gene expression in plate readers.,» BMC
Biotechnol, vol. 14, p. 11, 2014.
[14] B. P. Cormack, R. H. Valdivia et S. Falkow, «FACS-optimized mutants of the green fluorescent protein (GFP).,» Gene, vol. 173, n° %11 Spec No, pp. 33-38, 1996.
[15] G. WEBER, «Fluorescence of riboflavin and flavin-adenine dinucleotide.,» Biochem J, vol. 47, n° %11, pp. 114-121, 1950.
[16] R. C. Benson, R. A. Meyer, M. E. Zaruba et G. M. McKhann, «Cellular autofluorescence--is it due to flavins?,» J Histochem Cytochem, vol. 27, n° %11, pp. 44-48, Jan 1979.
[17] N. Billinton et A. W. Knight, «Seeing the wood through the trees: a review of techniques for distinguishing green fluorescent protein from endogenous autofluorescence.,» Anal Biochem,
22 vol. 291, n° %12, pp. 175-197, Apr 2001.
[18] N. Bao, B. Jagadeesan, A. K. Bhunia, Y. Yao et C. Lu, «Quantification of bacterial cells based on autofluorescence on a microfluidic platform.,» J Chromatogr A, vol. 1181, n° %11-2, pp. 153-158, Feb 2008.
[19] L. Yang, Y. Zhou, S. Zhu, T. Huang, L. Wu et X. Yan, «Detection and quantification of bacterial autofluorescence at the single-cell level by a laboratory-built high-sensitivity flow cytometer.,» Anal Chem, vol. 84, n° %13, pp. 1526-1532, Feb 2012.
[20] A. C. WILSON et A. B. PARDEE, «Regulation of flavin synthesis by Escherichia coli.,» J Gen
Microbiol, vol. 28, pp. 283-303, Jun 1962.
[21] M. J. McAnulty et T. K. Wood, «YeeO from Escherichia coli exports flavins.,» Bioengineered, vol. 5, n° %16, pp. 386-392, 2014.
[22] H. von Canstein, J. Ogawa, S. Shimizu et J. R. Lloyd, «Secretion of flavins by Shewanella species and their role in extracellular electron transfer.,» Appl Environ Microbiol, vol. 74, n° %13, pp. 615-623, Feb 2008.
[23] C. A. Abbas et A. A. Sibirny, «Genetic control of biosynthesis and transport of riboflavin and flavin nucleotides and construction of robust biotechnological producers.,» Microbiol Mol Biol
Rev, vol. 75, n° %12, pp. 321-360, Jun 2011.
[24] C. Vogl, S. Grill, O. Schilling, J. St{\"{u}}lke, M. Mack et J. Stolz, «Characterization of riboflavin (vitamin B2) transport proteins from Bacillus subtilis and Corynebacterium glutamicum.,» J Bacteriol, vol. 189, n° %120, pp. 7367-7375, Oct 2007.
[25] E. Marsili, D. B. Baron, I. D. Shikhare, D. Coursolle, J. A. Gralnick et D. R. Bond, «Shewanella secretes flavins that mediate extracellular electron transfer.,» Proc Natl Acad Sci U S A, vol. 105, n° %110, pp. 3968-3973, Mar 2008.
[26] M. T. Khan, M. Nieuwdorp et F. B{\"{a}}ckhed, «Microbial Modulation of Insulin Sensitivity.,» Cell Metab, Aug 2014.
[27] L. Cai, N. Friedman et X. S. Xie, «Stochastic protein expression in individual cells at the single molecule level.,» Nature, vol. 440, n° %17082, pp. 358-362, Mar 2006.
[28] D. P. Bremer H, Modulation of chemical composition and other parameters of the cell by growth rate, in Escherichia coli and Salmonella,, N. FC, Éd., ASM Press; Washington D.C., 1996.
1
Supplementary Information
Details of different preculture conditions and culture initial dilutions
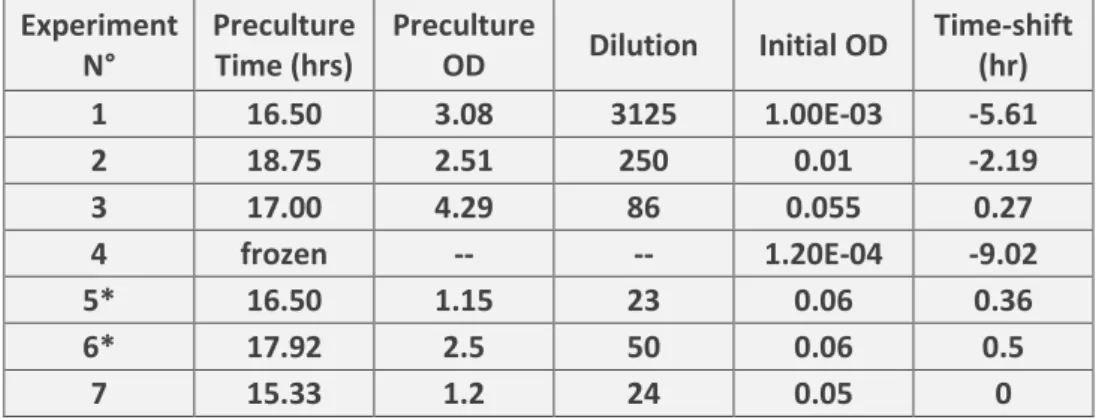
Experiment N° Preculture Time (hrs) Preculture OD Dilution Initial OD Time-shift (hr) 1 16.50 3.08 3125 1.00E-03 -5.61 2 18.75 2.51 250 0.01 -2.19 3 17.00 4.29 86 0.055 0.27 4 frozen -- -- 1.20E-04 -9.02 5* 16.50 1.15 23 0.06 0.36 6* 17.92 2.5 50 0.06 0.5 7 15.33 1.2 24 0.05 0
Table S1 shows the preculture duration (in hours), the final OD of the preculture before dilution, the
dilution factor and the measured or estimated (depending on the experiment) initial OD of the monitored culture. The time scale of each individual experiment was time-shifted to yield an OD of
0.05cm-1 at the same time in order to compare them easily. The direct amount in hours of the
time-shift for each experiment is listed in the last column. Starred experiments are those where we accompanied the OD monitoring by manually sampling and measuring the OD with an independent spectrometer.
Scattering correction for the autofluorescence at high OD
As explained in the main text, we performed 2 kinds of experiments. In the first, standard procedure, a culture of wild-type cells was monitored for OD and green fluorescence while growing in a 96 well plate. The second type of experiments was done to measure the green autofluorescence in the absence of scattering effects: while a culture of bacteria was growing in a flask in the incubator we successively sampled at different time points, measured the sample OD, diluted it to an OD close to 0.1cm-1, verified the OD after dilution then plated and measured the sample fluorescence and OD in the 96 well plate reader. We chose an OD of 0.1cm-1, which is sufficiently low to have negligible scattering effect on fluorescence, but higher than the instrumental limit of confidence. Figure S1a shows a comparison between two standard experiments started at different initial cell concentrations. The experiments that started at higher cell concentration were carried out in parallel with 7 measurements of fluorescence after dilution to OD = 0.1cm-1 as previously explained. After the OD and fluorescence measurements of these samples, the values obtained were multiplied by the dilution factor and thereby corrected for the scattering and non-linear effects. These values were used to obtain an empirical correction law for the fluorescence: F = Frawexp[ODraw∕8], where subscript raw
2
meaningful value of autofluorescence at high cell concentration, is valid only for this particular experimental set up. It can also be seen that the same correction is indistinguishable for low cell concentrations. With this correction in Figure S1b, the anomalous tendency of having a total fluorescence lower that the supernatant fluorescence at high cell concentration is accounted for. The final result is that over all the growth curve, from low to high cell concentration, the (corrected) total fluorescence value (blue circles) is only slightly higher than the extracted supernatant (green triangles). 0 2 4 6 8 10 102 103 104 0.1 1 10 Fluo res cence/wel l Time(hr) a) O D (cm -1 ) 0 2 4 6 8 10 102 103 104 b) Fluo res cence/wel l Time(hr)
Figure S1. a) Comparison of two experiments in the microplate reader: experiment A starts at OD =
0.05cm-1 (orange and gray filled circles) and experiment B at an OD 12 times larger (red and black
filled circles). Left scale fluorescence/well (gray and black filled circles) and right OD orange and respectively red filled circles. For clarity, the time scale of the second experiment is shifted by 236 minutes to compare the growth curves of the experiments. In parallel with experiment B we have also
made seven measurements after dilution to OD = 0.1cm-1. The OD and fluorescence corrected for
the scattering are plotted respectively in open red squares and black circles. b) At some points of experiment A, the raw total fluorescence (gray solid squares), the supernatant fluorescence (green open triangles) was measured. The corrected total fluorescence (blue open circles) and the measured corrected fluorescence in experiment B (open black circles) are superimposed for comparison.
3 HPLC fluorescence 0 2 4 6 0.1 1 10 16.63 18.25 20.4 21.4 Time (hr) HPL C fl uores cence area a) 16.63 FAD 18.25 FMN 20.4 Riboflavin 21.4 FMN-Riboflavin unidentified growing unidentified constant Elution time (min) riboflavin (100nM) FAD (100nM) FMN (100nM) External standards b)
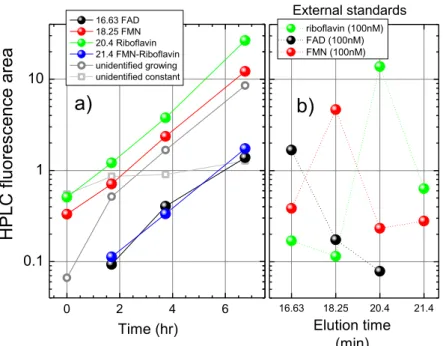
Figure S2: Left panel. The HPLC fluorescence area of all peaks detected in the chromatograms of a
supernatant collected at different times from the beginning of the culture (X axis). Black, red, green and blue filled circles are the flavins identified in the external standards. Open gray circles are the sum of the fluorescence areas of all unidentified 12 peaks that are individually growing as a function of culture time (their elution times are in minutes: 3.93, 4.40, 4.94, 5.28, 5.78, 7.24, 7.95, 11.25, 11.35, 12.25, 13.14, 14.07, 14.46, 15.35, 17.06, 17.67, 23.64). Open gray squares are the sum of all unidentified peaks that are constant as a function of time of the culture (their elution times are in minutes: 3.447, 10.557, 15.169, 19.074, 21.89). b) the area of HPLC fluorescence peaks of 100nM solution of riboflavin (green filled circles), FAD (black filled circles) and FMN (red filled circles) as a function of elution time. The highest peak of FAD appears at 16.63 min, of FMN at 18.25 and riboflavin at 20.4 min. As one can see the standards are not pure, each of them containing other flavins. Note that there is a peak that elutes in the FMN and riboflavin standards at 21.4 minutes. It appears to be a flavin, although we did not identify it precisely. This peak also elutes in the supernatant samples (left panel, blue filled circles) and we considered it as a flavin in the total flavin fluorescence count. The ratio of the sum of all HPLC fluorescence area of identified flavins to the sum of all time-growing peaks of HPLC fluorescence is given in Figure4a).
HPLC-Mass Spectrometry
Detection of riboflavin was also performed by HPLC coupled through electrospray ionization to tandem mass spectrometry, using an Accela HPLC system and a Quantum Ultra mass spectrometer (ThermoFisher scientific). Separation was performed on a C18 reversed phase (uptisphere C18, 5 µm, 15 x 2.1 mm i.d.) using a linear gradient starting with 100% ammonium formate 2mM and reaching 30% of CH3CN at 30 min). The column was maintained at 28°C and the flow rate was set at 0.2 ml/min. Riboflavin, which elutes at 14.8 min under these conditions, was detected by the triple quadruple mass spectrometer in the MRM mode using transitions 377.4 → 243.3 and 377.4 → 172.2
4
(in the positive ionization mode) and was quantified by external calibration using Excalibur Software.
Flavins/gram of protein estimation
Flavin concentration is usually given in the literature in molar concentration/gram of protein. To convert from our measurements, expressed in molar concentration/optical density (in mol ⋅ cm), the total protein concentration/OD (g ⋅ cm) must be estimated. The protein weight of 109 bacterial cells having a doubling rate of 60 min, as it is in our case, is approximately ≊ 156µg [28] and expressed as mass/ml at a given OD = 1cm-1 is 173µg/ml⋅cm [7]. The extracellular flavin concentrations written as a function of cellular protein mass is therefore CFMN = 92nM ⋅ cm = 0.53µmoles/g of
protein, Cribo = 47nM ⋅ cm = 0.27µmoles/g of protein and CFAD = 36nM ⋅ cm = 0.21µmoles/g of
protein. These values are in agreement with what has been found elsewhere [21].
Growth synchronization in aTc induction experiments
10 15 0.1 1 200ng/ml 100ng/ml 50ng/ml 20ng/ml 10ng/ml 0ng/ml wt Time (hr) a) OD (cm -1 ) 10 15 0.1 1 b) Time (hr)
Figure S3: a, b) The synchronized OD curves of different induction levels in microtiter experiments
corresponding respectively to the experiment shown in Figure 6 a), b). The color code is : 200ng/ml, 100ng/ml, 50ng/ml, 20ng/ml, 10ng/ml, 0ng/ml and the wild type strain, respectively, black, red, green, blue, cyan, magenta and dark yellow squares (see legend).
Supplementary reference:
[28] D. P. Bremer H, Modulation of chemical composition and other parameters of the cell by growth rate, in Escherichia coli and Salmonella, N. FC, Éd., ASM Press; Washington D.C., 1996.