HAL Id: hal-02668599
https://hal.inrae.fr/hal-02668599
Submitted on 31 May 2020
HAL is a multi-disciplinary open access
archive for the deposit and dissemination of
sci-entific research documents, whether they are
pub-lished or not. The documents may come from
teaching and research institutions in France or
abroad, or from public or private research centers.
L’archive ouverte pluridisciplinaire HAL, est
destinée au dépôt et à la diffusion de documents
scientifiques de niveau recherche, publiés ou non,
émanant des établissements d’enseignement et de
recherche français ou étrangers, des laboratoires
publics ou privés.
Pierre-Yves Rescan, Jérôme Montfort, Cécile Ralliere, Aurélie Le Cam, Diane
Esquerre, Karine Hugot
To cite this version:
Pierre-Yves Rescan, Jérôme Montfort, Cécile Ralliere, Aurélie Le Cam, Diane Esquerre, et al..
Dy-namic gene expression in fish muscle during recovery growth induced by a fasting-refeeding schedule.
BMC Genomics, BioMed Central, 2007, 8 (438), pp.1-42. �10.1186/1471-2164-8-438�. �hal-02668599�
Open Access
Research article
Dynamic gene expression in fish muscle during recovery growth
induced by a fasting-refeeding schedule
Pierre-Yves Rescan*
1, Jerome Montfort
1, Cécile Rallière
1, Aurélie Le Cam
1,
Diane Esquerré
2and Karine Hugot
2Address: 1National Institute for Agricultural Research, Joint Research Unit for Fish Physiology, Biodiversity and the Environment, INRA Scribe,
IFR140, Campus de Beaulieu, 35042 Rennes, France and 2CRB GADIE, INRA, DGA, Laboratoire de Radiobiologie et d'Etude du Genome, 78352
Jouy-en-Josas, France
Email: Pierre-Yves Rescan* - pierre-yves.rescan@rennes.inra.fr; Jerome Montfort - jerome.montfort@rennes.inra.fr;
Cécile Rallière - cecile.ralliere@rennes.inra.fr; Aurélie Le Cam - aurelie.lecam@rennes.inra.fr; Diane Esquerré - diane.esquerre@jouy.inra.fr; Karine Hugot - karine.hugot@jouy.inra.fr
* Corresponding author
Abstract
Background: Recovery growth is a phase of rapid growth that is triggered by adequate refeeding of animals following a period of weight loss caused by starvation. In this study, to obtain more information on the system-wide integration of recovery growth in muscle, we undertook a time-course analysis of transcript expression in trout subjected to a food deprivation-refeeding sequence. For this purpose complex targets produced from muscle of trout fasted for one month and from muscle of trout fasted for one month and then refed for 4, 7, 11 and 36 days were hybridized to cDNA microarrays containing 9023 clones.
Results: Significance analysis of microarrays (SAM) and temporal expression profiling led to the segregation of differentially expressed genes into four major clusters. One cluster comprising 1020 genes with high expression in muscle from fasted animals included a large set of genes involved in protein catabolism. A second cluster that included approximately 550 genes with transient induction 4 to 11 days post-refeeding was dominated by genes involved in transcription, ribosomal biogenesis, translation, chaperone activity, mitochondrial production of ATP and cell division. A third cluster that contained 480 genes that were up-regulated 7 to 36 days post-refeeding was enriched with genes involved in reticulum and Golgi dynamics and with genes indicative of myofiber and muscle remodelling such as genes encoding sarcomeric proteins and matrix compounds. Finally, a fourth cluster of 200 genes overexpressed only in 36-day refed trout muscle contained genes with function in carbohydrate metabolism and lipid biosynthesis. Remarkably, among the genes induced were several transcriptional regulators which might be important for the gene-specific transcriptional adaptations that underlie muscle recovery.
Conclusion: Our study is the first demonstration of a coordinated expression of functionally related genes during muscle recovery growth. Furthermore, the generation of a useful database of novel genes associated with muscle recovery growth will allow further investigations on particular genes, pathways or cellular process involved in muscle growth and regeneration.
Published: 28 November 2007
BMC Genomics 2007, 8:438 doi:10.1186/1471-2164-8-438
Received: 31 January 2007 Accepted: 28 November 2007 This article is available from: http://www.biomedcentral.com/1471-2164/8/438
© 2007 Rescan et al; licensee BioMed Central Ltd.
This is an Open Access article distributed under the terms of the Creative Commons Attribution License (http://creativecommons.org/licenses/by/2.0), which permits unrestricted use, distribution, and reproduction in any medium, provided the original work is properly cited.
Background
Food restriction is associated with reduced growth rates. If refed, various animals including fish, grow at a faster than normal rate. During this burst of growth which mainly affects muscle, an accelerated turnover takes place which is characterized by markedly increased protein synthesis relative to degradation [1]. The elevation of protein syn-thesis after feeding can be translated in terms of the cellu-lar dynamics of muscle growth. Thus, it has been shown that feeding stimulates proliferation of fish myogenic cells
in vivo [2] as well as in vitro [3], providing a source of
nuclei for myotube formation and fibre hypertrophy [4]. There is now evidence that muscle recovery growth results from processes of metabolic adaptation, regulated by endocrine as well as the autocrine/paracrine system nota-bly involving IGF1 [1,5,6]. With the purpose of decipher-ing the mechanisms involved in muscle recovery growth, some studies have also reported the expression of candi-date genes such as metabolic-related genes [7], dominant negative regulators of the basic helix-loop-helix (bHLH) transcription factor genes [8] and uncoupling protein 2 genes [9] during nutritional restriction and refeeding in rainbow trout. However, until now the genetic network which is mobilized in recovering muscle has not been exhaustively described. In this study we took advantage of high density trout cDNA microarrays to assess overall gene expression and to determine which pathways are dynamically activated in recovering muscle. Also we iden-tified several genes potentially involved in the gene-spe-cific transcriptional adaptations taking place in recovering muscle.
Results
Effect of refeeding on growth characteristics
The mean body weight of the trout was 132 g ± 6.0 and the condition factor was 1.6 ± 0.03 before fasting. At the end of the 30-days fasting period the mean body weight decreased to 121 g ± 5.5 and the condition factor to 1.3 ± 0.03. The mean body weight increased to 130 ± 6.3, 144 ± 7.8, 143 ± 6.7 and 183 g ± 14 and the condition factor to 1.4 ± 0.02, 1.5 ± 0.05, 1.5 ± 0.03, 1.6 ± 0.02, 4, 7, 11 and 36 days post refeeding respectively.
Changes in gene expression during a fasting-refeeding schedule: Overview
To screen for genes involved in muscle recovery growth, we undertook a time-course analysis of transcript expres-sion in muscle of trout fasted for one month and then refed for 4, 7, 11 and 36 days. At each time point, eight to nine fish were sampled giving in total 43 separate com-plex cDNA targets that were hybridized to 43 microarrays (GEO accession number: GSE6841). Unsupervised hierar-chical clustering of gene expression patterns from all sam-ples produced a consistent grouping of the samsam-ples according to the fish feeding conditions (i.e. fasting and 4,
7, 11 and 36 days post-refeeding) (Fig 1). This validated the experimental design and allowed further analysis. To define those genes whose expression levels were signifi-cantly different in muscle from 4, 7, 11 or 36 days refed animals compared to muscle from fasted fish we used SAM analysis [10]. We therefore obtained approximately 2200 genes that were then hierarchically clustered using an average-linkage clustering [11]. This resulted in the for-mation of four major clusters of genes displaying distinct temporal profiles (Fig. 2). A similar clustering was obtained when using the K-means clustering (not shown). The first cluster was composed of genes with peak expres-sion in muscle from starved fish, the second included genes overexpressed at 4, 7 and 11 days post-refeeding and down-regulated at 36 days post-refeeding (cluster II) the third was composed of genes with a later and more sustained induction (7–36 days post-refeeding) (cluster
Unsupervised hierarchical clustering consistently sorts fish muscle samples according to feeding conditions
Figure 1
Unsupervised hierarchical clustering consistently sorts fish muscle samples according to feeding conditions. F2–10: muscle of distinct fasted trout, 41–9, 71–9, 111–8 and 361–9: muscle of 4, 7, 11 and 36 days distinct refed trout.
Supervised clustering analysis of the differentially expressed genes selected by SAM
Figure 2
Supervised clustering analysis of the differentially expressed genes selected by SAM. Cluster I comprises genes up-regulated in muscle from fasted animals, cluster II includes genes with transient induction 4 to 11 days post-refeeding, cluster III contains genes whose expression began at 7 days post refeeding and was maintained up to 36 days post-refeeding and cluster IV con-tains genes up-regulated 36 days post-refeeding. Each row represents the temporal expression pattern of a single gene and each column corresponds to a single sample: columns 1 to 8: muscle from distinct fasted trout ; columns 9 to 17, 18 to 26, 27 to 34 and 35 to 43 : muscle from 4, 7, 11 and 36 day distinct refed trout, respectively. Expression levels are represented by a color tag, with red representing the highest levels and green the lowest levels of expression.
III) and the fourth (cluster IV) contained genes overex-pressed only in 36 day refed trout muscle. These expres-sion profiles and the clusters are available online as a browseable file [12]. The accession number of each spot-ted clones can be obtained by typing the corresponding uniq_id (clone name) in the nucleotide data base of the NCBI.
Genes with peak expression in starved trout muscle (cluster I)
Cluster I contained approximately 1000 genes showing high expression in the muscle of fasted fish and down-reg-ulation after refeeding. In this cluster were notably identi-fied two major markers of nutrient deprivation: the tuberous sclerosis component 2 (TSC2) an inhibitor of mTOR function and the translational repressor 4E-BP1. The most distinctive feature of cluster I was the presence
of a large repertoire of genes involved in the regulation of protein degradation (Fig. 3). These genes participate either in the lysosomal system such as the cysteine pro-tease cathepsins B, D and S or to the ubiquitin-proteas-ome pathway. In this latter class were several proteasubiquitin-proteas-ome subunits, proteasome-associated proteins, ubiquitin, sev-eral ubiquitin-conjugating enzymes, ubiquitin carboxyl-terminal hydrolases and ubiquitin ligases. Among other genes involved in proteasome-mediated degradation were several COP9 signalosome complex subunits, cullin-3 and the Ariadne-2 protein homolog. Notably we did not observe any significant up-regulation of calpains in the muscle of fasted trout. Cluster I contained many genes involved in catabolic pathways and beta oxidation of fatty acids such as the short, medium and long chains of Acyl-CoA dehydrogenase.
Supervised clustering of SAM selected genes belonging to cluster I and involved in protein degradation
Figure 3
Genes up-regulated 4 to 11 days after refeeding (cluster II)
Cluster II included approximately 550 genes with tran-sient induction 4 to 11 days post refeeding. In this cluster were found more than 40 genes regulating mRNA synthe-sis, processing and turnover (Fig. 4). Among them were genes encoding small nuclear ribonucleoproteins, tran-scription initiation factors, RNA helicases of the DDX family, spliceosome-associated proteins such as the NHP2-like protein 1 as well as polyadenylation and export factors.
Cluster II also comprised a large set of genes involved in various aspects of translation (Fig. 5). These genes encode
translation initiation factors (including the SUI1 domain containing density-regulated protein DRP), elongation and peptide chain release factors, peptidyl-tRNA hydro-lases and several aminoacyl-tRNA synthases. In addition to these genes, a large group (Fig. 6) of genes whose prod-ucts regulate protein folding and maturation was also found in cluster II. Among these latter were several heat shock proteins (HSP), endoplasmin, several subunits (alpha, beta, gamma, theta, zeta and epsilon) of the chap-eronin-containing complex TCP1 and seven peptidyl pro-lyl cis/trans-isomerases encoding genes (including genes encoding FK506-binding proteins) that are known to
cat-Supervised clustering of SAM selected genes belonging to cluster II and involved in RNA synthesis and processing
Figure 4
Supervised clustering of SAM selected genes belonging to cluster II and involved in RNA synthesis and processing. Columns as in figure 2.
alyze the cis-trans isomerization of prolyl bonds in oli-gopeptides and various folding states of proteins
Consistent with the induction of genes involved in pro-tein biosynthesis, cluster II included a large number of genes involved in ribosome formation. This group of genes which is presented in Fig. 7 included structural genes encoding ribosomal proteins as well as several genes whose products regulate ribosome biogenesis among which were fibrillarin, nucleolin, Brix domain-containing proteins, PUA domain-domain-containing hypotheti-cal protein MJ1432, RRp5, BMS1 and SAS 10 (something about silencing protein 10). Interestingly, in contrast to ribosomal structural genes which displayed about uni-form expression during the 4 to 11 days post refeeding period, most of the genes regulating ribosome biogenesis sub-clustered together (Fig. 7, upper part) peaking at 4 days post-refeeding.
In accordance with an increase in cellular biosynthesis, a large number of genes involved in mitochondrial produc-tion of ATP grouped into cluster II (Fig. 8). Among them were several genes which are components of the oxidative phosphorylation system (chains 1, 2, 4 and 5 of the NADH-ubiquinone oxidoreductase, cytochrome c and ubiquinol-cytochrome c reductase complex subunits) as well as several genes of the ATP synthase complexes (alpha, beta and gamma chains). Along with these genes involved in energy production, we observed the induction of several genes important for mitochondrion formation or biogenesis such as TIM10 (a mitochondrial import inner membrane translocase), TOM34 (a mitochondrial import receptor subunit), voltage-dependant anion-selec-tive channel protein 2 and 3 and the metalloprotease AFG3-like protein 1. Some enzymes of the mitochondrial matrix such as pyruvate dehydrogenase isoforms and suc-cinyl-CoA ligase were also found in this cluster. Consist-ent with a stimulation of mitochondrial biogenesis the gene encoding the mitochondrial single-stranded
DNA-Supervised clustering of SAM selected genes belonging to cluster II and involved in translation
Figure 5
binding protein (Mt-SSB) involved in mitochondrial DNA replication was also up-regulated.
Cluster II also contained several genes characteristically expressed during cell proliferation (Fig. 9). These genes are involved in DNA replication (mcm3, mcm6, DNA2-like homolog, DNA topoisomerase I and origin recogni-tion complex subunit 4), progression through the cell cycle (G1/S-specific cyclin D2, CDK5 regulatory subunit, Wee1-like protein kinase, mitogen-activated protein kinase 9, M-phase induced phosphatase 2, pelota homolog and tumor protein D53 homolog), chromo-some condensation (histone H2Az, H3, H5A, chromobox protein homolog 3 and regulator of chromosome conden-sation) or associated with proliferation (protein 2G4). Among the most differentially regulated genes with mis-cellaneous functions and belonging to cluster II, we found uridine-cytidine kinase 2, various genes preventing cell apoptosis such as MCL1. Genes whose products mediate
cAMP-dependant signalling such as the cAMP-dependent protein kinase beta catalytic subunit were also present. Among the genes belonging to cluster II with unknown functions we found C9orf32, the surfeit locus protein 2 and 4 encoding genes, the genes for the hypothetical pro-tein ZK637.2 and for the hypothetical WD-repeat propro-tein C1A6.02 in chromosome I.
Genes up-regulated 7–36 days after refeeding (cluster III)
Cluster III that contained approximately 480 genes up-regulated 7 to 36 days post refeeding was enriched in genes that encode components of the reticulum and Golgi apparatus such as triadin, and exostosin-2, and proteins involved in transport from the reticulum to the Golgi apparatus including golgi SNAP receptor complex mem-ber 1 (Fig. 10). Numerous genes in cluster III function in actin cytoskeletal rearrangements (including dynactin subunit 6, actin-like protein 3, actin-related protein 2/3 complex subunits and ankyrins) and organisation of the sarcomere (skeletal actin, myosins, tropomyosins,
tro-Supervised clustering of SAM selected genes belonging to cluster II and involved in chaperon activity
Figure 6
ponins, nebulin) (Fig. 11). Also were grouped in cluster III several collagen genes (collagen alpha 1(I), alpha 2(I), alpha 5 (IV) and alpha 1 (V) chains) that participate in the synthesis of the muscle extracellular matrix. Among the genes of cluster III with miscellaneous function were sev-eral Ras-related proteins such as 24, 26, and Rab-11b, several members of the glutathione S-transferase family, the bifunctional methylene tetrahydrofolate pre-cursor and the myeloid leukaemia factor 1 (MLF1).
Genes up-regulated in the muscle of 36 days refed trout (cluster IV)
Cluster IV contained fewer (less than 200) genes com-pared to the other clusters. As observed for cluster III, clus-ter IV comprised several genes regulating reticulum and
Golgi biogenesis and activity such as glycosyltransferases and the protein transport Sec24D (Fig. 10). A distinctive feature of cluster IV was to contain several genes encoding glycolytic enzymes (triose-phosphate isomerase, 6-phos-phofructokinase, alpha-enolase and phosphoglycerate kinase). In addition, cluster IV contained several genes involved in lipid biosynthesis such as 24-dehydrocholes-terol reductase precursor, ethanolamine kinase, Scavenger receptor class B member 1 and 1-AGP acyltransferase.
Functional categorization of genes contained in clusters I–IV as shown by GoMiner algorithm
To further assess the enrichment of a particular functional class of genes in each cluster we used the GoMiner algo-rithm [13]. Given that the GO data bases that served as
Supervised clustering of SAM selected genes belonging to cluster II and involved in ribosome formation
Figure 7
Supervised clustering of SAM selected genes belonging to cluster II and involved in ribosome formation. Genes regulating ribos-ome biogenesis segregate from genes encoding ribosomal proteins forming a subcluster peaking at 4 days post-refeeding. Col-umns as in figure 2.
input for GoMiner did not encompass the whole of genes present in our membrane only a subset of genes contained in cluster I–IV was selected for GoMiner analysis. Never-theless, in agreement with the detailed identification of the genes contained in the different clusters (see above), the GoMiner notably highlighted an enrichment of cluster I for genes regulating protein degradation while cluster II was found to be enriched for genes involved in RNA metabolism (and more particularly rRNA metabolism), ribosome biogenesis, mitochondrion, translation and protein folding (Fig. 12). On the other hand, cluster III was particularly found to be enriched for genes participat-ing in actin cytoskeleton and myofibrillar organisation (Fig. 12). This functional categorization was supported by probability values (Fig. 12) which yielded the measure of the likelihood that a particular biological process was overrepresented in a cluster compared with that expected by random selection from the SAM list.
Transcriptional regulators induced during muscle recovery growth
Some of the genes induced during muscle recovery growth were themselves regulators of transcription (Fig. 13). Among those present in cluster II, were two cyclic AMP-dependent transcription factors closely related to CREB3 and to ATF4 respectively, MEF2a, SF-1/fushitarazu homolog 1 related protein, cell growth regulating nucleo-lar protein LYAR, apoptosis-antagonizing transcription factor AATF and an unidentified zinc finger protein encoding gene. Cluster III included MTF1, the LIM/home-obox protein Lhx8, the homeLIM/home-obox proteins Hox-C9 and Hox-B1, the LIM domain containing transcription factor LMO4, the Homeodomain only protein Hop, a CREB1 related protein, sox11 as well as four unidentified zinc fin-ger protein encoding genes. In addition to transcriptional regulators that trigger gene-specific expression by binding to sequence of promoters, we found other genes overex-pressed during muscle recovery growth which potentially control gene expression by inducing histone
modifica-Supervised clustering of SAM selected genes belonging to cluster II and involved in mitochondrion biogenesis and activity
Figure 8
Supervised clustering of SAM selected genes belonging to cluster II and involved in mitochondrion biogenesis and activity. Col-umns as in figure 2.
tions (SmyD1) or DNA modification (DNMT1 and DNMT2).
Validation of the microarray gene expression data
The accuracy and reliability of the results obtained with microarrays were tested by quantitative RT-PCR (Q-PCR) of 10 selected genes belonging to different functional classes. The gene expression levels obtained by Real-time PCR were normalized to that of the 18s. A good agree-ment was observed between microarray and Q-PCR anal-ysis (Fig. 14) with discordant results obtained for only two genes. Thus, differential expression detected by microar-ray analysis is highly predictive of expression levels meas-ured with an independent methodology such as Q-PCR (80% confirmation).
Discussion
In this study we used high density cDNA arrays to describe the changes in gene expression during muscle recovery induced by a fasting-refeeding sequence. Statistical analy-sis of the microarray data and transcriptional profiling led to the identification of 4 major temporally distinct
clus-ters. The detailed identification of the genes contained in each cluster along with a Gominer analysis showed that these clusters contained genes involved in distinct biolog-ical functions.
In agreement with the proteolytic and lypolytic responses to starvation described in mammals [14] a large set of genes overexpressed in the muscle of fasted trout and down-regulated after refeeding, revealed an adaptation program that favours fatty acid oxidation and protein deg-radation to fuel metabolism. Two pathways of proteolysis appeared to be mobilized in the muscle of fasted trout: the lysosomal system as revealed by the up-regulation of sev-eral cathepsins and the ubiquitin-proteasome system, as indicated by the overexpression of numerous components involved in its activity. On the other hand, in agreement with a previous report showing that transcripts of calpains are not changed in muscle proteolysis of gravid trout [15], calpain genes were not found to be up-regulated in fasted trout muscle. Overall our data are consistent with the notion that most of the accelerated proteolysis in muscle is due to an activation of the Ub-proteasome pathway
Supervised clustering of SAM selected genes belonging to cluster II and involved in cell division and chromatin assembly
Figure 9
Supervised clustering of SAM selected genes belonging to cluster II and involved in cell division and chromatin assembly. Col-umns as in figure 2.
[16]. Supporting an increased protein degradation relative to synthesis due to food deprivation, starved trout muscle contained high levels of the transcript for tuberous sclero-sis component 2 (TSC2) which has been shown, in mam-mals, to inhibit mTOR a positive regulator of cell growth and proliferation [17], and of the transcript encoding the translational repressor 4E-BP1, which presumably rein-forces the inhibition of cap-dependent translation result-ing from inactivation of Akt/mTOR [17].
Most of the genes that were up-regulated during muscle recovery growth fell into three major clusters (II–IV) with distinct temporal profiles and showed remarkable consist-ency in their functional categories. Cluster II which corre-sponds to the first phase of muscle recovery contained a large set of genes that stimulate cellular biosynthesis. This cluster included genes involved in transcript processing, translation or involved in ribosome production. A large number of genes was also found in this cluster that are involved in post-translational modifications of nascent proteins such as heat shock proteins, subunits of the chap-eronin containing t-complex polypeptide 1 and peptidyl-prolyl cis trans isomerases that are chaperone enzymes
which alter the peptide bond between a given amino acid and a proline, changing it from the cis to the trans confor-mation and vice versa. Interestingly, it has been previously reported in zebrafish that the heat shock protein hsp90 alpha not only participates in the correct protein folding but also plays a specific role in the normal process of myo-genesis [18]. Given that hyperplasia (neosynthesis of myofibres) contributes to muscle growth in fish [19], it can be speculated that an elevated level of hsp 90 alpha in recovering muscle is at least in part related to the differen-tiation of neomyofibres. Several genes up-regulated dur-ing muscle recovery encode protein regulatdur-ing the cell cycle and mitosis. This suggests, in agreement with a pre-vious work carried out in the Antarctic fish Notothenia
cori-iceps [2] that cell proliferation is stimulated by feeding,
increasing myoblast fusion into new myotubes (hyperpla-sia) and providing a source of nuclei as muscle fibres increase in diameter (hypertrophy). Consistent with cell cycle progression and cellular growth, which require adjustment in mitochondrial ATP production, cluster II was found to contain several transcripts that encode pro-teins required for oxidative respiration and ATP synthesis or involved in mitochondrial biogenesis.
Supervised clustering of SAM selected genes belonging to cluster III and IV and involved in reticulum and Golgi dynamics
Figure 10
Supervised clustering of SAM selected genes belonging to cluster III and IV and involved in reticulum and Golgi dynamics. Col-umns as in figure 2.
Cluster III contained genes associated with Golgi and reticulum dynamics. The induction of these genes, most of which participate in post-translational modifications and transport of proteins, is consistent with the enhance-ment, 4 to 11 days post refeeding, of the protein synthesis machinery. A striking feature of cluster III is the presence of a large set of genes encoding cytoskeletal proteins and sarcomeric proteins involved in contractile functions. At the same time are induced several transcripts encoding matrix compounds such as chains of the fibril forming collagen I which is the major collagen of intramuscular connective tissue in fish [20]. All these expressions that evoke the muscle regenerative response that follows cardi-otoxin delivery in mouse [21] show that myofiber and muscle remodelling occur at a late time period of muscle recovery growth. As in cluster III, cluster IV contained genes regulating Golgi and reticulum biogenesis and activity but differed by the presence of genes with a role in carbohydrate metabolism and lipid biosynthesis. The increased expression in recovering trout muscle of genes involved in glycolysis is in agreement with recent data
showing that atrophying muscle of gravid trout has low levels of transcripts encoding many glycolytic enzymes [15].
Among the transcriptional regulators induced in recover-ing muscle was found MEF2a. The transcription factors of the MEF2 family bind to an A/T rich sequence present in many muscle-specific promoters and enhancers [22]. Sup-porting a role of MEF2a in transcription of fish contractile protein encoding genes, MEF2 sites have been identified in carp myosin promoters [23] and MEF2a knockdown in zebrafish has been shown to induce a down regulation of a large set of transcripts for gene encoding contractile pro-teins such as troponins, myosin heavy and light chains and α-tropomyosin [24]. Interestingly MEF2a induction in recovering muscle precedes that of the sarcomeric pro-tein encoding genes. This temporal sequence is in accord-ance with a function of MEF2a in the burst of myofibrillar protein encoding genes activation observed during mus-cle compensatory growth. Also were induced Sox8, Sox11 and the LIM-only protein gene LMO4. All these genes are
Supervised clustering of SAM selected genes belonging to cluster III and involved in cytoskeletal and myofibrillar organisation
Figure 11
Supervised clustering of SAM selected genes belonging to cluster III and involved in cytoskeletal and myofibrillar organisation. Columns as in figure 2.
expressed in the fish differentiating embryonic myotome [[25] and [26]; Dumont and Rescan: unpublished results] suggesting that their expression in recovering muscle relates to the formation of new differentiating muscle fibres. Also the induction of Hop (Homeodomain only protein) in trout recovering muscle is of interest because Hop has been recently reported in mammals to regulate skeletal myoblast differentiation and to play a critical role in muscle regeneration [27]. The induction of three cyclic AMP-responsive element binding proteins (ATF4, CREB1 and CREB3) along with cAMP-dependent protein kinase subunits suggests a possible role of cyclic AMP signalling in the recruitment of new myofibres during muscle recov-ery. Supporting this view, it has been reported in amniotes that the cAMP pathway participates in the regulation of myogenesis [28] involving a CREB-mediated transcription [29] and that ATF4 is induced during in vitro differentia-tion of human skeletal myoblasts [30]. In addidifferentia-tion to the induction of transcriptional regulators that exert their function at the nuclear genome level, we observed the
up-regulation of the transcription factor A that is a key activa-tor of mitochondrial transcription and a participant in mitochondrial genome replication [31] Several other genes up-regulated during muscle recovery growth fall within the transcriptional regulator class. These genes either have homology to known sequences, but no dem-onstrated function in muscle development and growth (for example: LYARR, the leucine zipper containing factor AATF and PU.1) or have no homology to any known sequence (in particular most of the zinc finger protein genes). All these genes deserve in-depth studies: it would be of interest in particular to identify their individual function in fish muscle development and growth using antisens morpholino oligonucleotides and to further characterize their gene targets. In addition to the up-regu-lation of transcription factors, some genes related to chro-matin remodelling or DNA modification also were found to be induced in recovering muscle. Thus we observed the induction of the chromatin remodelling protein SmyD1 and that of two DNA (cytosine-5) methyl transferases
Ontology-matrix showing functional grouping of genes belonging to clusters I–IV
Figure 12
Ontology-matrix showing functional grouping of genes belonging to clusters I–IV. The enrichment of genes of a given functional class is indicated for each cluster. Also are represented the p-values. Dark and light colors represent P-values of < 0.005 and < 0.05 respectively
(DNMT1 and DNMT2). SmyD1 has been recently shown to have a major role in myofibril organisation in the zebrafish embryo [32]. Consistent with such a function in recovering trout muscle it is interesting to note that SmyD1 is coexpressed with genes encoding sarcomeric proteins. In relation to a function for DNMT1 in muscle growth, it has been reported that forced expression of DNMT1 in murine C2C12 myoblasts causing de novo methylation in the MyoD gene induced its expression and stimulated myogenesis [33].
Conclusion
Our microarray analysis shows that genes overexpressed in recovering muscle fall into distinct groups with distinct temporal profiles which showed remarkable consistency in their functional classes. The early phase of muscle recovery was associated with dramatic transient induction
of a large number of genes functionally related to RNA processing, translation, maturation of proteins, ribosome biogenesis, cell proliferation and mitochondrial bioener-getics. In a later and more sustained phase several genes regulating Golgi and reticulum dynamics and genes involved in muscle remodelling were induced. The gener-ation of a database of novel genes associated with muscle recovery growth will help investigations on genes, path-ways or cellular process involved in muscle growth and regeneration.
Methods
Animals and experimental design
Investigations were conducted in agreement with the guiding principles for the use and care of laboratory ani-mals and in compliance with European regulations on animal welfare. A spring strain of l-year-old rainbow trout
Supervised clustering of SAM selected genes induced during muscle recovery growth and involved in transcriptional regulation
Figure 13
Supervised clustering of SAM selected genes induced during muscle recovery growth and involved in transcriptional regulation. Columns as in figure 2.
(Oncorhynchus mykiss) was used. The fish had been fed to satiation with a commercial diet until the beginning of the starvation. The fasted group was composed of fish initially
weighing about 130 grams that were deprived of food for 30 days. Refed groups were composed of trout from the fasted group that were fed at a rate three time higher than
Relative mRNA expression levels of selected genes in muscle from fasted (F), 4 (4), 7 (7), 11 (11) and 36 (36) day-refed trout as obtained by microarray hybridisation (left) and Q-PCR (right)
Figure 14
Relative mRNA expression levels of selected genes in muscle from fasted (F), 4 (4), 7 (7), 11 (11) and 36 (36) day-refed trout as obtained by microarray hybridisation (left) and Q-PCR (right). The mRNA levels measured by Q-PCR were normalized to levels of 18S rRNA. Bars sharing the same letter(s) are not significantly different (p < 0.05).
the normal ration and sampled sequentially at 4, 7, 11 and 36 days post refeeding. Fish were reared in freshwater tank (PEIMA-INRA, Sizun, France) under a natural pho-toperiod. The water temperature was 11.8°C at the end of starvation, 11.1°C, 10.5°C, 10.4°C and 7.8°C, 4, 7, 11 and 36 days post refeeding respectively. The fish were rap-idly anaesthetized with phenoxy-ethanol (Aquaveto, 4 ml per 10 liters of fresh water) before dissection. The condi-tion factor (an indicator of the body shape) was calculated as follows: K = body weightx100/body length 3 (the body length did not include the caudal fin length).
RNA purification and complex cDNA target preparation
Muscle from 8 or 9 trout was sampled for each time point. A transverse slice of fast muscle situated just beneath the dorsal fin was taken for RNA extraction. Total RNA was purified using TRIzol reagent (Invitrogen, Carlsbad, CA). The RNA integrity and concentration were respectively controlled and calculated with the Agilent bioanalyser. Complex target were prepared from 5 μg of RNA of each sample by simultaneous reverse transcription (using oligo(dT) as primer) and labelling for 2 hours at 42°C in the presence of 30 μCi [alpha-33P] dCTP, 120 μM dCTP, 20 mM each dATP, dTTP, dGTP and 400 units Superscript II reverse transcriptase (Invitrogen). RNA was degraded by treatment at 68°C for 30 min with l μl 10% SDS, l μl 0.5 M EDTA and 3 μl 3 M NaOH, and then equilibrated at room temperature for l5 min. Neutralization was done by adding 10 μl 1 M Tris-HCI plus 3 μl 2 N HCl.
cDNA microarrays production
Nylon micro-arrays (7.6 × 2.6 cm) were obtained from the INRA-GADIE resource centre [34]. A set of 9023 distinct rainbow trout cDNA clones originating from pooled-tis-sues libraries [35,36] were amplified by PCR using prim-ers specific of the polylinker sequence of the vectors. Quality of the amplification products was systematically checked on 1% agarose gels. Unpurified PCR products were evaporated, resuspended in 20 μl of distilled water, then transferred to 384-well microplates and spotted onto nylon membranes (Hybond-N+; Amersham Biosciences, Saclay, France). The last step was conducted using a Bioro-botics MicroGrid-II arrayer (Genomics Solution, Cam-bridge, U.K.) equipped with a 64-pins Biorobotics printhead and 64 Biorobotics 100 μm solid pins. The spotted DNA were denaturated in 150 mM NaOH, 1.5 M NaCl. A neutralisation step was performed in 1 M Tris HCl (pH 7.5), 1.5 M NaCl. A last step to rinse micromem-branes in 2 × SSC was performed. The DNA was subse-quently fixed by successive heat (80°C during 2 hours) and UV (120000 μJ) treatments.
Hybridisation
A first hybridization was performed using a 33P-labelled oligonucleotide (TAATACGACTCACTATAGGG) which is
found at the extremity of each PCR product to monitor the amount of cDNA present in each spot. After stripping (3 hours 68°C, 0.1 SSC, 0.2% SDS), arrays were prehybrid-ized for 4 h at 65°C in hybridization solution (5× Den-hardt's, 5 SSC, 0.5% SDS) and hybridized with denatured labeled cDNAs for 48 h at 65°C in hybridization solution. After 3 washes (1 hour 68°C, 0.1 SSC 0.2% SDS), arrays were exposed for 65 hours to phosphor-imaging plates before scanning using a FUJI BAS 5000. Signal intensities were quantified using BZScan software [37].
Microarray signal processing
Low oligonucleotide signals (lower than three times the background level) were excluded from the analysis. After this filtering step, signal for each spot was divided by the hybridisation signal obtained with the vector oligonucle-otide. After this correction, signals were then normalized by dividing each gene expression value by the median value of the array.
Microarray data analysis
SAM software [10] was used to identify genes differen-tially expressed between muscle of fasted trout and muscle of 4, 7, 11 and 36 day refed trout. For each comparison a false discovery rate (FDR) of 0.01% was used. All genes identified in at least one of the above comparisons were kept for clustering analysis in order to characterize the temporal expression profiles of statistically relevant genes. For supervised clustering analysis, data was log trans-formed, median-centred and an average linkage clustering was carried out using CLUSTER software and the results were visualized by TREEVIEW [11].
Data mining
Rainbow trout sequences originating from INRA Agenae [35] and USDA [36] EST sequencing programs were used to generate publicly available contigs [38]. The 8th ver-sion (Om.8, released January 2006) was used for Blast X comparison against the Swiss-Prot database (January 2006) [39]. The score of each alignment was retrieved after performing a BlastX comparison. In addition, for each EST spotted onto the membrane, the accession number of the corresponding rainbow trout cluster (Uni-gene Trout, January 2006), if any, was retrieved from the UniGene database [40].
Gene Ontology analysis
In order to assign functional categories to each identified clusters, we used GoMiner software [13]. For each PCR product spotted, the corresponding contig was blast against Swissprot Database (a score > 86 was considered as significant). Then the SwissProt accession number was used as the input to analyse gene lists of clusters for GO categories that showed statistically enrichment (2265 genes obtained by SAM analysis as total genes list).
P-val-ues were estimated by two-sided Fisher's exact test and only P < 0.05 were retained.
Real-time PCR analysis
The expression of 10 selected genes belonging to different functional classes was analysed by real-time RT-PCR. Total RNA (2 μg) from all samples used for microarray analysis were reverse transcribed using 200 Units of moloney murine Leukemia virus (MMLV) reverse transcriptase (Promega) and 0.5 μg random hexamers (Promega) per μg of total RNA according to manufacturer's instruction. The expression levels were determined using the I-cycler IQ (Biorad, Hercules, CA) instrument. Briefly reverse tran-scription products were diluted to 1/24 and 5 μl were used for each real-time PCR reaction which were performed using a real-time PCR kit provided with a SYBR Green fluorophore (Eurogentech, Belgium). For each target gene, primers (Table 1) were chosen to presumably flank an intron as determined by comparison with the gene sequence of zebrafish ortholog. The amount of the target RNA was determined by comparison with a standard curve generated using serial dilution of RT reactions. This dilution curve was used to ensure that PCR efficiency ranged from 90 to 100% and that amplification was linear within sample set. The level of 18S RNA in each sample was also measured by real-time RT-PCR and used for tar-get genes abundance normalisation within sample set. Statistical analysis were performed using Statistica 7.0 software (Statsoft, Tulsa, OK). Differences between sam-ples were analysed using non parametric Kruskal-Wallis test.
Authors' contributions
PYR coordinated the study, analysed the data and wrote the manuscript. JM and AL performed microarray
experi-ments and participated in the data analysis. CR performed RNA extractions and Real-time PCR. DE and KH prepared the microarrays. All authors read and approved the final manuscript.
Acknowledgements
This work was supported by grants from the Institut National de la recher-che Agronomique, L'OFIMER, l'IFOP and the CIPA. We thank Lionel Goar-don for fish rearing and sampling, Yann Guiguen for help in data analysis and the INRA-SIGENAE group (Toulouse, France) for bioinformatic support.
References
1. Hornick JL, Van Eenaeme C, Gerard O, Dufrasne I, Istasse L:
Mech-anisms of reduced and compensatory growth. Domest Anim
Endocrinol 2000, 19:121-132.
2. Brodeur JC, Peck LS, Johnston IA: Feeding increases MyoDand
PCNA expression in myogenic progenotors cells of
Notothe-nia coriiceps. J Fish Biol 2002, 60:1475-1485.
3. Fauconneau B, Paboeuf G: Effect of fasting and refeeding on in
vitro muscle cell proliferation in rainbow trout
(Oncorhyn-chus mykiss). Cell Tissue Res 2000, 301:459-463.
4. Koumans JT, Akster HA: Myogenic cells in development and
growth of fish. Comp Biochem Physiol A 1995, 110:3-20.
5. Duan C: Nutritional and developmental regulation of
insulin-like growth factors in fish. J Nutr 1998, 128:306S-314S.
6. Chauvigné F, Gabillard JC, Weil C, Rescan PY: Effect of refeeding
on IGFI, IGFII, IGF receptors, FGF2, FGF6, and myostatin mRNA expression in rainbow trout myotomal muscle. Gen
Comp Endocrinol 2003, 132(3):209-215.
7. Johansen KA, Overturf K: Alterations in expression of genes
associated with muscle metabolism and growth during nutri-tional restriction and refeeding in rainbow trout. Comp
Bio-chem Physiol B 2006, 144:119-127.
8. Gahr SA, Weber GM, Rexroad CE: Fasting and refeeding affect
the expression of the inhibitor of DNA binding (ID) genes in rainbow trout (Oncorhynchus mykiss) muscle. Comp Biochem
Physiol B 2006, 144:472-477.
9. Coulibaly I, Gahr SA, Palty Y, Yao J, Rexroad CE: Genomic
struc-ture and expression of uncoupling protein 2 genes in rainbow trout (Oncorhynchus mykiss). BMC Genomics 2006, 7:203.
10. Tusher VG, Tibshirani R, Chu G: Significance analysis of
micro-arrays applied to the ionizing radiation response. Proc Natl
Acad Sci USA 2001, 98:5116-5121.
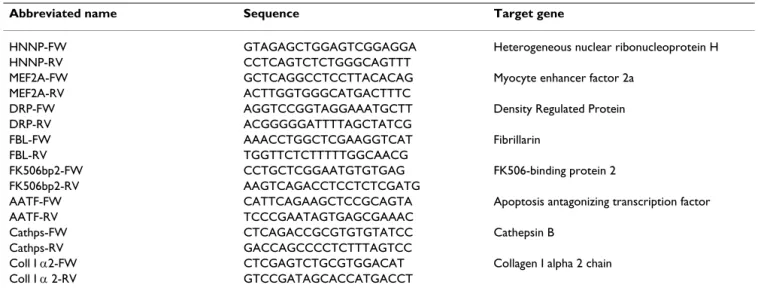
Table 1: Sequence of the primer pairs used for real-time quantitative PCR and gene names.
Abbreviated name Sequence Target gene
HNNP-FW GTAGAGCTGGAGTCGGAGGA Heterogeneous nuclear ribonucleoprotein H HNNP-RV CCTCAGTCTCTGGGCAGTTT
MEF2A-FW GCTCAGGCCTCCTTACACAG Myocyte enhancer factor 2a MEF2A-RV ACTTGGTGGGCATGACTTTC
DRP-FW AGGTCCGGTAGGAAATGCTT Density Regulated Protein DRP-RV ACGGGGGATTTTAGCTATCG
FBL-FW AAACCTGGCTCGAAGGTCAT Fibrillarin FBL-RV TGGTTCTCTTTTTGGCAACG
FK506bp2-FW CCTGCTCGGAATGTGTGAG FK506-binding protein 2 FK506bp2-RV AAGTCAGACCTCCTCTCGATG
AATF-FW CATTCAGAAGCTCCGCAGTA Apoptosis antagonizing transcription factor AATF-RV TCCCGAATAGTGAGCGAAAC
Cathps-FW CTCAGACCGCGTGTGTATCC Cathepsin B Cathps-RV GACCAGCCCCTCTTTAGTCC
Coll I α2-FW CTCGAGTCTGCGTGGACAT Collagen I alpha 2 chain Coll I α 2-RV GTCCGATAGCACCATGACCT
Publish with BioMed Central and every scientist can read your work free of charge "BioMed Central will be the most significant development for disseminating the results of biomedical researc h in our lifetime."
Sir Paul Nurse, Cancer Research UK Your research papers will be:
available free of charge to the entire biomedical community peer reviewed and published immediately upon acceptance cited in PubMed and archived on PubMed Central yours — you keep the copyright
Submit your manuscript here:
http://www.biomedcentral.com/info/publishing_adv.asp
BioMedcentral
11. Eisen MB, Spellman PT, Brown PO, Botstein D: Cluster analysis
and display of genome-wide expression patterns. Proc Natl
Acad Sci USA 1998, 95:14863-14868.
12. Browseable file containing the average linkage clustering
[http://www.sigenae.org/fileadmin/_temp_/TreeView/ tous_sam_spearman.html]
13. Zeeberg BR, Feng W, Wang G, Wang MD, Fojo AT, Sunshine M, Nar-asimhan S, Kane DW, Reinhold WC, Lababidi S, Bussey KJ, Riss J, Bar-rett JC, Weinstein JN: GoMiner: a resource for biological
interpretation of genomic and proteomic data. Genome Biol
2003, 4:R28.
14. Finn PF, Dice JF: Proteolytic and lipolytic responses to
starva-tion. Nutrition 2006, 22:830-844.
15. Salem M, Kenney PB, Rexroad CE, Yao J: Microarray gene
expres-sion analysis in atrophying rainbow trout muscle: A unique non-mammalian muscle degradation model. Physiol Genomics
2006, 28:33-45.
16. Lecker SH, Jagoe RT, Gilbert A, Gomes M, Baracos V, Bailey J, Price SR, Mitch WE, Goldberg AL: Multiple types of skeletal muscle
atrophy involve a common program of changes in gene expression. FASEB J 2004, 18:39-51.
17. Lindsley JE, Rutter J: Nutrient sensing and metabolic decisions.
Comp Biochem Physiol B 2004, 139:543-559.
18. Sass JB, Weinberg ES, Krone PH: Specific localization of zebrafish
hsp90 alpha mRNA to myoD-expressing cells suggests a role for hsp90 alpha during normal muscle development. Mech
Dev 1996, 54:195-204.
19. Rowlerson A, Veggetti A: Cellular mechanisms of
post-embry-onic muscle growth in aquaculture species. In muscle
develop-ment and growth, Fish Physiology series Volume 18. Edited by: Johnston
IA. San Diego: Academic Press; 2001:103-140.
20. Sato K, Yoshinaka R, Itoh Y, Sato M: Molecular species of collagen
in the intramuscular connective tissue of fish. Comp Biochem
Physiol 1989, 92:87-91.
21. Goetsch SC, Hawke TJ, Gallardo TD, Richardson JA, Garry DJ:
Tran-scriptional profiling and regulation of the extracellular matrix during muscle regeneration. Physiol Genomics 2003, 14:261-271.
22. Gosset LA, Kelvin DJ, Sternberg EA, Olson EN: A new
myocyte-specific enhancer-binding factor that recognizes a conserved element associated with multiple muscle-specific genes. Mol
Cell Biol 1989, 9(11):5022-5033.
23. Kobiyama A, Hirayama M, Muramatsu-Uno M, Watabe S: Functional
analysis on the 5'-flanking region of carp fast skeletal myosin heavy chain genes for their expression at different tempera-tures. Gene 2006, 372:82-91.
24. Wang Y, Qian L, Dong Y, Jiang Q, Gui Y, Zhong TP, Song H:
Myo-cyte-specific enhancer factor 2A is essential for zebrafish posterior somite development. Mech Dev 2006, 123:783-791.
25. De Martino S, Yan YL, Jowett T, Postlethwait JH, Varga ZM, Ash-worth A, Austin CA: Expression of Sox 11 gene duplicates in
zebrafish suggests the reciprocal loss of ancestral gene expression patterns in development. Dev Dyn 2000, 217:279-292.
26. Lane ME, Runko AP, Roy NM, Sagerström CG: Dynamic
expres-sion and regulation by Fgf8 and Pou2 of the zebrafish LIM-only gene, lmo4. Mech Dev 2002, 119:S185-S189.
27. Kee HJ, Kim JR, Nam KI, Park HY, Shin S, Kim JC, Shimono Y, Taka-hashi M, Jeong MH, Kim N, Kim KK, Kook H: Enhancer of
Polycomb1, a novel homeodomain only protein-binding partner, induces skeletal muscle differentiation. J Biol Chem
2007, 282:7700-7709.
28. Marchal S, Cassar-Malek I, Magaud JP, Rouaut JP, Wrutniak C, Cabello G: Stimulation of avian myoblast differentiation by
triio-dothyronine: possible involvement of the cAMP pathway.
Exp Cell Res 1995, 220:1-10.
29. Chen AE, Ginty DD, Fan CM: Protein kinase A signalling via
CREB controls myogenesis induced by Wnt proteins. Nature
2005, 433:317-322.
30. Sterrenburg E, Turk R, 't Hoen PA, Van Deutekom JC, Boer JM, van Ommen GJ, den Dunnen JT: Large-scale gene expression
analy-sis of human skeletal myoblast differentiation. Neuromuscul
Disord 2004, 14:507-18.
31. Asin-cayuela J, Gustafsson CM: Mitochondrial transcription and
its regulation in mammalian cells. Trends Biochem Sci 2007, 32:111-117.
32. Tan X, Rotlland J, LI H, De Deyne P, Du SJ: SmyD1, a histone
methyltransferase, is required for myofibril organization and muscle contraction in zebrafish embryos. Proc Natl Acad Sci
USA 2006, 103:2713-2718.
33. Takagi H, Tajima S, Asano A: Overexpression of DNA
methyl-transferase in myoblast cells accelerates myotube forma-tion. Eur J Biochem 1995, 231:282-291.
34. INRA-GADIE [http://www-crb.jouy.inra.fr]
35. Govoroun M, Legac F, Guiguen Y: Generation of a large scale
repertoire of Expressed Sequence Tags (ESTs) from rain-bow trout normalized cDNA libraries. BMC Genomics 2006, 7:196.
36. Rexroad CE 3rd, Lee Y, Keele JW, Karamycheva S, Brown G, Koop B, Gahr SA, Palti Y, Quackenbush J: Sequence analysis of a
rain-bow trout cDNA library and creation of a gene index.
Cytogenet Genome Res 2003, 102(1–4):347-354.
37. Lopez IP, Milagro FI, Marti A, Moreno-Aliaga MJ, Martinez JA, De Miguel C: Gene expression changes in rat white adipose tissue
after a high-fat diet determined by differential display.
Bio-chem Biophys Res Commun 2004, 318:234-239.
38. Sigenae. Sigenae [http://www.sigenae.org]
39. Swiss-Prot [http://www.expasy.org/sprot/]