HAL Id: ird-00759711
https://hal.ird.fr/ird-00759711v2
Submitted on 27 Nov 2017
HAL is a multi-disciplinary open access
archive for the deposit and dissemination of sci-entific research documents, whether they are pub-lished or not. The documents may come from teaching and research institutions in France or abroad, or from public or private research centers.
L’archive ouverte pluridisciplinaire HAL, est destinée au dépôt et à la diffusion de documents scientifiques de niveau recherche, publiés ou non, émanant des établissements d’enseignement et de recherche français ou étrangers, des laboratoires publics ou privés.
Patterns of genetic isolation in a widely distributed
pelagic fish, the narrow-barred Spanish mackerel
(Scomberomorus commerson)
Cécile Fauvelot, Philippe Borsa
To cite this version:
Cécile Fauvelot, Philippe Borsa. Patterns of genetic isolation in a widely distributed pelagic fish, the narrow-barred Spanish mackerel (Scomberomorus commerson). Biological Journal of the Linnean Society, Linnean Society of London, 2011, 104 (4), pp.886-902. �ird-00759711v2�
To be cited as:
FAUVELOT C.,BORSA P.2011.–Patterns of genetic isolation in narrow-barred Spanish mackerel (Scomberomorus commerson) across the Indo-West Pacific. Biological Journal of the Linnean Society 104, 886-902.
Patterns of genetic isolation in a widely distributed pelagic fish, the narrow-barred Spanish mackerel (Scomberomorus commerson)
CECILE FAUVELOT 1 and PHILIPPE BORSA 2*
1 Institut de recherche pour le développement - UR 227, DYNECAR, Laboratoire de Biologie Marine,
Université des Antilles et de la Guyane, Pointe-à-Pitre, 97159 Guadeloupe, France
2 Institut de recherche pour le développement - UR 227, Centre IRD de Montpellier, 911 avenue
Agropolis, 34032 Montpellier cedex, France
* Corresponding author. Tel.: +33 4 67636962; E-mail: philippe.borsa@ird.fr
Although migratory pelagic fishes generally exhibit little geographic differentiation across oceans, as expected from their life-history (broadcast spawning, pelagic larval life, swimming ability of adults) and the assumed homogeneity of the pelagic habitat, exceptions to the rule deserve scrutiny. One such exception is the narrow-barred Spanish mackerel (Scomberomorus commerson), where strong genetic heterogeneity at the regional scale has been previously reported. We investigated the genetic composition of S. commerson across the Indo-West Pacific range using control-region sequences (including previously published datasets), cytochrome-b gene partial sequences, and eight microsatellite loci, to further explore its phylogeographic structure. All haplotypes sampled from the Indo-Malay-Papua archipelago (IMPA) and the southwestern Pacific coalesced into a clade (Clade II) that was deeply separated (14.5% nucleotide divergence) from a clade grouping all haplotypes from the Persian Gulf and Oman Sea (Clade I). Such a high level of genetic divergence suggested the occurrence of two sister-species. Further phylogeographic partition was evident between the western IMPA and the regions sampled east and south of it, i.e. northern Australia, West Papua, and the Coral Sea. Strong allele-frequency differences were found between local populations in the southwestern Pacific, both at the mitochondrial locus (ΦST=0.282-0.609) and at microsatellite loci
(^θ=0.202-0.313). Clade II consisted of four deeply divergent subclades (9.0-11.8% nucleotide divergence for the control region; 0.3-2.5% divergence at the cytochrome b locus). Mitochondrial sub-clades within Clade II generally had narrow geographic distribution, demonstrating further genetic isolation. However, one particular haplogroup within Clade II was present throughout the central Indo-West Pacific; that haplogroup was found to be sister-group to an haplogroup restricted to West Papua and the Coral Sea, yielding evidence of recent secondary westward colonization. Such a complex structure is in sharp contrast with the generally weak phylogeographic patterns uncovered to date in other widely distributed, large pelagic fishes with pelagic eggs and larvae. We hypothesize that in S. commerson and possibly other
Scomberomorus species, philopatric migration may play a role in maintaining the geographic isolation of
populations by annihilating the potential consequences of passive dispersal.
ADDITIONAL KEYWORDS: phylogeography – mitochondrial lineages – microsatellites – Indo-West Pacific – philopatry
INTRODUCTION
Knowledge of population genetic structure and identification of barriers to gene flow in marine organisms are important to understanding genetic-differentiation and speciation processes in the sea. Apart from obvious barriers such as continents, potential barriers to gene flow in the sea include oceanic fronts, temperature and salinity barriers, oligotrophy (as a mortality factor in e.g. drifting larvae), and predation (Palumbi, 1994; Graves, 1998). Genetic differentiation between populations may also arise from spawning asynchrony among populations, retention of eggs and larvae, and adult homing behaviour (Taylor & Hellberg, 2003). An increasing number of marine taxa with high dispersal potential that were once thought to represent a single species distributed over several oceans (references in Briggs, 1960; Briggs, 1974) are now recognized as multiple species, thanks to the development of molecular methods (Knowlton, 1993, 2000; Colborn et al., 2001, and references therein).
Pelagic fishes generally exhibit little geographic differentiation across oceans (Theisen et al., 2008 and references therein), although a few exceptions have been reported (Perrin & Borsa, 2001; Rohfritsch & Borsa, 2005; Lu et al., 2006; Sulaiman & Ovenden, 2009). One such case is the narrow-barred Spanish mackerel (Scomberomorus commerson Lacepède 1800) where evidence of strong population structure has been reported (Buckworth et al., 2007) and where preliminary phylogeographic investigations have suggested a possible phylogeographic gap coinciding with Wallace‟s Line (Sulaiman & Ovenden, 2009). S. commerson is an inshore pelagic species capable of long migrations (Collette & Russo 1984). At the basis of important commercial, recreational and artisanal fisheries, the annual world catch of S. commerson has steadily increased from less than 70,000 tons in the seventies to over 220,000 tons in 2008 (FAO - Fisheries and Aquaculture Information and Statistics Service; http://www.fao.org/fishery/species/3280/en). Spanish mackerels (genus Scomberomorus) constitute the most speciose group in the family Scombridae (Collette & Russo, 1984). Eighteen species are currently recognized in that genus, the majority of which have a geographic distribution limited to a single ocean basin (Collette & Russo, 1984). The distribution of S.
commerson spans more than 160° longitude and 80° latitude in the Indo-West Pacific (Fig. 1) whereas all
other Scomberomorus species are distributed within 80° longitude and 80° latitude, and often much less (Collette & Russo, 1984). Therefore, the wide geographic distribution of S. commerson contrasts with that of all other species in the genus Scomberomorus. Since species in the genus Scomberomorus share a similar
morphology, similar ecological traits, and apparently similar abilities for migration, this contrast in their respective geographic distributions is remarkable. A possible explanation might be that S. commerson actually consists of two or more cryptic species, each with narrower geographic distribution. Significant morphometric differences have been noted between populations across the Indo-Pacific (Collette & Russo, 1984).
Although S. commerson is usually regarded as a highly migratory fish (Collette & Russo 1984, and references therein), significant allozyme-genetic differences have also been reported between populations at the regional scale. Three main stocks, centered on northern Australia, Papua New Guinea and Fiji (Shaklee, Phelps & Salini, 1990) and of a fourth stock off Queensland (J.B. Shaklee in Buckworth et al., 2007) have been delineated. Based on sequence polymorphism of the mitochondrial control region, Sulaiman & Ovenden (2009) hypothesized an east-west phylogeographic division within the IMPA. Conversely, no genetic differences were detected at the same locus, among samples from the Persian Gulf and the Oman Sea (Hoolihan, Anandh & van Herwerden, 2006).
So far, no population genetic study of S. commerson has covered a significant part of its distribution and, to our knowledge, no attempt has been made to combine the results from studies that shared the same genetic markers. The objective of the present paper is to investigate the phylogeography of S.
commerson at the scale of the Indo-West Pacific to: (1) test the east-west phylogeographical hypothesis of
Sulaiman & Ovenden (2009); and (2) examine the possible occurrence of additional distinct populations of
S. commerson, from the Persian Gulf to New Caledonia, that is, across over 120° (~71%) of its longitudinal
range. For this, we analyzed samples from the Indo-Malay-Papua archipelago (Java Sea, Bali, West Papua) and from New Caledonia using mitochondrial and nuclear genetic markers, and merged the resulting
dataset with previously published mitochondrial sequence datasets from the Persian Gulf and Oman Sea (Hoolihan, Anandh & van Herwerden, 2006) and from the central Indo-West Pacific (Sulaiman & Ovenden, 2009).
MATERIALS AND METHODS
SAMPLING
Fin clips were sampled from Scomberomorus commerson obtained from fishermen or from retailers at fish landing places in Indonesia (Java Sea, Bali), West Papua and New Caledonia (Fig. 1) in 2007-2009. The „Java Sea‟ sample (JAVA; N=4) was collected at the Muara Angke fish market, Jakarta; the „Bali‟ sample (BALI; N= 6), consisting of fish from the Bali Strait, was collected at the Jimbaran fish market, southern Bali; the „West Papua‟ sample (WPAP) consisted of 10 individuals fished in Raja Ampat waters and sold at the Sorong fish market, northwestern West Papua; the „New Caledonia‟ sample (NCAL) consisted of a total of N=194 individuals fished in the Belep islands in the northern lagoon of New Caledonia, and off Nepoui (northwestern lagoon of New Caledonia), Nouméa (southwestern lagoon) and Canala (eastern coast), all obtained from local fishermen. Fin clips were preserved in 95% ethanol and shipped to Perpignan, France, for analysis.
MOLECULAR ANALYSIS
Genomic DNA was isolated from fin clip using the Gentra Puregene tissue Kit (Qiagen, Germantown, USA) following the manufacturer‟s protocol. Amplification of the highly variable 5‟ end of the
mitochondrial control region (380-383 bp) was done by polymerase-chain reaction (PCR) using the universal CR-A (TTC CAC CTC TAA CTC CCA AAG CTA G) and CR-E (CCT GAA GTA GGA ACC AGA TG) primers (Lee et al., 1995). Each PCR was done in 25 L reaction mixture containing 1X PCR buffer (Promega Corporation, Madison, USA), 0.5 mM MgCl2, 0.08 mM of each dNTP, 0.2 M of each
primer, 0.5 U of GoTaqTM DNA Polymerase (Promega Corporation) and about 30 ng genomic DNA.
The amplification of the control-region fragment was achieved by 35 cycles of denaturation (30 s at 94°C), annealing (30 s at 51°C), and extension (1 min at 72°C).
A random subsample of individuals from the Java Sea (N=4), Bali (N=6), West Papua (N=7) and a subsample of New Caledonia (N=74; including individuals of Haplogroup ii and randomly chosen individuals representing each of the three sub-clades IIA, IIb and IId; see Results) were PCR-amplified for an additional 281-bp fragment of the cytochrome b gene, using primers CB1-L (5'
CCATCCAACATCTCAGCATGATGAAA 3') and modified CB2-H (5'
CCCTCAGAATGATATTGGTCCTCA 3') (Palumbi et al., 1991). The reaction mixture and PCR
parameters were the same as those used for the control region. PCR products were sent to GATC Biotech (Konstanz, Germany) for nucleotide sequencing: after purification, the PCR-amplified DNA fragments were sequenced using the CR-A primer (for the control-region fragment) or the CB1-L primer (for the cytochrome b gene fragment) and the sequence reaction products were run on an ABI 3730XL automated sequencer (Applied Biosystems, Foster City, USA). All nucleotide sequences were deposited in GenBank (http://www.ncbi.nlm.nih.gov/) under accession numbers HQ403255 to HQ403349 (cytochrome b) and HQ403350 to HQ403561 (control region).
We further amplified alleles at eight microsatellite loci specifically developed for S. commerson from the Persian Gulf and the Oman Sea (van Herwerden et al., 2006) in the individuals from Bali, Java, West Papua, and in a sub-sample of 66 randomly selected individuals from New Caledonia. Forward primers were labeled with ABI fluorescent dyes as follows: C83Sc / 6-FAM, L42Sc / 6-FAM, H96Sc / VIC, D61Sc / VIC, J43Sc / PET, E27Sc / PET, F6Sc / NED, J10Sc / NED. All eight microsatellite marker DNAs were amplified in a single 10 L multiplex PCR reaction using the Type-it Microsatellite PCR Kit (Qiagen) according to the manufacturer‟s protocol, and using an annealing temperature of 57°C.
sequencer, with a GeneScan® LIZ-500 internal size standard (Applied Biosystems). The GENEMAPPER
software (Applied Biosystems) was used to genotype all individuals screened. Finally, GMCONVERT
(Faircloth, 2006) was used to convert the GENEMAPPER table of genotypes into a GENEPOP (Raymond & Rousset, 1995) input file.
DATA ANALYSIS
Nucleotide sequences were aligned visually under BIOEDIT (Hall, 1999). A Median-joining parsimony analysis was performed using NETWORK (Bandelt, Forster & Röhl, 1999) on the nucleotide-sequence matrix of 454 individual control region haplotypes aligned over 310 bp, which comprised the 216 new sequences produced in this study, aligned with sequences available from the literature. The latter included the Persian Gulf / Oman Sea dataset of Hoolihan, Anandh & van Herwerden (2006) (193 sequences; GenBank AM234345-AM234537), the Indo-Malay dataset of Sulaiman & Ovenden (2009) (47 sequences re-constructed from their Table 1 and from the single GenBank sequence deposited by the authors, GenBank EU526382, identified by us as being that of haplotype ScPHI01), and two sequences from J.R. Ovenden and R. Street (in Buckworth et al., 2007), ScEC10 from eastern Australia (AY205242) and
ScNA12 from northern Australia (AY205243) which were added to Sulaiman & Ovenden‟s (2009)
samples „12‟ and „11‟, respectively. The root of the network was determined using an outgroup (S.
niphonius: GenBank nos. FJ69105-FJ659112) by maximum parsimony analysis in MEGA version 5 (Tamura et al., 2011). The choice of S. niphonius as outgroup was motivated by its close systematic proximity with S.
commerson (Collette & Russo, 1984) and by the availability of control-region sequences for this species in
GenBank.
To assess rates of genetic divergence between groups of lineages, nucleotide substitution models that best fit mitochondrial control-region and cytochrome b sequence data were tested using a model selection analysis based on the maximum-likelihood method implemented in MEGA. Evolutionary models of nucleotide substitution were different relative to mitochondrial DNA fragments. The tests revealed that the model that best fit the mitochondrial control-region data was HKY85 (Hasegawa, Kishino & Yano, 1985) with gamma correction and a heterogeneous proportion of invariable sites. However, because this model was not proposed in MEGA and ARLEQUIN version 3.11 (Excoffier, Laval & Schneider, 2005) for further analysis, we chose to use the second best fit, which was TN93 (Tamura & Nei, 1993) with gamma correction (G = 0.76) and a heterogeneous proportion of invariable sites (I = 0.42). The model that best fit the cytochrome b data was Kimura 2-paramaters (Kimura, 1980). Mean net nucleotide divergences, defined as dxy– 0.5 (dx+dy), that subtracts the average 'within group' divergence from the observed 'between group' estimate (Nei and Li, 1979) were then estimated using the appropriate nucleotide substitution model for each sequence set in MEGA. Finally, the Tamura 3-parameter model (Tamura, 1992) with a heterogeneous proportion of invariable sites (I = 0.84) was found to be the best fit for the merged (control region + cytochrome b gene) sequence dataset, i.e. composite haplotypes obtained by merging partial sequences of the cytochrome b gene and of the control region for samples from Java Sea, Bali and West Papua, and a subsample (N=74) from New Caledonia. The homologous haplotype in S. niphonius was obtained by merging the homologous sequences from GeneBank (cytochrome b: DQ497887; control region: FJ659108) and used as outgroup.
Genetic diversity within regions was estimated as haplotype diversity (Hd: Nei, 1987), nucleotide diversity (π: Nei, 1987), and the average number of nucleotide differences between two sequences (k, Tajima 1983) using DNASP version 5.10 (Librado & Rozas, 2009). Tajima‟s D tests (Tajima 1989) were conducted in DNASP by pooling samples within regions. Regions were defined on a geographical basis as follows: Persian Gulf + Oman Sea (samples AUH, BAH, DIB, IRN, KUW, OMN and RAK of Fig. 1); East China Sea (1); South China Sea + Malacca Strait (2-8); Java Sea + Bali (JAVA, BALI); Timor Sea + Arafura Sea (9-11); West Papua (WPAP); Coral Sea (12, NCAL). Observed haplotype diversities were compared to the empirical distribution of this index generated using coalescent simulations (H test; Depaulis & Veuille 1998), performed in DNASP. The computer simulations were based on the coalescent process for a neutral infinite-sites model under the assumption of a large constant population size
(Hudson 1990). DNASP generates the empirical distribution of Hd, obtained from 10 000 simulations under the neutral coalescent process and given the number of segregating sites observed in each sampled population (the model therefore considers that the number of segregating sites is fixed and that mutations are uniformly distributed, at random, along lineages). DNASP thus estimates the probability of obtaining lower or higher values of Hd, computed from the simulation (Hdsim), than the one observed in each
sample (Hdobs). These simulations were conducted within regions, pooling samples as described above.
Nucleotide-sequence divergences between populations were estimated using -statistics and the Tamura & Nei (1993) nucleotide substitution model with gamma correction (G=0.76) under ARLEQUIN
version 3.11 (Excoffier, Laval & Schneider, 2005). P-values were obtained using a non-parametric permutation procedure with 10,000 permutations on the original matrix of sequences. A hierarchical analysis of molecular variance (AMOVA: Excoffier, Smouse & Quattro, 1992) was performed using ARLEQUIN to examine the partitioning of the total variance among regional groups of samples. Significance of -statistics and associated variance components was tested by 10,000 random permutations.
For the microsatellite dataset, genetic diversity within samples was estimated at the eight loci as the observed (HO) and expected (HE) heterozygosities in GENETIX version 4.05 (Belkhir et al., 2004).
Deviations from Hardy-Weinberg (HW) equilibrium were estimated within and over all samples using Weir & Cockerham's (1984) inbreeding coefficient and departures from HW expectations were assessed using the permutation procedure in GENETIX. Null alleles were detected with MICRO-CHECKER (van Oosterhout et al., 2004). Pairwise genetic divergences among samples were estimated using multilocus Weir & Cockerham‟s (1984) estimator of FST (^θ), and their significance tested with 10,000 permutations
of individuals among samples in GENETIX. Correspondence analysis (Benzécri, 1973) was performed on the matrix of individual multilocus genotypes using GENETIX. The sequential Bonferroni correction (Rice, 1989) was applied for each test.
RESULTS
The length of the amplified mitochondrial DNA control-region fragment in samples JAVA, BALI,
WPAP and NCAL (total N=212) varied between 380 and 383 nucleotides. The nucleotide sequences
were unambiguously aligned over 385 bp. Those 212 sequences were then aligned with 242 control-region sequences available from the literature (see Material and Methods) producing a total dataset of 454
sequences aligned over 310 bp. We observed 119 variable nucleotide sites: 148 substitutions were counted, 19 of which were singletons. The G+C content was close to 30%. A total of 221 haplotypes were scored; total haplotype diversity was 0.959, nucleotide diversity was 0.088 and the average number of nucleotide differences between two haplotypes was 24.74.
The Median-joining parsimony network connecting all 221 control-region haplotypes is presented in Figure 2. Maximum parsimony analysis conducted using Scomberomorus niphonius sequences as outgroup placed the root of the network between a group comprising all haplotypes sampled in the Persian Gulf and the Oman Sea (hereafter designated as Clade I) and the rest of the samples (south-east Asia and Oceania: Clade II). Mean net divergence between Clade I and Clade II was 14.5 ± 3.0%. Clade II comprised four main sub-clades (hereafter named IIa, IIb, IIc and IId) radiating from a central, poorly defined group of haplotypes (here coined „Haplogroup ii‟ and delineated by dots on Figure 2) with no bootstrap support. Sub-clade IIa consisted of haplotypes exclusively found in New Caledonia. Sub-clade
IIb comprised haplotypes sampled exclusively in the Coral Sea and in West Papua. Sub-clade IIc comprised
haplotypes sampled exclusively in the East and South China Seas and adjacent Java Sea. Sub-clade IId comprised haplotypes exclusively from northern Australia and the Coral Sea. Haplotypes from the central Haplogroup ii were distributed from the South China Sea to New Caledonia and were dominant in the eastern part of the Indo-Malay-Papuan archipelago. Sub-clades IIa, IIc, and IId were strongly supported, with bootstrap scores from 81 to 98%. Sub-clade IIb was poorly supported statistically, presumably
because of the low number of mutations that separated it from the central Haplogroup ii. Nevertheless, Sub-clade IIb was distinct, as it mostly consisted of haplotypes arranged in a star-like fashion around a dominant haplotype.
Expanding the length of the mitochondrial fragment on a subsample of individuals allowed us to resolve the phylogenetic placement of haplotypes included in the above, undefined Haplogroup ii (Fig. 3). Clade II haplotypes thus clustered into four distinct sub-clades, namely IIa, (IIb+ii) (where Haplogroup ii appeared as a sister-branch to IIb), IIc and IId (Fig. 3). Mean net divergence between sub-clades, estimated from control-region nucleotide sequences, varied from 9.0 ± 2.3% (between Sub-clades IIa and IId), to 11.8 ± 2.8% (between Sub-clades IIa and IIc). Mean net divergence between subclades estimated from partial cytochrome b gene sequences alone ranged from 0.3 ± 0.3% (between sub-clades IIa and IId) to 2.5 ± 0.9% [between sub-clades (IIb+ii) and IIc].
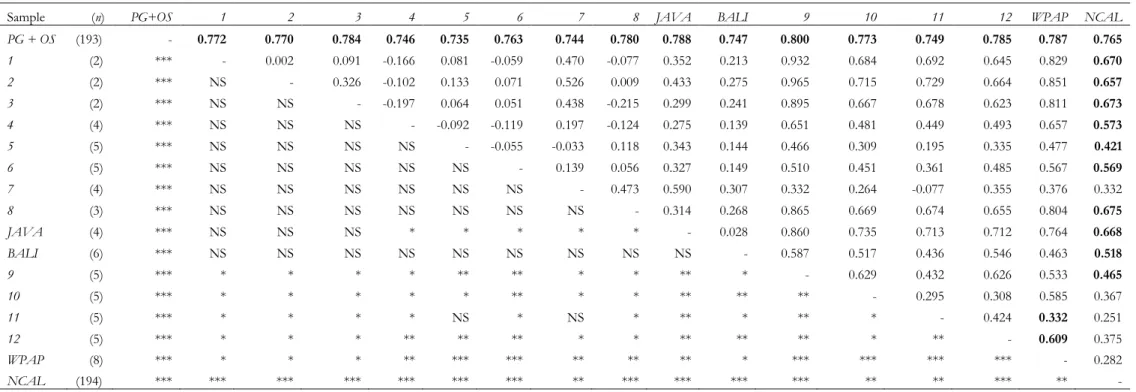
Genetic divergence estimates among sampling locations, expressed as pairwise ST, ranged from 0 to
0.965 (Table 1). Although, some pairwise ST estimates should be taken with caution because of low
sample sizes, e.g. between sample 2 from Thailand and sample 9 from Kupang, West Timor (ST=0.965),
generally high levels of genetic differentiation were observed between samples (Table 1). The Persian Gulf / Oman Sea samples were very distinct from all other samples (ST=0.735-0.800). Within the latter group,
the West Papuan and New Caledonian samples were themselves much differentiated from all the other samples (ST=0.251- 0.851). Pairwise ST estimates were also generally high within the Coral Triangle,
though not significant presumably because of low sample sizes. The AMOVA indicated that a large and highly significant proportion (75%) of the total mitochondrial variance resided among regions (Table 2). Excluding the East China Sea sample (because of its low size) and the Indian Ocean samples, the proportion of the total mitochondrial variance attributed among five geographically defined groups of samples across the Indo-Malay-Papuan archipelago and southwestern Pacific Ocean [(South China Sea + Malacca Strait); (Java Sea + Bali); (Timor Sea + Arafura Sea); West Papua; Coral Sea) was high (46%,
P<<0.001). A small but significant part of the total variance (1.23%) was observed within groups, while
26% of the total variance was attributed among individuals within samples (Table 2). Within
geographically defined regions, estimated haplotype diversity ranged from 0.82 in the Coral Sea to 1 in Java Sea/ Bali, and nucleotide diversity ranged from 0.023 in West Papua to 0.017 in the East China Sea (Table 3). The mean number of nucleotide differences between two sequences ranged from 6.72 in West Papua to 15.26 in South China Sea / Malacca Strait (Table 3). Most samples (here grouped by region) showed higher haplotype diversity than expected from the neutral coalescent theory on the basis of the number of observed segregating sites [Depaulis & Veuille‟s (1998) haplotype diversity test: Table 3], while none of them deviated from neutrality according to Tajima‟s D test (Table 3). Low sample sizes for some samples, or non-equilibrium conditions may explain this discrepancy.
Genetic diversity estimated from the analysis of the eight microsatellite loci is presented in Table 4. Average observed heterozygosity across all eight loci ranged from 0.521 in Bali to 0.571 in New Caledonia. The distribution of genotype frequencies at a locus did not differ significantly from Hardy-Weinberg expectations (standard Bonferroni correction applied) except sample NCAL at locus D61Sc (Weir & Cockerham‟s ^f = 0.639; P < 0.001). Null alleles were detected at loci D61Sc in New Caledonia, L42Sc in Bali and E27Sc in West Papua. The graphical illustration of the correspondence analysis conducted on microsatellite multilocus genotypes revealed geographic partition: individuals from West Papua and New Caledonia formed two completely disjunct clusters, themselves clearly separated from an ensemble including all individuals sampled in Bali and in the Java Sea (Figure 4). So, there was no evidence of interchange of individuals among sub-regions in the southwestern tropical Pacific. Estimates of Weir & Cockerham‟s parameter of genetic differentiation (θ) were ^θ =0.233 between Java/Bali and West Papua,
^θ =0.313 between Java/Bali and New Caledonia, and ^θ =0.202 between West Papua and New
Caledonia.
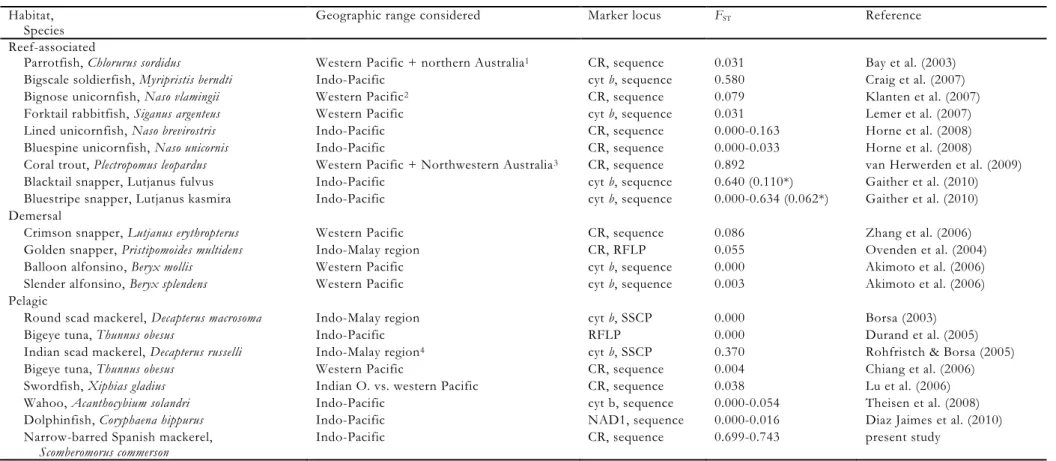
Phylogeographic breaks between Indian and western Pacific populations have been reported for several widely distributed Indo-Pacific species (Benzie, 1999; Barber, Erdmann & Palumbi, 2006; Kochzius & Nuryanto, 2008; Carpenter et al., 2011). Barriers to gene flow have been located within the Indo-Malay-Papuan archipelago (IMPA), although the precise location varies extensively across species (Carpenter et al., 2011). In fishes, phylogeographic studies spanning the IMPA have shown evidence of sub-division between Indian Ocean vs. Pacific Ocean populations in a number of benthic shore species (e.g. Lourie, Green & Vincent, 2005; Drew & Barber, 2009; Carpenter et al., 2011) but not in others (e.g. Stepien, Randall & Rosenblatt, 1994; Klanten, van Herwerden & Choat, 2007; Horne et al., 2008; Gaither et al., 2010; Winters et al., 2010). Since, unlike most benthic fishes, pelagic fishes add extreme adult mobility to passive dispersal at the larval and juvenile stages, it is appropriate to consider them separately: genetic studies of large pelagic fishes such as tunas, wahoo and swordfish have not yielded conclusive evidence of geographic partition across the Indo- Pacific (Alvarado-Bremer et al., 1998; Chow & Takeyama, 2000; Durand et al., 2005; Ely et al., 2005; Gonzales, Beerli & Zardoya, 2008; Theisen et al., 2008; Diaz Jaimes et al., 2010), whereas contrasted patterns have been found in small inshore pelagic fishes like scad mackerels (genus Decapterus; Carangidae), from broadscale geographic homogeneity (D. macrosoma: Borsa, 2003) to sharp population partition (D. russelli: Rohfritsch & Borsa, 2005) within the Indo-Malay-Papua
archipelago. A summary of genetic- differentiation index estimates in broadcast-spawning Indo-West Pacific bony fishes of various habitats is presented in Table 5. The level of geographic differentiation in S.
commerson is much higher than all other pelagic species studied so far, with the possible exception of Decapterus russelli, and it is matched only by rare examples of benthic shore species (Table 5).
DISTANT MITOCHONDRIAL CLADES I AND II INDICATE CRYPTIC SPECIES
Here, deep phylogeographic partition was observed between the Scomberomorus commerson population sampled in the Persian Gulf and the Oman Sea, and those populations sampled in the Indo-Malay-Papua archipelago and in the western Pacific. The 14.5% control-region sequence divergence observed between Clade I and Clade II and its correlation with geography indicate a clear separation between a northwestern Indian Ocean (Persian Gulf / Oman Sea) form of narrow-barred Spanish mackerel, and a western Pacific Ocean form. This level of nucleotide divergence is higher than inter-specific sequence divergences estimated using the same genetic marker between blue and chub mackerels (genus Scomber; Scombridae) (1.7-9.6%: Catanese, Manchado & Infante, 2010), among scad mackerels (genus Decapterus, Carangidae) (2.7-11.7%: Arnaud, Bonhomme & Borsa, 1999) and among horse mackerels (genus Trachurus,
Carangidae) (1.0-9.6%: Cárdenas et al., 2005). It is also higher than inter-specific genetic divergences for benthic species, e.g. damselfishes (10.1-12.8%; Timm, Figiel & Kochzius, 2008; Bernardi et al., 2002) and more generally higher than genetic divergence at the inter-specific level in fishes (McCune & Lovejoy, 1998; Lessios, 2008).
The present results suggest that the S. commerson form sampled in the Indo-Malay-Papua archipelago and in the western Pacific Ocean is a species different from that sampled in the Persian Gulf and the Oman Sea. The relatively large differences in morphology and in meristic characters reported between S.
commerson sampled in the Indian Ocean and those from the „East Indies‟ (Collette & Russo, 1984; their
table 15), are consistent with this hypothesis. Therefore, the large distribution of S. commerson, an exception among species of that genus, might well be an artefact that results from the taxonomic confusion of cryptic species.
PHYLOGEOGRAPHIC BREAK WITHIN THE INDO-MALAY-PAPUA ARCHIPELAGO AND FURTHER PARTITIONING AT THE REGIONAL SCALE
Further phylogeographic partition was found within the western Pacific Ocean form of S. commerson. Clade
II haplotypes, which characterize that form, clustered into four distinct sub-clades separated by 0.3-2.5%
net nucleotide divergence at the cytochrome b locus and 9.0-11.8% for control region. Sub-clade IIc was exclusively found, and dominant, in the western half of the Indo-Malay-Papua archipelago (i.e. west to a
line running from Timor to West Papua), whereas Sub-clades IIa, and IId were exclusively found east and south of a line running from Bali to the Philippines. The root of the cytochrome b tree presented in Figure 3 was between Sub-clade IIc and the rest, suggesting that the genetic differences between S. commerson populations of the western half of the Indo-Malay-Papua archipelago and those east and south of it result from vicariance. Sub-clade IIa was sampled in New Caledonia only, which suggests that it may be endemic to New Caledonia, or at least geographically restricted to the southeastern extremity of the range of S.
commerson. The remaining sub-clade, (IIb+ii), itself consisted of two sister-branches (hereafter „Branch IIb‟
and „Haplogroup ii‟) with different geographic distributions. Branch IIb was dominant in New Caledonia and it was also found in West Papua and in northern Australia. In contrast, Haplogroup ii haplotypes were found throughout the Indo-Malay-Papua archipelago and the western Pacific Ocean.
The distinctness of S. commerson populations from New Caledonia and West Papua was further demonstrated by the strong pairwise divergence estimate over eight microsatellite loci. We are aware of a few genetic studies in other species of the genus Scomberomorus that can be used as a basis of comparison with the present results in S. commerson at the regional scale (Table 6). Observed FST -estimates between
populations at the regional scale in S. commerson were considerably higher (one order of magnitude for nuclear loci) than those estimated for any other Scomberomorus species. This indicated that very little, if any gene flow connects S. commerson populations in the tropical southwestern Pacific Ocean. Interestingly, FST
estimates at the same microsatellite loci within S. commerson sampled in the Persian Gulf and in the Oman Sea were relatively low (range 0-0.078), though sampled over geographic distances similar to that between Bali and West Papua (van Herwerden et al., 2006).
The clover-like structure of Clade II and its relationship to the geographic distribution of haplotypes imply that western Pacific S. commerson populations have been isolated from each other for a period of time long enough to achieve reciprocal monophyly. The geographic distribution of haplotypes correlates with their phylogenetic structure, with the exception of Haplogroup ii haplotypes. A possible explanation to that intriguing pattern is that a proto-Haplogroup ii population initially restricted to the eastern part of the distribution of S. commerson secondarily diffused westward to colonize the entire Indo-Malay-Papua archipelago, where it entered into secondary contact with populations harbouring Sub-clade
IIc haplotypes. The question that follows is whether those two branches are reproductively isolated from
each other.
TESTING FOR REPRODUCTIVE ISOLATION
It is possible to test for reproductive isolation between groups of individuals that harbour different mitochondrial types by using nuclear markers, when those groups also happen to occur in sympatry. Microsatellite genotypes were available for three S. commerson samples (BALI, WPAP and NCAL) with a heterogeneous mitochondrial composition. Heterozygote deficiency was effectively observed at one locus in the NCAL sample, but this was ascribed to null alleles. Therefore, there was no conclusive evidence from microsatellites that the groups of individuals characterized by different Clade-II mitochondrial lineages at a given location belong to separate gene pools: hence, one cannot reject the hypothesis that they belong to the same one species, but larger sample sizes of both individuals and loci are needed to further explore the question of reproductive isolation in western Pacific S. commerson.
It is generally hypothesized that highly divergent intra-specific lineage originate either from recent admixture of formerly isolated populations or from hybridization and introgression of mtDNA from one species into another (Avise et al., 1987). The co-occurrence of discontinuous mtDNA lineages at a given geographic site (“Category II” of Avise et al., 1987) is not common. This has nevertheless been observed in two other Scombridae species, the bigeye tuna Thunnus obesus (Durand et al., 2005; Gonzales, Beerli & Zardoya, 2008) and the carite, Scomberomorus brasiliensis (Gold et al., 2010) as well as a few other pelagic fishes (Magoulas et al. 1996; Rosel & Block, 1996; Nesbø et al., 2000; Graves & McDowell, 2003; Viñas, Alvarado Bremer & Pla, 2004; Rohfritsch & Borsa, 2005), and generally is thought to result from secondary contact between formerly geographically isolated populations, although the alternative hypothesis of sympatric divergence has been also proposed. Assuming a mutation rate of approximately
10% per million years for the control-region (Bowen et al., 2006), intraspecific net divergences among sub-clades within western Pacific S. commerson (9.0% to 11.8%) would imply that the lineages started to diverge between ca. 450,000 and ca. 590,000 years ago. This dating designates the lowering of sea level within the last five or six Milankovitch glacial cycles as a possible cause for the geographic isolation of S.
commerson populations in the Indo-West Pacific region. Secondary contact would have occurred during one
or another of the subsequent rises in sea level.
DO MIGRATORY CAPABILITIES ENHANCE GEOGRAPHIC STRUCTURE IN S. COMMERSON? The present survey of genetic variation in S. commerson revealed deeply divergent mitochondrial clades associated with strong geographic structure at both mitochondrial and nuclear-DNA loci, not only at the scale of the geographic distribution of the species, but also at the regional scale. At the Indo-Pacific scale, highly divergent clades in S. commerson and correlated morphological differences are indicative of cryptic species. At the regional scale, our results showed the occurrence of independent populations within the Indo-Malay-Papua archipelago, confirming Sulaiman and Ovenden‟s (2009) preliminary results, and also within the southwestern Pacific region. Despite having a pelagic lifestyle in both adults and larvae, the degree of geographic differentiation in S. commerson was much higher than generally observed in pelagic species, with the notable exceptions of Decapterus russelli (Table 5). In particular, this degree of geographic partition contrasts with the patterns generally observed in other Scomberomorus species, where little or no genetic variation has been detected distribution-wide (Table 6). Although genetic differences were evident between populations of both S. munroi and S. queenslandicus sampled along the northeastern Australian shores (Begg, Keenan & Sellin, 1998), the magnitude of those differences as expressed by Wright‟s Fst, was the same as that in S. commerson sampled in the Persian Gulf and Oman Sea, but still one order lower than Fst values for S. commerson in the tropical southwestern Pacific (Table 6).
It might be sensible to assume that the extreme migrating ability of pelagic fishes entail wide-scale geographic homogeneity in allele frequencies. Although S. commerson occurs in inshore waters and presumably does not cross large expanses of ocean as do tunas and billfishes, the level of geographic difference observed at the regional scale in S. commerson (present results) is striking: this suggests that migrating ability might rather be associated with increased potential for homing, hence for reproductive isolation.
ACKNOWLEDGEMENTS
We thank P.H. Barber and J.R. Ovenden for encouragement and stimulating discussions, and two anonymous referees for improvement of the final version. Samples from New Caledonia were provided by our colleagues M. Leopold and D. Ponton. V.P. Buonaccorsi kindly provided the original Fst values for
S. maculatus. Funded by UR 128 and UR 227 of Institut de recherche pour le développement and by
Programme d‟évaluation des ressources marines de la zone économique exclusive de Nouvelle-Calédonie (ZoNéCo), Nouméa, New Caledonia.
REFERENCES
Akimoto S, Itoi S, Sezaki S, Borsa P, Watabe S. 2006. Identification of alfonsino Beryx species collected in Japan based on the mitochondrial cytochrome b gene and their comparison with those collected in New Caledonia. Fisheries Science 72: 202-207.
Alvarado Bremer JR, Stequert B, Robertson NW, Ely B. 1998. Genetic evidence for inter-oceanic
Arnaud S, Bonhomme F, Borsa P. 1999. Mitochondrial DNA analysis of the genetic relationships
among populations of scad mackerel (Decapterus macarellus, D. macrosoma and D. russelli) in South-East Asia. Marine Biology 13: 699–707.
Avise JC, Arnold J, Ball RM, Bermingham E, Lamb T, Neigel JE, Reeb CA, Saunders NC. 1987.
Intraspecific phylogeography: the mitochondrial DNA bridge between population genetics and systematics. Annual Review of Ecology and Systematics 18: 489–522.
Bandelt HJ, Forster P, Röhl A. 1999. Median-joining networks for inferring intraspecific phylogenies.
Molecular Biology and Evolution 16: 37-48.
Barber PH, Erdmann MV, Palumbi SR. 2006. Comparative phylogeography of three codistributed
stomatopods: origins and timing of regional lineage diversification in the coral triangle. Evolution 60: 1825-1839.
Bay LK, Choat JH, van Herwerden L, Robertson DR. 2003. High genetic diversities and complex
genetic structure in an Indo-Pacific tropical reef fish (Chlorurus sordidus): evidence of an unstable evolutionary past? Marine Biology 144: 757-767.
Begg GA, Keenan CP, Sellin MJ. 1998. Genetic variation and stock structure of school mackerel and
spotted mackerel in northern Australian waters. Journal of Fish Biology 53: 543–559.
Belkhir K, Borsa P, Chikhi L, Raufaste N, Bonhomme F. 2004. GENETIX 4.05, Logiciel sous WINDOWSTM pour la Génétique des Populations. Laboratoire Génome, Populations, Interactions, CNRS
UMR 5000, Université Montpellier 2, Montpellier (France).
Benzécri J-P. 1973. L'Analyse des Données. Dunod, Paris.
Benzie JAH. 1999. Major genetic differences between crown-of-thorns starfish (Acanthaster planci)
populations in the Indian and Pacific Oceans. Evolution 53: 1782–1795.
Bernardi G, Holbrook SJ, Schmitt RJ, Crane NL, DeMartini E. 2002. Species boundaries,
populations, and colour morphs in the coral reef three-spot damselfish (Dascyllus trimaculatus) species-complex. Proceedings of the Royal Society of London B 269: 599-605.
Borsa P. 2003. Genetic structure of round scad mackerel Decapterus macrosoma (Carangidae) in the
Indo-Malay archipelago. Marine Biology 142: 575-581.
Bowen BW, Muss A, Rocha LA, Grant WS. 2006. Shallow mtDNA coalescence in Atlantic pygmy
angelfishes (genus Centropyge) indicates a recent invasion from the Indian Ocean. Journal of Heredity 97: 1– 12.
Briggs JC. 1960. Fishes of worldwide (circumtropical) distribution. Copeia 1960: 171–180. Briggs JC. 1974. Marine Zoogeography. McGraw-Hill, New York.
Broughton RE, Stewart LB, Gold JR. 2002. Microsatellite variation suggests substantial gene flow
between king mackerel (Scomberomorus cavalla) in the western Atlantic Ocean and Gulf of Mexico. Fisheries
Research 54: 305-316.
Buckworth RC, Newman SJ, Ovenden JR, Lester RJG, McPherson, GR. 2007. The stock structure
of northern and western Australian Spanish mackerel. Final report, Fisheries Research & Development Corporation Project 1998/159. Department of Primary Industry, Fisheries and Mines, Northern Territory Government, Australia. Fishery Report 88: i-vi, 225 p.
Buonaccorsi VP, Starkey E, Graves JE. 2001. Mitochondrial and nuclear DNA analysis of population
subdivision among young-of-the-year Spanish mackerel (Scomberomorus maculatus) from the western Atlantic and Gulf of Mexico. Marine Biology 138: 37-45.
Cárdenas L, Hernández CE, Poulin E, Magoulas A, Kornfield I, Ojeda FP. 2005. Origin,
diversification, and historical biogeography of the genus Trachurus (Perciformes: Carangidae). Molecular
Phylogenetics and Evolution 35: 496–507.
Carpenter KE, Niem VH (eds). 2001. FAO species identification guide for fishery purposes. The living
marine resources of the Western Central Pacific. Volume 6. Bony fishes part 4 (Labridae to
Latimeriidae), estuarine crocodiles, sea turtles, sea snakes and marine mammals. Rome, FAO. 2001. pp. 3381-4218.
Carpenter KE, Barber PH, Crandall ED, Ablan-Lagman MCA, Ambariyanto, Mahardika GN, Manjaji-Matsumoto BM, Juinio-Meñez MA, Santos MD, Starger CJ, Toha AHA. 2011.
Comparative phylogeography of the Coral Triangle and implications for marine management. Journal of
Marine Biology 2011: 396982, 14 pp.
Catanese G, Manchado M, Infante C. 2010. Evolutionary relatedness of mackerels of the genus Scomber
based on complete mitochondrial genomes: Strong support to the recognition of Atlantic Scomber colias and Pacific Scomber japonicus as distinct species. Gene 452: 35-43.
Chiang HC, Hsu CC, Lin HD, Ma GC, Chiang TY, Yang HY. 2006. Population structure of bigeye
tuna (Thunnus obesus) in the South China Sea, Philippine Sea and western Pacific Ocean inferred from mitochondrial DNA. Fisheries Research 79: 219-225.
Chow S, Takeyama H. 2000. Nuclear and mitochondrial DNA analyses reveal four genetically separated
breeding units of the swordfish. Journal of Fish Biology 56: 1087-1098.
Colborn J, Crabtree RE, Shaklee JB, Pfeiler E, Bowen BW. 2001. The evolutionary enigma of
bonefishes (Albula spp.): Cryptic species and ancient separations in a globally distributed shorefish.
Evolution 55: 807-820.
Collette BB, Russo JL. 1984. Morphology, systematics, and biology of the Spanish mackerels
(Scombridae). Fishery Bulletin 82: 545-692.
Craig MT, Eble JA, Bowen BW, Robertson DR. 2007. High genetic connectivity across the Indian and
Pacific Oceans in the reef fish Myripristis berndti (Holocentridae). Marine Ecology-Progress Series 334: 245– 254.
Depaulis F, Veuille M. 1998. Neutrality tests based on the distribution of haplotypes under an
infinite-site model. Molecular Biology and Evolution 15: 1788-1790.
Diaz Jaimes P, Uribe Alcocer M, Rocha Olivares A, Garcia de León FJ, Nortmoon P, Durand J-D. 2010. Global phylogeography of the dolphinfish (Coryphaena hippurus): the influence of large effective
population size and recent dispersal on the divergence of a marine pelagic cosmopolitan species.
Molecular Phylogenetics and Evolution 57: 1209–1218.
Domínguez López M, Uribe Alcocer M, Díaz Jaimes P. 2010. Phylogeography and historical
demography of the Pacific Sierra mackerel (Scomberomorus sierra) in the Eastern Pacific. BMC Genetics 11: 34.
Drew J, Barber PH. 2009. Sequential cladogenesis of the reef fish Pomacentrus moluccensis (Pomacentridae)
supports the peripheral origin of marine biodiversity in the Indo-Australian archipelago. Molecular
Phylogenetics and Evolution 53: 335-339.
Durand J-D, Collet A, Chow S, Guinand B, Borsa P. 2005. Nuclear and mitochondrial DNA markers
indicate unidirectional gene flow of Indo-Pacific to Atlantic bigeye tuna (Thunnus obesus) populations, and their admixture off southern Africa. Marine Biology 147: 313-322.
Ely B, Viñas J, Alvarado Bremer JR, Black D, Lucas L, Covello K, Labrie AV, Thelen E. 2005.
Consequences of the historical demography on the global population structure of two highly migratory cosmopolitan marine fishes: the yellowfin tuna (Thunnus albacares) and the skipjack tuna (Katsuwonus
pelamis). BMC Evolutionary Biology 5: 19.
Excoffier L, Smouse P, Quattro J. 1992. Analysis of molecular variance inferred from metric distances
among DNA haplotypes: application to human mitochondrial DNA restriction data. Genetics 131: 479– 491.
Excoffier L, Laval G, Schneider S. 2005. ARLEQUIN ver. 3.0: An integrated software package for population genetics data analysis. Evolutionary Bioinformatics Online 1: 47-50.
Faircloth BC. 2006. GMCONVERT: file conversion for GENEMAPPER output files. Molecular Ecology Notes
6: 968-970.
Gaither MR, Toonen RJ, Robertson DR, Planes S, Bowen BW. 2010. Genetic evaluation of marine
biogeographic barriers: perspectives from two widespread Indo-Pacific snappers (Lutjanus kasmira and
Gold JR, Jobity AMC, Saillant E, Renshaw MA. 2010. Population structure of carite (Scomberomorus
brasiliensis) in waters offshore of Trinidad and northern Venezuela. Fisheries Research 103: 30-39.
Gold JR, Kristmundsdóttir ÁY, Richardson LR. 1997. Mitochondrial DNA variation in king mackerel
(Scomberomorus cavalla) from the western Atlantic Ocean and Gulf of Mexico. Marine Biology 129:221–223.
Gold JR, Pak E, DeVries DA. 2002. Population structure of king mackerel (Scomberomorus cavalla) around
peninsular Florida, as revealed by microsatellite DNA. Fishery Bulletin 100: 491-509.
Gonzalez EG, Beerli P, Zardoya R. 2008. Genetic structuring and migration patterns of Atlantic bigeye
tuna, Thunnus obesus (Lowe, 1839). BMC Evolutionary Biology 8: 252.
Graves JE. 1998. Molecular insights into the population structures of cosmopolitan marine fishes. Journal
of Heredity 89: 427-437.
Graves JE, McDowell JR. 2003. Stock structure of the world‟s istiophorid billfishes: a genetic
perspective. Marine and Freshwater Research 54: 287-298.
Hall TA. 1999. BIOEDIT: a user-friendly biological sequence alignment editor and analysis program for Windows 95/98/NT. Nucleic Acids Symposium Series 41: 95-98.
Hasegawa M, Kishino K, Yano T. 1985. Dating the human-ape splitting by a molecular clock of
mitochondrial DNA. Journal of Molecular Evolution 22: 160-174.
Hoolihan JP, Anandh P, van Herwerden L. 2006. Mitochondrial DNA analyses of narrow-barred
Spanish mackerel (Scomberomorus commerson) suggest a single genetic stock in the ROPME sea area (Arabian Gulf, Gulf of Oman, and Arabian Sea). ICES Journal of Marine Science 63: 1066-1074.
Horne JB, van Herwerden L, Choat HJ, Robertson DR. 2008. High population connectivity across
the Indo- Pacific: congruent lack of phylogeographic structure in three reef fish congeners. Molecular
Phylogenetics and Evolution 49: 629–638.
Hudson RR. 1990. Gene genealogies and the coalescent process. Pp. 1-44 in D Futuyma and J
Antonovics. Oxford surveys in evolutionary biology. Oxford University Press, Oxford.
Kimura M. 1980. A simple method for estimating evolutionary rate of base substitutions through
comparative studies of nucleotide sequences. Journal of Molecular Evolution 16: 111-120.
Klanten SO, van Herwerden L, Choat JH. 2007. Extreme genetic diversity and temporal rather than
spatial partitioning in a widely distributed coral reef fish. Marine Biology 150: 659–670.
Knowlton N. 1993. Sibling species in the sea. Annual Review of Ecology and Systematics 24: 189–216.
Knowlton N. 2000. Molecular genetic analyses of species boundaries in the sea. Hydrobiologia 420:73-90. Kochzius M, Nuryanto A. 2008. Strong genetic population structure in the boring giant clam, Tridacna
crocea, across the Indo-Malay Archipelago: implications related to evolutionary processes and
connectivity. Molecular Ecology 17: 3775–3787
Lee W, Conroy J, Howell WH, Kocher TD. 1995. Structure and evolution of teleost mitochondrial
control region. Journal of Molecular Evolution 41: 54-66.
Lessios HA. 2008. The great American schism: divergence of marine organisms after the rise of the
Central American Isthmus. Annual Review of Ecology, Evolution, and Systematics 39: 63–91.
Librado P, Rozas J. 2009. DNASP v5: A software for comprehensive analysis of DNA polymorphism data. Bioinformatics 25: 1451-1452.
Lourie SA, Green DM, Vincent AC. 2005. Dispersal, habitat differences, and comparative
phylogeography of Southeast Asian seahorses (Syngnathidae: Hippocampus). Molecular Ecology 14: 1073-1094.
Lu CP, Chen CA, Hui C, Tzeng T, Yeh S. 2006. Population genetic structure of the swordfish, Xiphias
gladius, in the Indian Ocean and West Pacific inferred from the complete DNA sequence of the
mitochondrial control region. Zoological Studies 45: 269–279.
Magoulas A, Tsimenides N, Zouros E. 1996. Mitochondrial DNA phylogeny and the reconstruction
of the population history of a species: the case of the European anchovy (Engraulis encrasicolus). Molecular
McCune AR, Lovejoy NR. 1998. The relative rate of sympatric and allopatric speciation in fishes: tests
using DNA sequence divergence between sister species and among clades. In Endless forms (ed. D. J. Howard & S. H. Berlocher), pp. 172-185. New York: Oxford University Press.
Nei M. 1987. Molecular evolutionary genetics. Columbia University Press, New York
Nei M, Li W-H. 1979. Mathematical model for studying genetic variation in terms of restriction
endonucleases. Proceedings of the National Academy of Sciences of the USA 76: 5269–5273.
Nesbø CL, Rueness EK, Iversen SA, Skagen DW, Jakobsen KS. 2000. Phylogeography and
population history of Atlantic mackerel (Scomber scombrus L.): a genealogical approach reveals genetic structuring among the eastern Atlantic stocks. Proceedings of the Royal Society of London B 267: 281–292.
Ovenden JR, Salini J, O'Connor S, Street R. 2004. Pronounced genetic population structure in a
potentially vagile fish species (Pristipomoides multidens, Teleostei : Perciformes : Lutjanidae) from the East Indies triangle. Molecular Ecology 13: 1991-1999.
Palumbi SR. 1994. Genetic divergence, reproductive isolation, and marine speciation. Annual Review of
Ecology and Systematics 25: 547-572.
Palumbi S, Martin A, Romano S, McMillan WO, Stice L, Grabowski G. 1991. The simple fool‟s
guide to PCR, version 2.0. Department of Zoology and Kewalo Marine Laboratory, University of Hawaii, Honolulu.
Perrin C, Borsa P. 2001. Mitochondrial DNA analysis of the geographic structure of Indian scad
mackerel, Decapterus russelli (Carangidae) in the Indo-Malay archipelago. Journal of Fish Biology 59: 1421– 1426.
Raymond M, Rousset F. 1995. GENEPOP (version 1.2): a population genetics software for exact test
and ecumenicism. Journal of Heredity 86: 248–249.
Rice WR. 1989. Analyzing tables of statistical tests. Evolution 43: 223–225.
Rohfritsch A, Borsa P. 2005. Genetic structure of Indian scad mackerel Decapterus russelli: Pleistocene
vicariance and secondary contact in the Central Indo-West Pacific Seas. Heredity 95: 315-326.
Rosel PE, Block BA. 1996. Mitochondrial control region variability and global population structure in
the swordfish, Xiphias gladius. Marine Biology 125:11–22.
Shaklee JB, Phelps SR, Salini J. 1990. Analysis of fish stock structure and mixed-stock fisheries by the
electrophoretic characterization of allelic isozymes. In 'Application of electrophoretic and isoelectric focusing techniques in fisheries management'. (Ed. D.H. Whitmore) pp. 173-196. (CRC Press: Boca Raton).
Shui BN, Han ZQ, Gao TX, Miao ZQ, Yanagimoto T. 2009. Mitochondrial DNA variation in the
East China Sea and Yellow Sea populations of Japanese Spanish mackerel Scomberomorus niphonius.
Fisheries Science 75: 593-600.
Sokal RR, Rohlf FJ. 1969. Biometry. Freeman and Co, San Francisco.
Stepien CA, Randall JE, Rosenblatt RH. 1994. Genetic and morphological divergence of a
circumtropical complex of goatfishes: Mulloidichthys vanicolensis, M. dentatus, and M. martinicus. Pacific Science
48: 44-56.
Sulaiman ZH, Ovenden JR. 2009. Population genetic evidence for the east-west division of the
narrow-barred Spanish mackerel (Scomberomorus commerson, Perciformes: Teleostei) along Wallace's Line.
Biodiversity and Conservation 19: 563-574.
Tajima F. 1983. Evolutionary relationship of DNA sequences in finite populations. Genetics 105: 437–460. Tajima F. 1989. Statistical method for testing the neutral mutation hypothesis by DNA polymorphism.
Genetics 123: 585–595.
Tamura K. 1992. Estimation of the number of nucleotide substitutions when there are strong
transition-transversion and G+C-content biases. Molecular Biology and Evolution 9: 678-687.
Tamura K, Nei M. 1993. Estimation of the number of nucleotide substitutions in the control region of
Tamura K, Peterson D, Peterson N, Stecher G, Nei M, Kumar S. 2011. MEGA 5: Molecular
evolutionary genetics analysis using maximum likelihood, evolutionary distance, and maximum parsimony methods. Molecular Biology and Evolution (in press)
Taylor MS, Hellberg ME. 2003. Genetic Evidence for Local Retention of Pelagic Larvae in a Caribbean
Reef Fish. Science 299: 107-109.
Theisen TC, Bowen BW, Lanier W, Baldwin JD. 2008. High connectivity on a global scale in the
pelagic wahoo, Acanthacybrium solandri (tuna family Scombridae). Molecular Ecology 17: 4233–4247.
Timm J, Figiel M, Kochzius M. 2008. Contrasting patterns in species boundaries and evolution of
anemonefishes (Amphiprioninae, Pomacentridae) in the centre of marine biodiversity. Molecular
Phylogenetics and Evolution 49: 268–276.
van Herwerden L, McIlwain J, Al-Oufi H, Al-Amry W, Reyes A. 2006. Development and application
of microsatellite markers for Scomberomorus commerson (Perciformes; Teleostei) to a population genetic study of Arabian Peninsula stocks. Fisheries Research 79: 258-266.
van Herwerden L, Choat JH, Newman SJ, Leray M, Hillersøy G. 2009. Complex patterns of
population structure and recruitment of Plectropomus leopardus (Pisces: Epinephelidae) in the Indo-West Pacific: implications for fisheries management. Marine Biology 156: 1595-1607.
van Oosterhout C, Hutchinson WF, Wills DPM, Shipley P. 2004. MICRO-CHECKER: software for identifying and correcting genotyping errors in microsatellite data. Molecular Ecology Notes 4: 535-538.
Viñas J, Alvarado Bremer JR, Pla C. 2004. Inter-oceanic genetic differentiation among albacore
(Thunnus alalunga) populations. Marine Biology 145: 225-232.
Weir BS, Cockerham CC. 1984. Estimating F-statistics for the analysis of population structure. Evolution 38: 822–831.
Winters KL, van Herwerden L, Choat JH, Robertson DR. 2010. Phylogeography of the Indo-Pacific
parrotfish Scarus psittacus: isolation generates distinctive peripheral populations in two oceans. Marine
Table 1. Pairwise ST estimates based on sequences of the 5‟end mitochondrial control region among narrow-barred Spanish mackerel (Scomberomorus commerson) samples (above diagonal). Super-sample „Persian
Gulf+Oman Sea‟ (PG+OS) comprises samples AUH, BAH, DIB, IRN, KUW, OMN and RAK of Hoolihan, Anandh & van Herwerden (2006); samples 1-12 as in Sulaiman & Ovenden (2009); else: see Fig. 1. n, number of sequences (in brackets). Significance levels (based on 10,000 permutations of haplotypes among samples) are indicated below diagonal: NS non significant; * P<0.05; ** P<0.010; *** P<0.001. Above diagonal, bold: values remaining significant after sequential Bonferroni correction (Rice 1989)
Sample (n) PG+OS 1 2 3 4 5 6 7 8 JAVA BALI 9 10 11 12 WPAP NCAL
PG + OS (193) - 0.772 0.770 0.784 0.746 0.735 0.763 0.744 0.780 0.788 0.747 0.800 0.773 0.749 0.785 0.787 0.765 1 (2) *** - 0.002 0.091 -0.166 0.081 -0.059 0.470 -0.077 0.352 0.213 0.932 0.684 0.692 0.645 0.829 0.670 2 (2) *** NS - 0.326 -0.102 0.133 0.071 0.526 0.009 0.433 0.275 0.965 0.715 0.729 0.664 0.851 0.657 3 (2) *** NS NS - -0.197 0.064 0.051 0.438 -0.215 0.299 0.241 0.895 0.667 0.678 0.623 0.811 0.673 4 (4) *** NS NS NS - -0.092 -0.119 0.197 -0.124 0.275 0.139 0.651 0.481 0.449 0.493 0.657 0.573 5 (5) *** NS NS NS NS - -0.055 -0.033 0.118 0.343 0.144 0.466 0.309 0.195 0.335 0.477 0.421 6 (5) *** NS NS NS NS NS - 0.139 0.056 0.327 0.149 0.510 0.451 0.361 0.485 0.567 0.569 7 (4) *** NS NS NS NS NS NS - 0.473 0.590 0.307 0.332 0.264 -0.077 0.355 0.376 0.332 8 (3) *** NS NS NS NS NS NS NS - 0.314 0.268 0.865 0.669 0.674 0.655 0.804 0.675 JAVA (4) *** NS NS NS * * * * * - 0.028 0.860 0.735 0.713 0.712 0.764 0.668 BALI (6) *** NS NS NS NS NS NS NS NS NS - 0.587 0.517 0.436 0.546 0.463 0.518 9 (5) *** * * * * ** ** * * ** * - 0.629 0.432 0.626 0.533 0.465 10 (5) *** * * * * * ** * * ** ** ** - 0.295 0.308 0.585 0.367 11 (5) *** * * * * NS * NS * ** * ** * - 0.424 0.332 0.251 12 (5) *** * * * ** ** ** * * ** ** ** * ** - 0.609 0.375 WPAP (8) *** * * * ** *** *** ** ** ** * *** *** *** *** - 0.282 NCAL (194) *** *** *** *** *** *** *** ** *** *** *** *** ** ** *** ** -
Table 2. Analysis of molecular variance (AMOVA) among samples of Scomberomorus commerson based on partial sequences (310 bp) of the mitochondrial control region. Samples were grouped on a geographic basis (see Fig. 1) as following: Persian Gulf + Oman Sea (samples AUH, BAH, DIB, IRN, KUW, OMN and RAK); East China Sea (1); South China Sea + Malacca Strait (2-8); Java Sea + Bali (JAVA, BALI); Timor Sea + Arafura Sea (9-11); West Papua (WPAP); Coral Sea (12, NCAL)
Source of variation d.f. Sum of squares Variance
components
% variation P-value
Among groups 6 5787.59 Va=20.49 72.79 <0.0001
Among populations within groups 20 266.97 Vb= 0.35 1.23 0.0014
Within groups 424 3100.91 Vc= 7.31 25.98 <0.0001
Table 3. Genetic diversity and results of neutrality tests in populations of Scomberomorus commerson across the Indo-Pacific. N = number of individuals, H = number of haplotypes, Hd = haplotype diversity (Nei, 1987), S = number of polymorphic sites, π = nucleotide diversity (Nei, 1987), and k = average number of nucleotide differences between two sequences (Tajima, 1983). For the H-test (Depaulis & Veuille, 1998), the probability that Hdsim<Hdobs is reported. The value of Tajima‟s D test (Tajima, 1989) is reported. Samples were grouped as in Table 2
Region N H S Hd π k H-test D
Persian Gulf / Oman Sea 193 123 79 0.986 0.040 11.74 0.999 -0.407
East China Sea 2 2 5 1.000 0.017 5.00 - -
South China Sea / Malacca Strait 25 20 55 0.980 0.053 15.26 0.974 0.185
Java Sea / Bali 10 10 42 1.000 0.052 15.18 0.999 0.109
Timor Sea / Arafura Sea 16 15 39 0.992 0.038 11.36 0.999 -0.041
West Papua 8 6 17 0.929 0.023 6.72 0.726 0.124
Table 4. Genetic diversity at eight microsatellite loci in Scomberomorus commerson samples; sample size in brackets; HE: expected
heterozygosity according to HWE; HO: observed heterozygosity; ^f: Weir and Cockerham‟s (1984) estimate fixation index. *
indicate significant deviation after standard Bonferroni correction (Rice 1989)
Locus, Sample
Parameter NCAL BALI JAVA WPAP
(N=66) (N=6) (N=4) (N=10) C83Sc HE 0.488 0.583 0.531 0.725 HO 0.515 0.667 0.500 1.000 ^f -0.049 -0.053 0.200 -0.333 D61Sc HE 0.342 0.486 0.563 0.500 HO 0.125 0.167 0.750 0.143 ^f 0.639* 0.706 -0.200 0.750 E27Sc HE 0.498 0.153 0.000 0.580 HO 0.500 0.167 0.000 0.200 ^f 0.003 0.000 - 0.684 F6Sc HE 0.499 0.375 0.219 0.185 HO 0.585 0.500 0.250 0.200 ^f -0.164 -0.250 0.000 -0.029 H96Sc HE 0.618 0.694 0.688 0.595 HO 0.667 1.000 1.000 0.700 ^f -0.071 -0.364 -0.333 -0.125 J10Sc HE 0.510 0.569 0.219 0.505 HO 0.561 0.667 0.250 0.500 ^f -0.091 -0.081 0.000 0.063 J43Sc HE 0.565 0.667 0.688 0.560 HO 0.710 0.500 0.750 0.800 ^f -0.249 0.333 0.053 -0.385 L42Sc HE 0.884 0.847 0.781 0.895 HO 0.906 0.500 1.000 0.900 ^f -0.017 0.483 -0.143 0.047 Multilocus HE 0.550 0.547 0.461 0.568 HO 0.571 0.521 0.563 0.555 ^f -0.030 0.138 -0.080 0.080
Table 5. Estimates of population genetic (mtDNA) differentiation (Fst or equivalent) reported for broadcast-spawning Indo-Pacific bony fishes of various habitats Habitat,
Species
Geographic range considered Marker locus FST Reference
Reef-associated
Parrotfish, Chlorurus sordidus Western Pacific + northern Australia1 CR, sequence 0.031 Bay et al. (2003)
Bigscale soldierfish, Myripristis berndti Indo-Pacific cyt b, sequence 0.580 Craig et al. (2007)
Bignose unicornfish, Naso vlamingii Western Pacific2 CR, sequence 0.079 Klanten et al. (2007)
Forktail rabbitfish, Siganus argenteus Western Pacific cyt b, sequence 0.031 Lemer et al. (2007)
Lined unicornfish, Naso brevirostris Indo-Pacific CR, sequence 0.000-0.163 Horne et al. (2008)
Bluespine unicornfish, Naso unicornis Indo-Pacific CR, sequence 0.000-0.033 Horne et al. (2008)
Coral trout, Plectropomus leopardus Western Pacific + Northwestern Australia3 CR, sequence 0.892 van Herwerden et al. (2009)
Blacktail snapper, Lutjanus fulvus Indo-Pacific cyt b, sequence 0.640 (0.110*) Gaither et al. (2010)
Bluestripe snapper, Lutjanus kasmira Indo-Pacific cyt b, sequence 0.000-0.634 (0.062*) Gaither et al. (2010) Demersal
Crimson snapper, Lutjanus erythropterus Western Pacific CR, sequence 0.086 Zhang et al. (2006)
Golden snapper, Pristipomoides multidens Indo-Malay region CR, RFLP 0.055 Ovenden et al. (2004)
Balloon alfonsino, Beryx mollis Western Pacific cyt b, sequence 0.000 Akimoto et al. (2006)
Slender alfonsino, Beryx splendens Western Pacific cyt b, sequence 0.003 Akimoto et al. (2006)
Pelagic
Round scad mackerel, Decapterus macrosoma Indo-Malay region cyt b, SSCP 0.000 Borsa (2003)
Bigeye tuna, Thunnus obesus Indo-Pacific RFLP 0.000 Durand et al. (2005)
Indian scad mackerel, Decapterus russelli Indo-Malay region4 cyt b, SSCP 0.370 Rohfristch & Borsa (2005)
Bigeye tuna, Thunnus obesus Western Pacific CR, sequence 0.004 Chiang et al. (2006)
Swordfish, Xiphias gladius Indian O. vs. western Pacific CR, sequence 0.038 Lu et al. (2006)
Wahoo, Acanthocybium solandri Indo-Pacific cyt b, sequence 0.000-0.054 Theisen et al. (2008)
Dolphinfish, Coryphaena hippurus Indo-Pacific NAD1, sequence 0.000-0.016 Diaz Jaimes et al. (2010)
Narrow-barred Spanish mackerel, Scomberomorus commerson
Indo-Pacific CR, sequence 0.699-0.743 present study
Abbreviations: CR control region; cyt b cytochrome b locus; RFLP restriction fragment length polymorphism of a PCR-amplified fragment of mtDNA
1 includes samples from Rota (Micronesia), Papua New Guinea, Great Barrier Reef and Western Australia 2 includes Philippines, Papua-New Guinea, eastern Australia and Hawai‟i
3 includes Taiwan 4 including West Papua
Table 6. Scomberomorus spp. Reported estimates of genetic differentiation (Fst or equivalent) at the regional scale. S. commerson appeared as an outlier for both mitochondrial and nuclear markers [Dixon‟s test for detecting outliers (Sokal & Rohlf, 1969): Q=0.693, P<0.05, and Q=0.833, P<0.01, respectively]
Species Geographic range considered Marker type FST Reference
Mitochondrial
S. cavalla W Atlantic and Gulf of Mexico Whole mtDNA, RFLP 0.000 Gold, Kristmundsdóttir & Richardson (1997)
S. commerson Persian Gulf – Oman Sea CR, RFLP 0.010 Hoolihan, Anandh & van Herwerden (2006)
S. commerson Tropical SW Pacific CR, sequence 0.306-0.586 present study
S. maculatus W Atlantic and Gulf of Mexico ND4, RFLP 0.000-0.065 Buonaccorsi, Starkey & Graves (2001)
S. niphonius East China Sea – Yellow Sea CR, sequence 0.000-0.047 Shui et al. (2009)
S. sierra Pacific coast of Tropical America CR, sequence 0.004-0.094 Domínguez López, Uribe Alcocer & Díaz Jaimes (2010) Nuclear
S. brasiliensis Southern Caribbean Sea 8 microsatellite loci* 0.002 Gold et al. (2010)
S. cavalla W Atlantic and Gulf of Mexico 5 microsatellite loci* 0.000-0.013 Broughton, Stewart & Gold (2002) S. cavalla Around peninsular Florida 5 microsatellite loci* 0.000-0.005 Gold, Pak & DeVries (2002)
S. commerson Persian Gulf – Oman Sea 5 microsatellite loci* 0.029 van Herwerden et al. (2006)
S. commerson Tropical Australia – Papua New Guinea 9 allozyme loci* 0.002 J.B. Shaklee in Buckworth et al. (2007)
S. commerson Tropical SW Pacific 8 microsatellite loci* 0.228 present study
S. maculatus W Atlantic and Gulf of Mexico 1 intron locus* 0.000 Buonaccorsi, Starkey & Graves (2001) S. munroi Northern and Eastern Australia 7 allozyme loci* 0.038 Begg, Keenan & Sellin (1998) S. queenslandicus Northern and Eastern Australia 7 allozyme loci* 0.025 Begg, Keenan & Sellin (1998)