HAL Id: hal-01799682
https://hal.archives-ouvertes.fr/hal-01799682
Submitted on 14 Mar 2019
HAL is a multi-disciplinary open access archive for the deposit and dissemination of sci-entific research documents, whether they are pub-lished or not. The documents may come from teaching and research institutions in France or abroad, or from public or private research centers.
L’archive ouverte pluridisciplinaire HAL, est destinée au dépôt et à la diffusion de documents scientifiques de niveau recherche, publiés ou non, émanant des établissements d’enseignement et de recherche français ou étrangers, des laboratoires publics ou privés.
Non-linear release dynamics for a CeO2 nanomaterial
embedded in a protective wood stain, due to matrix
photo-degradation
Lorette Scifo, Perrine Chaurand, Nathan Bossa, Astrid Avellan, Melanie
Auffan, Armand Masion, Bernard Angeletti, Isabelle Kieffer, Jérôme Labille,
Jean-Yves Bottero, et al.
To cite this version:
Lorette Scifo, Perrine Chaurand, Nathan Bossa, Astrid Avellan, Melanie Auffan, et al.. Non-linear release dynamics for a CeO2 nanomaterial embedded in a protective wood stain, due to matrix photo-degradation. Environmental Pollution, Elsevier, 2018, 241, pp.182-193. �10.1016/j.envpol.2018.05.045�. �hal-01799682�
1
Non-linear release dynamics for a CeO
2
nanomaterial
2
embedded in a protective wood stain, due to matrix
3
photo-degradation
4 5
6 Lorette Scifo a,b, Perrine Chaurand b, Nathan Bossa b, Astrid Avellan b, Mélanie Auffan b, Armand
7 Masion b, Bernard Angeletti b, Isabelle Kieffer d, Jérôme Labille b, Jean-Yves Bottero b and Jérôme Rose
8 b.
9 AFFILIATION.
10 a Tecnalia-France, Montpellier, France.
11 b Aix Marseille Univ, CNRS, IRD, INRA, Coll France, CEREGE, Aix-en-Provence, France.
12 dOSUG-FAME, UMS 832 CNRS-Univ. Grenoble Alpes, F-38041, Grenoble, France
13 CORRESPONDING AUTHOR FOOTNOTE: 14 Perrine Chaurand. E –mail : chaurand@cerege.fr 15 DECLARATION OF INTEREST: NONE 16
18 HIGHLIGHTS.
19 • Release of Ce due to matrix photo-degradation 20 • 2 distinct phases of release
21 • The release of 1 wt.% of the initial Ce mass appears as a realistic scenario for outdoor exposure of 22 ca. 3.5 years
23 • The presence of CeO2 nanoparticles in the acrylic stain modifies the behavior of the matrix toward
24 weathering. 25 ABSTRACT.
26 The release of CeO2-bearing residues during the weathering of an acrylic stain enriched with CeO2
27 nanomaterial designed for wood protection (Nanobyk brand additive) was studied under two different 28 scenarios: (i) a standard 12-weeks weathering protocol in climate chamber, that combined condensation, 29 water spraying and UV-visible irradiation and (ii) an alternative accelerated 2-weeks leaching batch 30 assay relying on the same weathering factors (water and UV), but with a higher intensity of radiation 31 and immersion phases. Similar Ce released amounts were evidenced for both scenarios following two 32 phases: one related to the removal of loosely bound material with a relatively limited release, and the 33 other resulting from the degradation of the stain, where major release occurred. A non-linear evolution 34 of the release with the UV dose was evidenced for the second phase. No stabilization of Ce emissions 35 was reached at the end of the experiments. The two weathering tests led to different estimates of long-36 term Ce releases, and different degradations of the stain. Finally, the photo-degradations of the 37 nanocomposite, the pure acrylic stains and the Nanobyk additive were compared. The incorporation of 38 Nanobyk into the acrylic matrix significantly modified the response of the acrylic stain to weathering. 39
41 KEYWORDS. Aging of nanomaterials, engineered nanomaterials (ENM) release, photo-degradation, 42 polymer nanocomposites, acrylic stain.
43 CAPSULE.
44 The weathering of a nano-CeO2-enriched acrylic stain caused a multi-regime non-linear Ce release,
45 accompanied by mutually dependent aging of both the matrix and the CeO2-nanomaterial.
46
47 MANUSCRIPT TEXT. 48
Introduction
49 The necessity to better estimate and characterize the release of engineered nanomaterials (ENMs) from 50 products has been pointed out repeatedly these past years (Caballero-Guzman and Nowack, 2016; 51 Mackevica and Foss Hansen, 2016; Reijnders, 2009; Som et al., 2010). Real exposure assessments are 52 indeed still hampered by the difficulty to detect and quantify ENMs in complex natural environments 53 (Szakal et al., 2014). While models have been developed to compensate the lack of direct 54 measurements, they often have to rely on oversimplifications and extrapolations in order to estimate the 55 exposure resulting from ENMs release (Caballero-Guzman and Nowack, 2016), which lowers their 56 reliability. A more accurate determination of ENMs flows at all stages of the products lifecycle is then 57 required.
58 The use phase is particularly challenging, as uncontrolled releases of ENMs can result from consumer 59 handling or aging of the products. Such releases cannot be easily determined in the everyday life. Then 60 the simulation of relevant aging scenarios under controlled conditions at the lab-scale appears as a good 61 option.
62 The release of ENM during the use phase will depend on the nanoproduct category. For instance, the 63 release from liquid suspensions is inherent to use and will be around 100%, while the release from solid 64 nanocomposites is more difficult to predict. Solid nanocomposites are materials constituted with a solid
65 matrix and ENMs that can be either deposited at the solid surface or incorporated in the bulk as filling 66 agents (nanofiller). The release of ENM from a solid nanocomposite can proceed from the leaching of 67 ENMs by a liquid, via desorption from the surface, dissolution, or diffusion inside the matrix (Bossa et 68 al., 2017; Duncan and Pillai, 2015). But it can also arise from the degradation of the solid matrix itself, 69 caused by a mechanical action (Bressot et al., 2017) or (photo)chemical reactions (Duncan, 2015). 70 Products with an outdoor application will be especially exposed to photo-degradations due to 71 weathering processes. The weathering of solid nanocomposites has been the focus of several studies 72 since the release of TiO2 nanoparticles from facades was evidenced for the first time by Kaegi et al.
73 (Kaegi et al., 2008). Outdoor weathering setups with rain collectors were developed and allowed 74 measuring the release of silver nanoparticles from an acrylic white paint (Kaegi et al., 2010) or from 75 wood protective stains (Künniger et al., 2014) under natural conditions. However, such realistic 76 scenarios required long-term exposures and many other groups preferred short-term lab-scale artificial 77 weathering, that are pre-validated to correlate with material degradation CEN standards (Podgorski et 78 al., 2003). In the past decade, short-term artificial weathering has been performed on paint (Wang and 79 Nowack, 2018), stains (Shandilya et al., 2015), cement (Bossa et al., 2017; Wohlleben et al., 2011) and 80 plastic nanocomposites (Fernández-Rosas et al., 2016; Neubauer et al., 2017; Nguyen et al., 2010; 81 Wohlleben et al., 2017), either using homemade setups (Al-Kattan et al., 2013; Bernard et al., 2011; 82 Olabarrieta et al., 2012; Pellegrin et al., 2009) or commercial climate chambers (Fiorentino et al., 2015; 83 Hirth et al., 2013; Vilar et al., 2013; Zuin et al., 2013). Although a variety of weathering protocols have 84 been tested, they most often included the exposure of the material to an artificial light source, simulating 85 the full solar spectra (Busquets-Fité et al., 2013; Wohlleben et al., 2013), or restricted to its UV-part 86 (Al-Kattan et al., 2013; Chin et al., 2004; Fiorentino et al., 2015). It was often combined with an 87 exposure to water such as controlled relative humidity (Nguyen et al., 2010), periodic condensation 88 (Fiorentino et al., 2015) or water spraying phases (Fernández-Rosas et al., 2016), representative for 89 humidity, dew or rain, respectively. Depending on the groups, different methods were applied for
91 weathering assays, using collectors to gather particles detached by gravity (Nguyen et al., 2011), or run-92 off waters from spraying (Al-Kattan et al., 2015; Busquets-Fité et al., 2013). However, this involved 93 large volumes of water (up to 5000L (Al-Kattan et al., 2013)). As an alternative, some authors 94 implemented external release assessment, with (Hirth et al., 2013; Hsu and Chein, 2007) or without 95 additional mechanical stress (Zuin et al., 2013) (e.g. shaking, sonication, abrasion). Although these 96 different approaches were found successful, the diversity of protocols and setups made difficult the 97 comparison between studies, the understanding of the mechanisms and laws governing ENMs release. 98 Recently, efforts were made towards harmonization of the experimental protocols, in the framework 99 of large pilot interlaboratory studies (Wohlleben et al., 2017, 2014). They converged towards 100 weathering procedures in climate chambers with or without periodic water spraying, and external 101 release assessment. This harmonized protocol yielded contrasted results, depending on the nature on the 102 material: UV-resistant polymers such as polyethylene led to minimal release, while epoxy resins 103 experienced strong degradations under UV, entailing an accumulation of the ENMs at the surface, and 104 eventually their release. A comparative study on a wide range of nanocomposites estimated that release 105 rates from different matrices were spreading across 5 orders of magnitude while the impact of the 106 nanofiller itself on the release rate was limited to one order of magnitude (Wohlleben and Neubauer, 107 2016). It was then proposed that matrix degradability determined to a large extent the response of a 108 nanocomposite to weathering and the ENMs release behavior.
109 In this study, we focused on a single polymer matrix and analyzed the impact of the addition of a 110 nanomaterial to its weathering. We used an acrylic stain that offers a good resistance to UV (Chiantore 111 et al., 2000; Forsthuber et al., 2013) and is commonly employed for wood protection. It was enriched 112 with a CeO2 nanomaterial, which acts as a UV-absorber and brings an additional protection to the stain.
113 We studied the weathering of this nanocomposite to answer two questions: i) is there a potential for 114 release of the nanomaterial upon aging of a UV-resistant matrix ? ii) is the weathering of the acrylic 115 matrix modified in presence of the CeO2 nanomaterial? In addition, we characterized a parameter rarely
117 weathering procedures were applied: a standard 12-weeks weathering protocol in a climate chamber, 118 that combined condensation, water spraying and UV-visible irradiation, close to the harmonized 119 protocol mentioned above; and an alternative accelerated 2-weeks batch assay applying the same 120 weathering factors (water and UV), but with a higher intensity of radiation. In both experiments, the 121 nanocomposite was weathered along with the reference stain without CeO2 addition, in order to evaluate
122 the impact of the nanomaterial on the aging. Surface degradations were monitored as an indicator for 123 weathering. The release of Ce (as dissolved and/or particulate fraction) was quantified with short time 124 steps (e.g. 24h to 72h), to analyze the release dynamics during weathering and relate it to the 125 degradations of the stain surface. Finally the physico-chemical transformation of the nanomaterial 126 within the stain with weathering duration was characterized to give an insight into aging mechanisms. 127
128
Material and methods
129 Materials
130 An acrylic stain commercialized by Castorama under one of its brand (Lasure Intérieur- Extérieur 131 casto’) was chosen for this study. It was deposited in three layers, on larch substrates, freshly sanded 132 with 180 grain paper, observing 2-hours drying between successive layers and 24h final drying.
133 Two groups of samples were prepared. In the first group (called n-CeO2), the stain was enriched with
134 citrate-coated CeO2 nanoparticles, to improve UV filtering. For this, a commercial suspension
135 (Nanobyk-3810) was added to the stain at 7wt.%, and this mix was applied to the upper face (i.e. 136 exposed face) of the substrate sample (Figure 1). The characterization and aging of Nanobyk additive 137 was done previously (Auffan et al., 2014). Lateral and lower faces were coated with the stain alone to 138 protect the wood substrate during weathering.
139 In parallel, a second group of samples (called ACR) was painted on all faces with the Ce-free stain. It 140 was used as a reference to evaluate the impact of ENM addition on the aging of the stain.
141 For the weathering experiments in the climate chamber (Suntest samples), larch blocks of 27 x 27 x 142 13 mm were cut. They were weighed before and immediately after the application of each layer of stain. 143 Taking into account a 18% CeO2 content for Nanobyk additive (Tella et al., 2014), the amount of CeO2
144 deposited on each sample (upper face) was calculated, and is reported in Table 1.
145 For batch experiments, the stain deposit was made on a larger piece of wood (600 x 35 x 11 mm), cut 146 afterwards into 35 x 35 x 11 mm blocks. Lateral faces were covered with Ce-free stain after cutting. 147 This method resulted in a less accurate determination of CeO2 content, as final samples could not be
148 weighed individually. CeO2 surface concentration and stain density were then assessed based on the
149 assumption that batch samples exhibited the same final CeO2 content (wt.%) as Suntest samples.
150
151 Table 1. Exposed surface, dry stain mass and density, mean CeO2 mass deposited on samples, and resulting CeO2 content 152 (wt.%) and surface concentration. Standard deviation is reported in parenthesis. On batch samples, no data was available
153 regarding the final mass of the stain. An equivalent CeO2 final content (wt.%) to Suntest samples was assumed and CeO2 154 surface concentration, stain density and stain mass after drying were calculated based on this assumption (in italics).
Suntest Batch
n-CeO2 ACR n-CeO2 ACR
Exposed surface (mm2) 729 729 1225 1225
Stain mass after drying (mg) 38 (18) 48 (36) 40 (20) 27 (22)
Stain density (g.m-2) 52 (24) 70 (47) 33 (17) 22 (18)
Deposited CeO2 (mg) 1.5 (0.2) - 1.8 (0.3)
-Final CeO2 content (wt.%) 4.5 (1.5) - 4.5 (1.5)
-CeO2 surface concentration
(mg.m-2) 2089 (273) - 1481 (289)
-155
156 Artificial weathering
157 Two artificial weathering procedures, based on a succession of dry irradiation and immersion or water 158 spraying phases, were tested. The two sets of experiments were both built on a cycle of 7 days 159 applying the same weathering factors but they were not designed to be compared in term of Ce release 160 and stain degradation. The first one was performed in a climate chamber Suntest XLS+ (Atlas
161 Material testing Solutions, Germany) for 12 weeks. It combined dry UV irradiation phases with water 162 spraying events to simulate as much as possible a long-term “realistic” scenario. The weathering 163 program was inspired from a standardized protocol (NF EN 927-6, 2006) specific to wood stains, but 164 it was adapted to quantify in details Ce releases and release rates with the UV irradiation and to 165 differentiate Ce release as dissolved Ce from particulate Ce.
166 A second simplified and accelerated protocol was developed for a 2-weeks batch experiment (batch 167 test). It was designed to provide complementary information on the light effect by comparing release 168 from illuminated samples and non-illuminated samples (dark samples). The purpose of this protocol 169 was to determine whether the release behavior of a solid nanocomposite could be estimated with a 170 short-term experiment.
171
172 Weathering in the climate chamber Suntest XLS+:
173 As described in standard NF EN 927-6, the weathering program was based on weekly cycles repeated 174 for 12 weeks. The weekly weathering cycle started with a 24h condensation, performed in a 175 homemade setup outside the climate chamber (Figure S1, Supplementary Content). Then, ACR and n-176 CeO2 samples were introduced inside the Suntest XLS+ and alternatively exposed to Xe lamp and
177 Milli-Q water spraying for the rest of the week. Adaptations to the standard protocol were made, in 178 order to quantify Ce releases and monitor their evolution during weathering. First of all, the volume of 179 water sprayed was strongly reduced, by lowering the spraying frequency from 30 minutes every 180 180 minutes (NF EN 927-6), to four 20 minutes events, distributed over the week as described by Figure 181 1a. The water flowing at the surface of samples during spraying phases was collected in order to 182 evaluate Ce releases induced by weathering. To do so, groups of 6 samples, representing a total 183 exposed surface of 4374 mm2, were placed inside 800mL glass beakers. Raised and slanted PTFE
184 holders were used, to avoid immersion and water stagnation at the sample surface. A total of five 185 beakers (3 with n-CeO2 and 2 with ACR) holding 6 samples were fitted inside the climate chamber,
187 homogenous spraying on all the samples (Figure 1c). Each beaker was weighed before and after each 188 “rain” event to determine the exact volume of water received by the samples. In average 145 mL ± 42 189 mL water were collected in one beaker during the 20 minutes spraying, which corresponded to a mean 190 L/S ratio (rain volume/exposed stain mass) around 500 - 600 for each rain event. The cumulative L/S 191 ratio at the end of the experiment was between 24000 and 30000 (depending on the beaker). Water 192 sampling from these lixiviates was carried out 3 times a week as indicated by the asterisks in Figure 193 1a for ICP-MS analysis. More details on the water sampling protocol can be found in Supplementary 194 content.
195 During irradiation phases, the intensity of radiation was set to 65J.m-2.s-1 (300nm-400nm) at chamber
196 floor, resulting in an effective UV intensity of 91 J.m-2.s-1 at the elevated position of samples.
197 Complementary with UV dose, irradiance in the 300 nm – 800nm range was measured once a week 198 with an external radiometer MacSolar (SOLARC, Germany) and was found to be around 500 J.m-2.s-1
199 at the sample surface. The chamber temperature was around 30°C (max 36.6°C) during dry irradiation 200 phases and 21°C (max 30.5°C) during water spraying, while black body temperature (BST panel) was 201 measured respectively at 52°C (max 64.4°) and 21°C (max 32.9°C). An additional measurement of 202 the temperature at sample surface during an irradiation phase indicated a value of ca 36°C.
203 At the end of each weekly cycle, one n-CeO2 and one ACR sample were withdrawn from the
204 experiment and replaced by fresh samples. The degradation of the stain could then be followed week 205 after week. After 12 weeks, 1000 mm precipitations and a UV dose of 513 MJ.m-2 (2826 MJ.m-2 in
206 the 300 nm – 800 nm range) were accumulated by the oldest samples. In France, such precipitations 207 and irradiance are usually reached in 8-12 months depending on the area(INES Education, n.d.; 208 “Météo France - Météo et Climat,” n.d.)
209 Batch weathering:
210 In this test, a higher intensity of radiation (i.e. radiant exposure in the 300-800 nm range) was used 211 and full immersion of the sample was substituted to water spraying in order to accelerate weathering.
212 Immersion was also selected because it could be implemented more easily. The detailed experimental 213 protocols are described below.
214 Batch weathering was based on a weekly cycle as during the Suntest experiments. It alternated dry 215 irradiation phases with 5 immersions, distributed over the week as shown in Figure 2. During 216 immersions, stained samples (ACR and n-CeO2 samples, n=3 for each condition) of 35 x 35 x 11 mm, 217 with an exposed surface of 1225 mm2, were placed in separate polypropylene (PP) beakers and
218 submerged for 1.5h in 150mL Milli-Q water. One beaker without sample was also set up for blank. 219 Constant magnetic stirring ensured a good homogenization of the leachate. pH and conductivity were 220 measured before and after each immersion. At the end of immersion, a 20mL-aliquot was extracted 221 for ICP-MS analysis. It was compensated with an equivalent volume of Milli-Q water to maintain a 222 constant L/S ratio (immersion volume/stain mass) of 3750 during the whole experiment. Between two 223 immersions, samples were withdrawn from the PP beakers and exposed to a 400W HPI-T Plus Metal 224 Halide lamp (Philips, France, see Figure S2 for emission spectra). Beakers with leachate were covered 225 and maintained in the dark to avoid leachate evolution until the next immersion. The distance of the 226 sample to the lamp was adjusted to reach a high intensity of radiation. Mean irradiance at sample 227 surface was measured at 105 J.m-2.s-1 for UV range (290nm-390nm) and 1300 J.m-2.s-1 for the
300nm-228 800 nm range, with a PCE-UV34 radiometer (PCE Ibérica S.L., Spain.) and MacSolar radiometer, 229 respectively.
230 The experiment was reproduced for 2 consecutive weeks resulting in a UV dose of 97 MJ.m-2 (1367
231 MJ.m-2 in the 300 nm-800 nm range) at the end of the assay. Sample temperature alternated between
232 44°C during irradiation phase and 27°C during immersions.
233 The same weathering experiment of 2 weekly cycles was also performed in the dark (immersion step 234 without irradiation) to investigate the influence of light on the degradation of the stain and 235 nanomaterials release. The experimental setup and the weekly weathering cycle are detailed in Figure
238 Quantification of Ce release
239 Ce concentration in lixiviates of both experiments was analyzed by ICP-MS (Nexion 300, Perkin 240 Elmer, France) after acidification at 2,5% HNO3 (Ultrapure NORMATON 67%) following Ce isotope
241 (140Ce). In the Suntest experiments, 20mL of sub-sample were filtrated at 10kDa (using Amicon 8050
242 unit with cellulose membrane) before acidification in order to determine dissolved fraction of Ce in the 243 lixiviates.
244 Alteration of the nanocomposite due to weathering
245 The degradation of the stains was estimated based on the detection of defects. Three phenomena 246 defined in standard NF EN 927-6 were monitored: blistering, flaking and cracking. Blistering is defined 247 as a lifting of the stain from the underlying surface, which appears as bubbles or blisters in the paint, 248 usually caused by heat, moisture or a combination of both. It can eventually lead to peeling of the stain 249 if not corrected. Cracking indicates splitting of the paint film through at least one coat, leading to failure 250 of the paint. In its early stages, the problem appears as hairline cracks; in its later stages, flaking, i.e. a 251 peeling of the paint from the underlying surface in the form of flake, can occur.
252 The observation of defects was made by optical microscopy at magnification x5 and x10, on a Leica 253 DM RXP microscope. ISO standards 4628-1(2003) (ISO 4628-1, 2003), 4628-2(2003) (ISO 4628-2, 254 2003), 4628-4(2003) (ISO 4628-4, 2003) and 4628-5(2003) (ISO 4628-5, 2003) were used as references 255 to rate defect size and density. Grades for defects density and size are detailed in supporting information 256 (tables S4 and S5).
257 Moreover, the oxidation state of Ce inside the stain was characterized before and after weathering, as an 258 indicator for the alteration of CeO2 nanomaterial. To this end, a thin laminate of the exposed face of
259 Suntest samples was cut and analyzed by X-ray Absorption Near-Edge Spectroscopy (XANES) at the 260 Ce-L3 edge (5723 eV). Acquisition was made in the fluorescence mode (Canberra Ge-solid-state
261 detector) on the CRG-FAME BM30B beamline at the ESRF (Grenoble, France). The beam size was 262 100µm x 300µm. CeIII-oxalate and the commercial additive Nanobyk-3810, which contained only
263 CeIVO
2 nanoparticles as determined previously (Auffan et al., 2014), were used as CeIII and CeIV
264 reference compounds, respectively. Each spectrum was at least the sum of two scans. XANES data were 265 processed using an IFEFFIT software package(Ravel and Newville, 2005). Linear Combination Fits 266 were performed in order to determine the relative CeIII and CeIV contents.
267
268
Results
269 Dynamics of Ce release
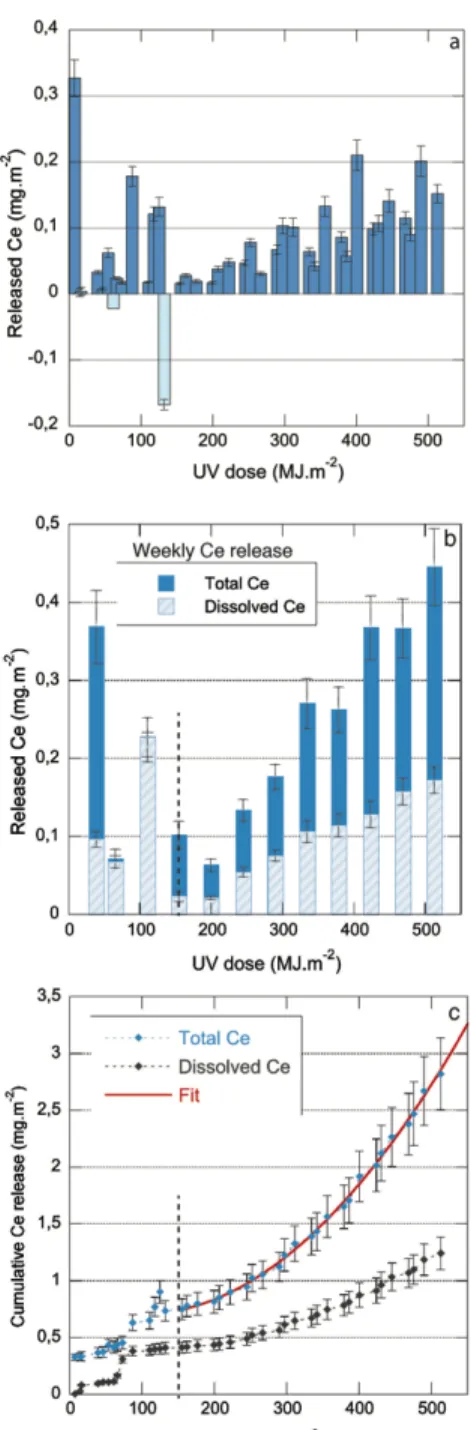
270 Ce releases measured after water spraying events in the Suntest and immersions of batch experiments 271 are reported in Figure 3a and Figure 4a. Data were plotted as a function of the UV dose. A table giving 272 the equivalence between weathering time in weeks, UV dose and irradiation in the 300 nm – 800 nm 273 range for both experiments is presented in Table S3.
274 For the Suntest experiments, Ce was detected in all lixiviates obtained from n-CeO2 samples, while it
275 was below the ICP-MS detection limit (DL< 0.1ng.g-1) for the majority of ACR samples. Occasional
276 levels above DL probably result from a contamination and cannot be considered as representative for a 277 release of Ce from the stain matrix.
278 Besides the strong initial release (327 ± 28 µg.m-2), the measured Ce releases varied from a few µg.m
-279 2 to ~200 µg.m-2. This corresponded to Ce concentrations between 0.1 and 5 µg.L-1 in “rain” waters. In
280 Figure 3a, strong fluctuations are observed between consecutive time points. They are due to the 281 modulations of the weekly weathering cycle in Suntest experiments, that imposed different irradiation 282 times (22h, 44h or 72h) or number of water spraying events (1 or 2) between two sampling events 283 (Figure 1a). In order to reduce this variation and better observe the general trend, Ce releases of Suntest 284 experiment were integrated over the weekly cycle (Figure 3b). Two different regimes of emissions can 285 be distinguished. During the four first weeks of weathering (total UV irradiation ≤ 155 MJ.m-2) Ce
287 Their magnitude increases with cumulative UV irradiation, and no stabilization is reached at the end of 288 the experiment (12 weeks, 513 MJ.m-2).
289 The chemical analysis of the Suntest samples filtrated at 10kDa (Figure 3b, light blue) shows that Ce 290 is released in the form of both particulate and dissolved species. The calculated Dissolved/Total Ce ratio 291 varies strongly during the four first weeks of experiments, but after 155 MJ.m-2 (4 weeks), it oscillates
292 between 0.3 and 0.5 with a mean value of 0.4. CeO2 nanoparticles in the additive initially consist in pure
293 CeIV (cerianite CeO
2) (Auffan et al., 2014) and are considered to be poorly soluble in aquatic media
294 (Söhnel and Garside, 1992) . The presence of dissolved Ce in the lixiviates indicates an alteration of the 295 nanomaterial and implies the reduction of CeIV to CeIII (more soluble at pH 6).
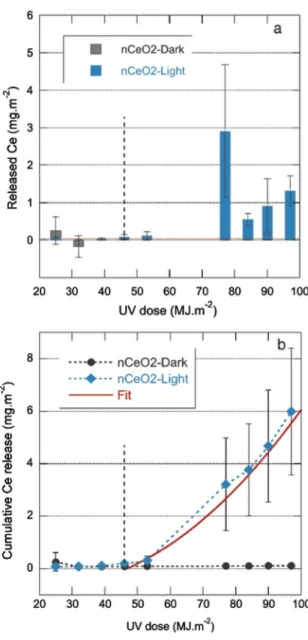
296 For batch experiment (Figure 4a), a release of 75-250 µg.m-2 of Ce was detected directly after
297 immersion 1 regardless of the irradiation regime (dark or light). Cerium release did not exceed 298 background levels from 32 MJ.m-2 to 46 MJ.m-2 (immersion 4), then increased for n-CeO
2 samples
299 exposed to light, while they remained below the DL for samples kept in the dark. The first measurable 300 releases at 46 MJ.m-2 were around 0.08 mg.m-2 of Ce, then kept increasing to reach 1.3 ± 0.4 mg.m-2 of
301 Ce at 97 MJ.m-2. This trend was disturbed only by a strong release event at 77 MJ.m-2 (2.9 ± 1.8 mg.m-2
302 of Ce, immersion 1, week 2), which is probably the result of the longer irradiation period of 72h at the 303 beginning of the new cycle. Combined with the absence of Ce release from dark samples after 304 immersion 1, this shows a clear correlation between exposure to sunlight and Ce emissions. Once again, 305 no stabilization in Ce release was observed at the end of the experiment, which is consistent with the 306 trend measured for the Suntest experiments at higher cumulated UV doses.
307 The two aging scenarios express a very similar behavior, with two distinct phases for Ce release. The 308 initial phase (phase I) showed an overall decreasing trend with time and no clear dependency on light. In 309 the second phase (phase II) emissions increased with weathering and are light-dependent. No plateau in 310 Ce release was observed at the end of both assays.
311 Ce releases cumulated over the duration of the experiments were plotted in Figure 3c and Figure 4b. 312 They confirmed the similar trends observed for both experiments. At the end of the aging experiments,
313 the total Ce release reached 2.8 ± 0.3 mg.m-2 for the Suntestand 6.0 ± 2.4 mg.m-2 for the batch assay. In
314 both cases, this represented less than 1wt.% of the initial Ce mass (~0.16wt.% for Suntest samples, 315 ~0.5wt.% for batch samples). A strong initial release was measured during the first rain event of the 316 Suntest experiments (327 ± 28 µg.m-2 of Ce) accounting for 12% of total Ce emissions. The initial
317 release was much lower in batch test, (< 0.1 µg of Ce) accounting for only 1.3% of the total Ce 318 emissions. For the two tests, most of the Ce release took place in the second part of the experiment 319 (phase II), representing 73% and 98% of Ce emissions, for the Suntest protocol (after 155 MJ.m-2) and
320 batch experiment (after 46 MJ.m-2), respectively.
321 In order to get an insight on Ce release for longer weathering durations, release curves obtained in the 322 two experiments were fitted by a second order polynomial law. Fitting parameters are reported in Table 323 2. Fits were extrapolated to assess the irradiation necessary to reach the release of 1%, 10% or 100% 324 release of the initial Ce mass in our specific experimental conditions (i.e. for a given type and thickness 325 of stain). For the Suntest protocol, 1wt.% of the initial Ce amount is predicted to be released after 1250 326 MJ.m-2, 10% after 3800 MJ.m-2 and 100% after 11800 kWh.m-2. According to the Solar Radiation Data
327 (“SoDa - Web Services,” n.d.), the annual UV dose corresponding to the area of Marseille in France is 328 around 350 MJ.m-2. Based on this data, the release of 1% of the initial Ce mass corresponds to 3.5 years
329 of aging of the stain. However, the release of 10wt.% or 100wt.% of the Ce present in the stain would 330 require 10 and 33 years, respectively. The fit of batch data leads to very different values, with 1% of 331 total Ce mass being released after 130 MJ.m-2, 10% after 355 MJ.m-2 and 100% after 1070 MJ.m-2.
332 These values correspond to outdoor exposures of 4 months, 1 year and 3 years in the south of France. 333
334 Table 2. Parameters of the polynomial fit of release curves. y = m0 + m1*x + m2*x2 .
Experiment m0 m1 m2 R2
Suntest 0.8171 - 0.0024 1 x 10⁻⁵ 0.997
336
337 Figure 5 shows the evolution of defect density and size for ACR and n-CeO2 stains observed for the two
338 aging scenarios. Before weathering, the samples were generally free of defects. Isolated flakes were 339 present on a few samples but cracking and blistering were not observed. The samples that were 340 weathered in the dark did not develop any defect (not shown). On the contrary, defects appeared at the 341 surface of samples that were exposed to light (Figure S4). The batch aging protocol induced blistering 342 for both Ce-enriched or Ce-free stain, but no cracking nor flaking was observed (Figure 5c and d). 343 Similar blisters sizes and densities were measured for ACR and n-CeO2 samples, with a growing
344 magnitude as aging proceeded. For ACR samples weathered in Suntest XLS+, defects mainly took the 345 shape of flakes and cracks (Figure 5a). Blistering was rarely observed. Defects appeared at a very early 346 stage of the experiments. However their density remained rather low (mainly grade 1, as defined in ISO 347 4628-2, 4628-4 and 4628-5) and their size ranked mostly S1 (i.e. = only visible under magnification 348 x10) or S2 (i.e. = incipiently visible with normal and corrected vision) on some occasions (indicated by 349 a star symbol). Neither defect density nor size showed a significant evolution with the UV dose, 350 confirming the good resistance of this material to weathering.
351 A totally different pattern emerged for n-CeO2 samples. Their surface remained rather free of defects
352 during the four first weeks of experiment, showing a good initial resistance to weathering. Nevertheless, 353 after 155 MJ.m-2 (dotted line in Figure 5b), defects started multiplying. As ACR samples, n-CeO
2
354 samples displayed cracks under microscopic magnification (x10) but their density reached higher 355 grades. Flaking was absent from the nanocomposite surface after weathering, but contrary to the 356 reference material, dense and large blisters became visible. No significant variations in defect sizes were 357 observed with aging, but the density was clearly higher after 4 weeks weathering (155 MJ.m-2),
358 correlated with the change in Ce release regime (Figure 3b).
359 Cracks are the defects most frequently reported for acrylic stains weathered under both artificial (Aloui, 360 2006; Irmouli et al., 2012; Kielmann and Mai, 2016; Olsson et al., 2014; Popescu and Simionescu, 361 2013) and natural conditions (De Windt et al., 2014; Olsson et al., 2014). They can sometimes lead to
362 flaking, but blistering is usually not expected. This scenario matches well the observations made on 363 ACR samples of our Suntest experiment but deviates from what was observed for the rest of samples. 364 During batch testing, blistering was developed in a similar way for Ce-enriched or Ce-free stain. This 365 effect could then find an origin in the experimental protocol itself, where repeated immersions could 366 favor water penetration and entrapment at the wood/stain interface. After Suntest weathering (and 367 periodic condensation phases), n-CeO2 samples showed a significant blistering, which was absent from
368 the surface of ACR samples (Ce-free stain);
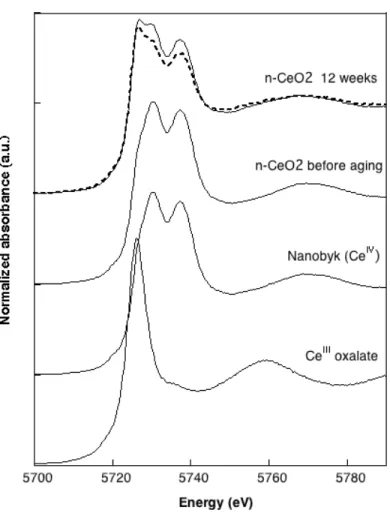
369 In addition to wood stain degradation, the oxidation state of Ce inside the stain was monitored as an 370 indicator for the alteration of the CeO2 nanomaterial. XANES spectra of the Nanobyk additive and the
371 non-weathered n-CeO2 sample are given in Figure 6. They exhibit two peaks (double white line) at ~
372 5728 eV and ~ 5735 eV, corresponding respectively to the final states 2p4f15d1L and 2p4f05d2 of CeIV
373 (Dexpert et al., 1987; Finkelstein et al., 1992) . Both match perfectly showing that CeO2 nanoparticles
374 were not altered by their incorporation into the stain and its deposition onto a wood substrate. After 12 375 weeks of weathering following the Suntest protocol (513 MJ. m-2 UV dose), the double white line
376 characteristic of CeIV states is still visible on the XANES spectra. However a third peak appeared at
377 ~5724 eV that is the absorption energy of the CeIII reference compound. CeriumIII oxalate is also plotted
378 in Figure 6 and presents a single white line, corresponding to the 2p3/2 / 4f15d electronic transition
379 (Takahashi et al., 2002), at ~5724 eV. Consequently, we assume that part of the Ce initially present in 380 the stain as CeIV was then reduced to CeIII during weathering. Linear Combination Fits (LCF) were
381 performed on the derivatives of XANES spectra to determine the relative CeIV and CeIII contents. The
382 results are reported in Table 3 for three different locations on the sample. On average, a CeIII content of
383 38% ± 4% was found. 384
385 Table 3. Results of the Linear Combination Fits (LCF) performed on the derivatives of XANES spectra measured at three
386 different spots of an n-CeO2 sample weathered for 12 weeks in Suntest XLS+ (513 MJ.m-2). The error on the calculated CeIV 387 and CeIII content is ± 10%
n-CeO2 12 weeks CeIV CeIII R chi2
Spot 1 73% 42% 0.012981 0.03407 Spot 2 79% 33% 0.010084 0.02433 Spot 3 75% 38% 0.015139 0.03815 388 389 390
Discussion
391 Release of Ce392 The release of Ce from an acrylic matrix enriched with a CeO2 nanomaterial (Nanobyk additive) was
393 evidenced with our two weathering protocols. Far from being a negligible phenomenon, Ce emissions 394 from 2 to 200 µg.m-2 were measured for each rain event from the beginning of the Suntest experiment.
395 After 46 MJ.m-2, Ce release ranging from 0.08 to 2.9 mg.m-2 was also systematically observed during
396 the immersions of the batch test. The residual release detected for samples maintained in the dark in 397 batch experiment indicates that the exposure to UV (and visible) irradiation is the driving force of the 398 release. Water certainly acts as a vector removing degradation debris from the sample surface, but did 399 not induce weathering in the absence of UV. Combined to UV, it very likely contributed to accentuate 400 the weathering via hydrolytic reactions, as suggested by Wohlleben et al. in the case of polyamide 401 (Wohlleben et al., 2014). Cumulated over the experiment, Ce release caused by water spraying events 402 during Suntest testing reached ca. 3 mg.m-2. Recently, harmonized weathering protocols have been
403 proposed, using external release measurements (Wohlleben et al., 2017) that would exclude such 404 spontaneous release from their assessment, resulting in an inaccurate determination of the released 405 mass.
406
408 The evolution of release as a function of the UV irradiation was thoroughly analyzed in our two 409 weathering scenarios. They revealed dynamic release processes that could similarly be divided in two 410 distinct phases and presented common features in both experiments. The first phase (phase I) showed a 411 decreasing trend with time, similarly to what was described by other authors for paints (Al-Kattan et al., 412 2013; Kaegi et al., 2010). As no clear dependency on light exposure was found, the release mechanism 413 is certainly a wash off of loosely bound material from the surface. Unlike in the above-cited studies, in 414 this experiment, the initial phase was followed by a second one, where Ce emissions increased for 415 irradiated samples and kept growing until the end of the tests. The exposure to UV-visible radiation and 416 the dose received by the samples appeared as key parameters in that phase. In particular, phase II 417 showed a significant accentuation of Ce release with increasing exposure to UV radiation. We postulate 418 then, that release was a consequence of the photo-degradation of the stain, as already witnessed for 419 epoxy (Nguyen et al., 2011) or polyamide (Fernández-Rosas et al., 2016). In both experiments, it was 420 found that the release measured in the second phase accounted for more than 70% of the total Ce release 421 (73% in Suntest and 98% in batch test). Therefore the release due to photo-degradation largely 422 predominates over the release of loose material in this study. No stabilization of Ce release was reached 423 at the end of our experiments. Increased Ce emissions are expected, if weathering proceeds on the same 424 trend, but they could also accentuate and accelerate if matrix aging gets worse. Indeed, previous work 425 already showed that strong damages occurred on commercial photocatalytic stains after 7 months lab 426 weathering, with a direct impact on the amount and the form of TiO2 nanoparticles released during
427 abrasion processes (Shandilya et al., 2015). Prolonged laboratory tests or higher radiant exposures are 428 necessary to determine the long-term release behavior.
429 It is interesting to highlight that the release rates determined in phase II did not follow a linear trend, 430 and were fitted instead by a 2nd order function. Until now, release studies often provided as result a
431 single value of release rate. This is appropriate when release observes a constant or linear trend, as 432 reported for nano-SiO2 in acrylic paints (Al-Kattan et al., 2015) or epoxy (Nguyen et al., 2010).
434 proportional to the UV dose. The authors introduced a relation to describe the release due to UV 435 radiation as follow:
436 𝑅 = 𝑎 × 𝐷𝑏
437 Where R is the release rate in mg.m-2, D the UV irradiation energy in MJ.m-2, and a and b are fitting
438 parameters. A b factor around 1, implying linearity between the release rate and UV dose, was 439 determined on four occasions for release data found in the literature, but values of b ≠ 1 were 440 predominant. Our results support a non-linear release function in the case of the n-CeO2 nanocomposite,
441 but could not be fitted satisfactorily by a power law. This may be due to the fact that the release function 442 proposed by Koivisto et al. is analogous to the Schwarzschild’s law, and describes photo responses 443 resulting from irradiation (Martin et al., 2003). In our experiments an additional factor of degradation 444 was present in the form of water, which may cause a divergence from the power law. Besides, we 445 identified two distinct regimens of Ce release, similarly to what was observed for Si release from 5 wt. 446 % nano-SiO2 epoxy composite (Sung et al., 2015) and polyurethane nanocomposite (Jacobs et al.,
447 2016).
448 It suggests that different processes may be at stake in ENM release and emphasizes the need for 449 investigating the dynamics of release more carefully.
450
451 Long-term release estimates
452 Surprisingly, despite very different weathering conditions, our experimental aging protocols displayed a 453 very good agreement in their overall release tendencies (i.e. stain degradation and Ce release). However, 454 significant deviations appeared with a more quantitative analysis Extrapolation of the data indeed led to 455 totally different estimates of the UV doses necessary to reach 1wt.%, 10wt.% or 100wt.% release of the 456 Ce initially present in the material. In the Suntest experiment, the release of 1% of the initial Ce mass 457 appeared as a realistic scenario for an outdoor exposure of ca.3.5 years. The release of 10% of the initial 458 Ce puts the aging well beyond the typical recommended 5 year lifetime of an outdoor wood stain, and 459 the 100% release of Ce would even take 33 years. On the other hand the extrapolation of batch data (i.e.
460 implying repeated full immersion of the samples) concluded that 1% release should be achieved after a 461 few months, 10% short after 1 year and 100% after about 3 years. All these durations lied within the 462 lifetime of the stain (ca. 5 years) and a 100% release could then be expected based on this experiment. 463
464 Stain degradation due to weathering
465 In addition to release quantification, the alteration of the stain caused by weathering was 466 characterized, based on the occurrence of defects (blisters, flakes or cracks) at the sample surface. It 467 unveiled another divergence between the two weathering protocols, in the defects produced on the 468 stains. Blistering was predominant on both ACR and n-CeO2 samples of the batch testing, while it was
469 rarely observed under natural circumstances. This suggested that the applied weathering conditions may 470 be unrealistic and questioned the reliability of the release assessment in that case. On the contrary, the 471 weathering of ACR stains in the Suntest XLS+, showing slight cracking and flaking, was consistent 472 with what is usually observed under natural conditions (De Windt et al., 2014; Olsson et al., 2014). This 473 confirmed both the good resistance of acrylic stains to weathering and the realistic character of the 474 Suntest experiment.
475 Contrary to ACR samples, the n-CeO2 samples weathered with the Suntest protocol showed a
476 densification of their defects after 155 MJ.m-2. It coincided with the increase of Ce release, reinforcing
477 the hypothesis that Ce emissions of phase II resulted from a degradation of the stain. It also suggested 478 that there is a relationship between defect formation and release. A high density of defects was observed 479 on the Suntest samples and the release rate at 110 MJ.m-2 was around 0.7 mg.m-2. For the batch samples,
480 the density and size of surface defects remained lower, but they displayed an almost ten times higher 481 release rate at 97 MJ.m-2 : 6 mg.m-2. Therefore we conclude that Ce release was not a direct
482 consequence of the formation of cracks or blisters. We rather think that these are two outcomes of the 483 same degradation phenomenon. If the correlation between the formation of defects and release can be 484 confirmed on other systems, defects could however serve as an indicator for release in the future.
485 The higher cracking density measured for n-CeO2 samples with respect to the pure acrylic stain, may
486 result from a stiffening of the film, due to dense Ce. The n-CeO2 samples also developed blisters that
487 were not observed on the ACR samples (CeO2-free stain). This suggests that the incorporation of CeO2
488 nanoparticles to the acrylic matrix modified its response to weathering. 489
490 Aging of CeO2 nanomaterial inside the stain
491 Finally the presence of dissolved Ce was evidenced in lixiviates. X-ray absorption spectroscopy proved 492 that the reductive dissolution of the CeO2 nanomaterial started in the stain, leading to the release of
493 dissolved CeIII in the lixiviates. The initial CeO
2 nanoparticles experienced a transformation during the
494 weathering of the nanocomposite, resulting in the release of a material significantly different from the 495 pristine CeO2 nanoparticles. In the past years, literature reviews established that ENM release from a
496 solid nanocomposite often took the form of nanomaterial embedded in matrix fragments (Froggett et al., 497 2014) behaving differently than the pristine ENM (Al-Kattan et al., 2014). Here, we bring new elements 498 suggesting that even if free ENMs were released, they may have experienced transformations during the 499 weathering process, affecting their fate, their transport, their interactions with organisms and thus 500 modify their behavior in the environment compared to pristine material. Strikingly, the aging of the 501 Nanobyk additive in water under UV radiation brought into light an alteration of the CeO2 nanoparticles
502 (Auffan et al., 2014). However it consisted in a reorganization of Ce atoms at the nanoparticle surface 503 and in that case, no reduction of CeIV to CeIII was detected. In this study, a different response to aging
504 was observed for the Nanobyk additive incorporated to the acrylic stain. On the other hand the acrylic 505 stain also displayed a different weathering behavior with or without embedded nanomaterial. This 506 advocates for the need of studying nanocomposites as novel materials, with potentially different 507 responses than their separate compounds.
509 The dynamics of Ce release from a CeO2-acrylic nanocomposite designed for wood protection was
510 investigated under short- and middle-term assays. It revealed two different regimes of release, as well as 511 a non-linear relationship between the release rate and UV irradiation, highlighting that release 512 phenomena cannot always be properly described by a single release rate value. Efforts should then be 513 made to better characterize the dynamics of release from nanocomposites and help to improve the 514 accuracy of ENM flow models (Wang and Nowack, 2018).
515 In this work, two weathering scenarios (a realistic middle-term experiment in climate chamber and a 516 simplified short-term batch test), specifically designed to monitor the evolution of the release rates with 517 time and UV doses were tested. They displayed a good agreement regarding the occurrence of dual 518 release regimes. In absence of a release plateau during the experiments, polynomial fits of the release 519 curves were used to provide estimates of long-term release. The similarity in general release trends 520 between the two tests showed here some limits, as they led to very different estimates of Ce releases. 521 Indeed, calculations indicate that after 3.5 years, 100 wt.% of the initial Ce will be released based on the 522 batch experiment vs 1 wt.% in the Suntest experiment). .
523 The two protocols also produced different surface defects on the stains. In particular the defects 524 observed on batch samples were pointed out as unrealistic, while the Suntest protocol mimicked natural 525 weathering more faithfully. This supports the reliability of the release rates determined with this 526 procedure and makes it a good candidate for standardized tests. The good agreement of batch 527 experiment on the overall release tendency, suggests that it could rather serve as a screening test, to 528 evaluate the release behavior of a nanocomposite. Systematic testing on a range of materials is 529 necessary before such a use could be validated.
530 Based on the Suntest experiment the release of 1% of the initial Ce mass during the lifetime of the 531 stain appears as realistic. However longer experiments are needed to confirm this estimate. An 532 intensification of the matrix degradations could indeed induce the loss of the acrylic polymer structure, 533 resulting in a third phase of release.
534 Finally, the incorporation of CeO2 nanoparticles into the acrylic matrix has been shown to modify the
535 response of the stain to weathering while the CeO2 nanomaterial experienced a transformation that was
536 not expected based on previous weathering experiments. The weathering of a nanocomposite cannot be 537 decomposed as the weathering of two isolated parts. Synergistic effects can arise between the matrix 538 and its nanomaterial, making the study of the weathering of nanocomposites necessary.
539
540 ACKNOWLEDGMENT.
541 The authors thank TECNALIA Foundation for funding the weathering studies under its internal 542 Nanotechnology Programme. This work was also supported by the project on Sustainable 543 Nanotechnologies (SUN) that received funding from the European Union Seventh Framework 544 Programme (FP7/2007−2013) under grant agreement no. 604305. The project leading to this publication 545 has received funding from “Excellence Initiative” of Aix-Marseille University A*MIDEX, a French 546 “Investissements d’Avenir” program, through its associated Labex SERENADE (n° ANR-11-LABX-547 0064). We acknowledge the European Synchrotron Radiation Facility for provision of synchrotron 548 radiation facilities and we would like to thank the FAME BM30b team for assistance in using their 549 beamline.
551 REFERENCES. 552
553 Al-Kattan, A., Wichser, A., Vonbank, R., Brunner, S., Ulrich, A., Zuin, S., Arroyo, Y., Golanski, L., 554 Nowack, B., 2015. Characterization of materials released into water from paint containing nano-SiO2. 555 Chemosphere 119, 1314–1321. https://doi.org/10.1016/j.chemosphere.2014.02.005
556 Al-Kattan, A., Wichser, A., Vonbank, R., Brunner, S., Ulrich, A., Zuin, S., Nowack, B., 2013. Release 557 of TiO2 from paints containing pigment-TiO2 or nano-TiO2 by weathering. Env. Sci Process Impacts 558 15.
559 Al-Kattan, A., Wichser, A., Zuin, S., Arroyo, Y., Golanski, L., Ulrich, A., Nowack, B., 2014. Behavior 560 of TiO2 Released from Nano-TiO2-Containing Paint and Comparison to Pristine Nano-TiO2. Environ. 561 Sci. Technol. 48, 6710–6718. https://doi.org/10.1021/es5006219
562 Aloui, F., 2006. Rôle des absorbeurs UV inorganiques sur la photstabilisation des systèmes bois-finition 563 transparente (Doctorat). Université Henri Poincaré - Nancy 1, Vandoeuvre les Nancy.
564 Auffan, M., Masion, A., Labille, J., Diot, M.-A., Liu, W., Olivi, L., Proux, O., Ziarelli, F., Chaurand, P., 565 Geantet, C., Bottero, J.-Y., Rose, J., 2014. Long-term aging of a CeO2 based nanocomposite used for 566 wood protection. Environ. Pollut. 188, 1–7. https://doi.org/10.1016/j.envpol.2014.01.016
567 Bernard, C., Nguyen, T., Pellegrin, B., Holbrook, R., Zhao, M., Chin, J., 2011. Fate of grapheme in 568 polymer nanocomposite exposed to UV radiation. J Phys Conf Ser 304.
569 Bossa, N., Chaurand, P., Levard, C., Borschneck, D., Miche, H., Vicente, J., Geantet, C., Aguerre-570 Chariol, O., Michel, F.M., Rose, J., 2017. Environmental exposure to TiO2 nanomaterials incorporated 571 in building material. Environ. Pollut. 220, 1160–1170. https://doi.org/10.1016/j.envpol.2016.11.019 572 Bressot, C., Manier, N., Pagnoux, C., Aguerre-Chariol, O., Morgeneyer, M., 2017. Environmental 573 release of engineered nanomaterials from commercial tiles under standardized abrasion conditions. 574 Journal of Hazardous Materials 322 276-283. https://doi.org/10.1016/j.jhazmat.2016.05.039
575 Busquets-Fité, M., Fernandez, E., Janer, G., Vilar, G., Vázquez-Campos, S., Zanasca, R., Citterio, C., 576 Mercante, L., Puntes, V., 2013. Exploring release and recovery of nanomaterials from commercial 577 polymeric nanocomposites. J Phys Conf Ser 429.
578 Caballero-Guzman, A., Nowack, B., 2016. A critical review of engineered nanomaterial release data: 579 Are current data useful for material flow modeling? Environ. Pollut. 213, 502–517. 580 https://doi.org/10.1016/j.envpol.2016.02.028
581 Chiantore, O., Trossarelli, L., Lazzari, M., 2000. Photooxidative degradation of acrylic and methacrylic 582 polymers. Polymer 41, 1657–1668. https://doi.org/10.1016/S0032-3861(99)00349-3
583 Chin, J., Byrd, E., Embree, N., Garver, J., Dickens, B., 2004. Accelerated UV weathering device based 584 on integrating sphere technology. Rev. Sci. Instrum. 75. https://doi.org/10.1063/1.1808916
585 De Windt, I., Van den Bulcke, J., Wuijtens, I., Coppens, H., Van Acker, J., 2014. Outdoor weathering 586 performance parameters of exterior wood coating systems on tropical hardwood substrates. Eur. J. 587 Wood Wood Prod. 72, 261–272. https://doi.org/10.1007/s00107-014-0779-7
588 Dexpert, H., Karnatak, R.C., Esteva, J.-M., Connerade, J.P., Gasgnier, M., Caro, P.E., Albert, L., 1987. 589 X-ray absorption studies of CeO 2 , PrO 2 , and TbO 2 . II. Rare-earth valence state by L III absorption 590 edges. Phys. Rev. B 36, 1750–1753. https://doi.org/10.1103/PhysRevB.36.1750
591 Duncan, T.V., 2015. Release of Engineered Nanomaterials from Polymer Nanocomposites: the Effect of 592 Matrix Degradation. ACS Appl. Mater. Interfaces 7, 20–39. https://doi.org/10.1021/am5062757
593 Duncan, T.V., Pillai, K., 2015. Release of Engineered Nanomaterials from Polymer Nanocomposites: 594 Diffusion, Dissolution, and Desorption. ACS Appl. Mater. Interfaces 7, 2–19. 595 https://doi.org/10.1021/am5062745
596 Fernández-Rosas, E., Vilar, G., Janer, G., González-Gálvez, D., Puntes, V., Jamier, V., Aubouy, L., 597 Vázquez-Campos, S., 2016. Influence of Nanomaterial Compatibilization Strategies on Polyamide 598 Nanocomposites Properties and Nanomaterial Release during the Use Phase. Environ. Sci. Technol. 50, 599 2584–2594. https://doi.org/10.1021/acs.est.5b05727
600 Finkelstein, L.D., Postnikov, A.V., Efremova, N.N., Kurmaev, E.Z., 1992. X-ray Ce LIII absorption in 601 CeO2 and BaCeO3: experiment and interpretation on the basis of LMTO band structure calculations. 602 Mater. Lett. 14, 115–118. https://doi.org/10.1016/0167-577X(92)90186-N
603 Fiorentino, B., Golanski, L., Guiot, A., Damlencourt, J.-F., Boutry, D., 2015. Influence of paints 604 formulations on nanoparticles release during their life cycle. J. Nanoparticle Res. 17, 1–13. 605 https://doi.org/10.1007/s11051-015-2962-0
606 Forsthuber, B., Müller, U., Teischinger, A., Grüll, G., 2013. Chemical and mechanical changes during 607 photooxidation of an acrylic clear wood coat and its prevention using UV absorber and micronized 608 TiO2. Polym. Degrad. Stab. 98, 1329–1338. https://doi.org/10.1016/j.polymdegradstab.2013.03.029 609 Froggett, S.J., Clancy, S.F., Boverhof, D.R., Canady, R.A., 2014. A review and perspective of existing 610 research on the release of nanomaterials from solid nanocomposites. Part. Fibre Toxicol. 11, 17. 611 https://doi.org/10.1186/1743-8977-11-17
612 Hirth, S., Cena, L., Cox, G., Tomovic, Z., Peters, T., Wohlleben, W., 2013. Scenarios and methods that 613 induce protruding or released CNTs after degradation of nanocomposite materials. J Nanopart Res 15. 614 https://doi.org/10.1007/s11051-013-1504-x
615 Hsu, L.-Y., Chein, H.-M., 2007. Evaluation of nanoparticle emission for TiO2 nanopowder coating 616 materials. J. Nanoparticle Res. 9, 157–163. https://doi.org/10.1007/s11051-006-9185-3
617 INES Education, n.d. CalSol.
618 Irmouli, Y., George, B., Merlin, A., 2012. Artificial ageing of wood finishes monitored by IR analysis 619 and color measurements. J. Appl. Polym. Sci. 124, 1938–1946. https://doi.org/10.1002/app.34797
620 ISO 4628-1, 2003. Paints and varnishes -- Evaluation of degradation of coatings -- Designation of 621 quantity and size of defects, and of intensity of uniform changes in appearance -- Part 1: General 622 introduction and designation system. International Standards Organization.
623 ISO 4628-2, 2003. Paints and varnishes -- Evaluation of degradation of coatings -- Designation of 624 quantity and size of defects, and of intensity of uniform changes in appearance -- Part 2: Assessment of 625 degree of blistering. International Standards Organization.
626 ISO 4628-4, 2003. Paints and varnishes -- Evaluation of degradation of coatings -- Designation of 627 quantity and size of defects, and of intensity of uniform changes in appearance -- Part 4: Assessment of 628 degree of cracking. International Standards Organization.
629 ISO 4628-5, 2003. Paints and varnishes -- Evaluation of degradation of coatings -- Designation of 630 quantity and size of defects, and of intensity of uniform changes in appearance -- Part 5: Assessment of 631 degree of flaking. International Standards Organization.
632 Jacobs, D.S., Huang, S.-R., Cheng, Y.-L., Rabb, S.A., Gorham, J.M., Krommenhoek, P.J., Yu, L.L., 633 Nguyen, T., Sung, L., 2016. Surface degradation and nanoparticle release of a commercial 634 nanosilica/polyurethane coating under UV exposure. Journal of Coatings Technology and Research 13 635 5, 735-751. https://doi.org/10.1007/s11998-016-9796-2
636
637 Kaegi, R., Sinnet, B., Zuleeg, S., Hagendorfer, H., Mueller, E., Vonbank, R., Boller, M., Burkhardt, M., 638 2010. Release of silver nanoparticles from outdoor facades. Environ. Pollut. 158, 2900–2905. 639 https://doi.org/10.1016/j.envpol.2010.06.009
640 Kaegi, R., Ulrich, A., Sinnet, B., Vonbank, R., Wichser, A., Zuleeg, S., Simmler, H., Brunner, S., 641 Vonmont, H., Burkhardt, M., Boller, M., 2008. Synthetic TiO2 nanoparticle emission from exterior 642 facades into the aquatic environment. Environ. Pollut. 156, 233–239. https://doi.org/doi: 643 10.1016/j.envpol.2008.08.004
644 Kielmann, B.C., Mai, C., 2016. Application and artificial weathering performance of translucent 645 coatings on resin-treated and dye-stained beech-wood. Prog. Org. Coat. 95, 54–63. 646 https://doi.org/10.1016/j.porgcoat.2016.02.019
647 Koivisto, A.J., Jensen, A.C.Ø., Kling, K.I., Nørgaard, A., Brinch, A., Christensen, F., Jensen, K.A., 648 2017. Quantitative material releases from products and articles containing manufactured nanomaterials: 649 Towards a release library. NanoImpact 5, 119–132. https://doi.org/10.1016/j.impact.2017.02.001
650 Künniger, T., Gerecke, A.C., Ulrich, A., Huch, A., Vonbank, R., Heeb, M., Wichser, A., Haag, R., 651 Kunz, P., Faller, M., 2014. Release and environmental impact of silver nanoparticles and conventional 652 organic biocides from coated wooden façades. Environ. Pollut. 184, 464–471. 653 https://doi.org/10.1016/j.envpol.2013.09.030
654 Mackevica, A., Foss Hansen, S., 2016. Release of nanomaterials from solid nanocomposites and 655 consumer exposure assessment – a forward-looking review. Nanotoxicology 10, 641–653. 656 https://doi.org/10.3109/17435390.2015.1132346
657 Martin, J.W., Chin, J.W., Nguyen, T., 2003. Reciprocity law experiments in polymeric photo-658 degradation: a critical review. Keyst. 2002 47, 292–311. https://doi.org/10.1016/j.porgcoat.2003.08.002 659 Météo France - Météo et Climat [WWW Document], n.d. . Météo Fr. URL 660 http://www.meteofrance.com
661 Neubauer, N., Scifo, L., Navratilova, J., Gondikas, A., Mackevica, A., Borschneck, D., Chaurand, P., 662 Vidal, V., Rose, J., von der Kammer, F., Wohlleben, W., 2017. Nanoscale Coloristic Pigments: Upper 663 Limits on Releases from Pigmented Plastic during Environmental Aging, In Food Contact, and by 664 Leaching. Environ. Sci. Technol. 51, 11669–11680. https://doi.org/10.1021/acs.est.7b02578
665 NF EN 927-6, 2006. Paints and varnishes. Coating materials and coating systems for exterior wood. 666 Exposure of wood coatings to artificial weathering using fluorescent UV lamps and water. Association 667 Française de Normalisation.
668 Nguyen, T., Pellegrin, B., Bernard, C., Gu, X., Gorham, J.M., Stutzman, P., Stanley, D., Shapiro, A., 669 Byrd, E., Hettenhouser, R., Chin, J., 2011. Fate of nanoparticles during life cycle of polymer 670 nanocomposites. J Phys Conf Ser 304.
671 Nguyen, T., Pellegrin, B., Bernard, C., Gu, X., Gorham, J.M., Stutzman, P.E., Shapiro, A., Byrd, E., 672 Chin, J.W., 2010. Direct Evidence of Nanoparticle Release from Epoxy Nanocomposites Exposed to 673 UV Radiation, in: Nanotech 2010: Technical Proceedings of the 2010 NSTI Nanotechnology 674 Conference and Expo. Presented at the NSTI-Nanotech 2010, CRC Press, pp. 724–727.
675 Olabarrieta, J., Zorita, S., Peña, I., Rioja, N., Monzón, O., Benburia, P., Scifo, L., 2012. Aging of 676 photocatalytic coatings under a water flow: Long run performance and TiO2 nanoparticle release. Appl 677 Catal B Env. 182.
678 Olsson, S.K., Johansson, M., Westin, M., Östmark, E., 2014. Reactive UV-absorber and epoxy 679 functionalized soybean oil for enhanced UV-protection of clear coated wood. Polym. Degrad. Stab. 110, 680 405–414. https://doi.org/10.1016/j.polymdegradstab.2014.09.017
681 Pellegrin, B., Nguyen, T., Mermet, L., Shapiro, A., Gu, X., Chin, J., 2009. Degradation and nanoparticle 682 release of epoxy/nanosilica composites exposed to solar UV radiation. Nanotech 1.
683 Podgorski, L., Arnold, M., Hora, G., 2003. A reliable artificial weathering test for Wood Coatings. 684 Coating World 2, 39-48
685
686 Popescu, C.-M., Simionescu, B.C., 2013. Structural Study of Photodegraded Acrylic-Coated Lime 687 Wood Using Fourier Transform Infrared and Two-Dimensional Infrared Correlation Spectroscopy. 688 Appl. Spectrosc. 67, 606–613. https://doi.org/10.1366/12-06628
689 Ravel, B., Newville, M., 2005. ATHENA, ARTEMIS, HEPHAESTUS : data analysis for X-ray 690 absorption spectroscopy using IFEFFIT. J. Synchrotron Radiat. 12, 537–541. 691 https://doi.org/10.1107/S0909049505012719
692 Reijnders, L., 2009. The release of TiO2 and SiO2 nanoparticles from nanocomposites. Polym. Degrad. 693 Stab. 94, 873–876. https://doi.org/10.1016/j.polymdegradstab.2009.02.005
694 Shandilya, N., Le Bihan, O., Bressot, C., Morgeneyer, M., 2015. Emission of Titanium Dioxide 695 Nanoparticles from Building Materials to the Environment by Wear and Weather. Environ. Sci. 696 Technol. 49, 2163–2170. https://doi.org/10.1021/es504710p
697 SoDa - Web Services [WWW Document], n.d. . Sol. Radiat. Data. URL http://www.soda-pro.com/web-698 services
699 Söhnel, O., Garside, J., 1992. Precipitation: basic principles and industrial applications. Butterworth-700 Heinemann, Oxford [England] ; Boston.
701 Som, C., Berges, M., Chaudhry, Q., Dusinska, M., Fernandes, T.F., Olsen, S.I., Nowack, B., 2010. The 702 importance of life cycle concepts for the development of safe nanoproducts. Toxicology 269, 160–169. 703 https://doi.org/10.1016/j.tox.2009.12.012
704 Sung, L., Stanley, D., Gorham, J.M., Rabb, S., Gu, X., Yu, L.L., Nguyen, T., 2015. A quantitative study 705 of nanoparticle release from nanocoatings exposed to UV radiation. J. Coat. Technol. Res. 12, 121–135. 706 https://doi.org/10.1007/s11998-014-9620-9
707 Szakal, C., Roberts, S.M., Westerhoff, P., Bartholomaeus, A., Buck, N., Illuminato, I., Canady, R., 708 Rogers, M., 2014. Measurement of Nanomaterials in Foods: Integrative Consideration of Challenges 709 and Future Prospects. ACS Nano 8, 3128–3135. https://doi.org/10.1021/nn501108g
710 Tella, M., Auffan, M., Brousset, L., Issartel, J., Kieffer, I., Pailles, C., Morel, E., Santaella, C., 711 Angeletti, B., Artells, E., Rose, J., Thiéry, A., Bottero, J.-Y., 2014. Transfer, Transformation, and
712 Impacts of Ceria Nanomaterials in Aquatic Mesocosms Simulating a Pond Ecosystem. Environ. Sci. 713 Technol. 48, 9004–9013. https://doi.org/10.1021/es501641b
714 Tella, M., Auffan, M., Brousset, L., Morel, E., Proux, O., Chanéac, C., Angeletti, B., Pailles, C., Artells, 715 E., Santaella, C., Rose, J., Thiéry, A., Bottero, J.-Y., 2015. Chronic dosing of a simulated pond 716 ecosystem in indoor aquatic mesocosms: fate and transport of CeO 2 nanoparticles. Environ. Sci. Nano
717 2, 653–663. https://doi.org/10.1039/C5EN00092K
718 Vilar, G., Fernández-Rosas, E., Puntes, V., Jamier, V., Aubouy, L., Vázquez-Campos, S., 2013. 719 Monitoring migration and transformation of nanomaterials in polymeric composites during accelerated 720 aging. J Phys Conf Ser 429.
721 Wang, Y., Nowack, B., 2018. Dynamic probabilistic material flow analysis of nano-SiO2, nano iron 722 oxides, nano-CeO2, nano-Al2O3, and quantum dots in seven European regions. Environ. Pollut. 235, 723 589–601. https://doi.org/10.1016/j.envpol.2018.01.004
724 Wohlleben, W., Brill, S., Meier, M.W., Mertler, M., Cox, G., Hirth, S., von Vacano, B., Strauss, V., 725 Treumann, S., Wiench, K., Ma-Hock, L., Landsiedel, R., 2011. On the Lifecycle of Nanocomposites: 726 Comparing Released Fragments and their In-Vivo Hazards from Three Release Mechanisms and Four 727 Nanocomposites. Small 7, 2384–2395. https://doi.org/10.1002/smll.201002054
728 Wohlleben, W., Kingston, C., Carter, J., Sahle-Demessie, E., Vázquez-Campos, S., Acrey, B., Chen, C.-729 Y., Walton, E., Egenolf, H., Müller, P., Zepp, R., 2017. NanoRelease: Pilot interlaboratory comparison 730 of a weathering protocol applied to resilient and labile polymers with and without embedded carbon 731 nanotubes. Carbon 113, 346–360. https://doi.org/10.1016/j.carbon.2016.11.011
732 Wohlleben, W., Meier, M.W., Vogel, S., Landsiedel, R., Cox, G., Hirth, S., Tomovic, Z., 2013. Elastic 733 CNT-polyurethane nanocomposite: synthesis, performance and assessment of fragments released during 734 use. Nanoscale 5, 369–380. https://doi.org/10.1039/C2NR32711B
735 Wohlleben, W., Neubauer, N., 2016. Quantitative rates of release from weathered nanocomposites are 736 determined across 5 orders of magnitude by the matrix, modulated by the embedded nanomaterial. 737 NanoImpact 1, 39–45. https://doi.org/10.1016/j.impact.2016.01.001
738 Wohlleben, W., Vilar, G., Fernández-Rosas, E., González-Gálvez, D., Gabriel, C., Hirth, S., Frechen, 739 T., Stanley, D., Gorham, J., Sung, L.-P., Hsueh, H.-C., Chuang, Y.-F., Nguyen, T., Vazquez-Campos, 740 S., 2014. A pilot interlaboratory comparison of protocols that simulate aging of nanocomposites and 741 detect released fragments. Environ. Chem. 11, 402–418.
742 Zuin, S., Gaiani, M., Ferrari, A., Golanski, L., 2013. Leaching of nanoparticles from experimental 743 water-borne paints under laboratory test conditions. J. Nanoparticle Res. 16, 2185. 744 https://doi.org/10.1007/s11051-013-2185-1
747 FIGURES. 748
749
750
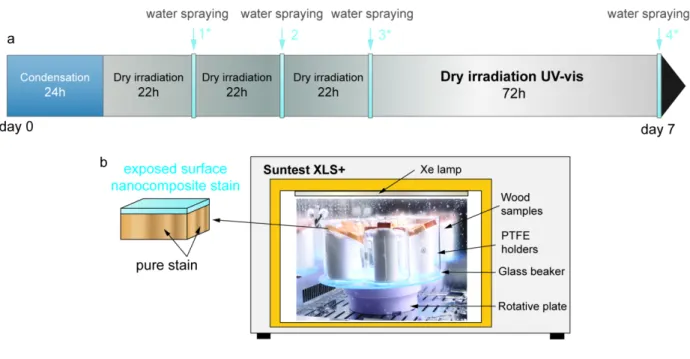
Figure 1. Experimental setup and procedure for weathering in climate chamber. a Weekly weathering cycle. Gray areas correspond to dry irradiation (UV-vis) phases while 20 minutes spraying events (MilliQ-water) appear in light blue. Water sampling is notified by an asterisk whenever the case. b Experimental setup inside Suntest XLS+ (right). Irradiation under Xe lamp and water spraying phases were applied alternatively. n-CeO2 wood samples were coated with stain
enriched with CeO2 additive on their exposed face ( = upper face), and Ce-free stain on the remaining faces, as illustrated