HAL Id: hal-02140608
https://hal.archives-ouvertes.fr/hal-02140608
Submitted on 4 Nov 2020
HAL is a multi-disciplinary open access
archive for the deposit and dissemination of sci-entific research documents, whether they are pub-lished or not. The documents may come from teaching and research institutions in France or abroad, or from public or private research centers.
L’archive ouverte pluridisciplinaire HAL, est destinée au dépôt et à la diffusion de documents scientifiques de niveau recherche, publiés ou non, émanant des établissements d’enseignement et de recherche français ou étrangers, des laboratoires publics ou privés.
Nitric oxide (NO) photo-release in a series of
ruthenium–nitrosyl complexes: new experimental
insights in the search for a comprehensive mechanism
Max Roose, Marine Tassé, Pascal G. Lacroix, Isabelle Malfant
To cite this version:
Max Roose, Marine Tassé, Pascal G. Lacroix, Isabelle Malfant. Nitric oxide (NO) photo-release in a series of ruthenium–nitrosyl complexes: new experimental insights in the search for a comprehen-sive mechanism. New Journal of Chemistry, Royal Society of Chemistry, 2019, 43 (2), pp.755-767. �10.1039/c8nj03907k�. �hal-02140608�
1
Nitric oxide (NO) photo-release in a series of ruthenium-nitrosyl complexes:
new experimental insights in the search of a comprehensive mechanism
Max Roose,a Marine Tassé,a Pascal G. Lacroix,*a and Isabelle Malfant*a
a
CNRS, LCC (Laboratoire de Chimie de Coordination), 205 route de Narbonne, 31077 Toulouse, France.
* corresponding authors. E-mail : pascal.lacroix@lcc-toulouse.fr ; isabelle.malfant@lcc-toulouse.fr
___________________________________________________________________________
Abstract
A series of four ruthenium (II) complexes built from the [Ru(terpy)(bipy)(NO)]3+ core (terpy is the 2,2’:6’,2’’-terpyridine and bipy is the 2,2’-bipyridine) is investigated. They differ by the presence of zero, one, two, or three 4’-(4-methoxyphenyl) (MP) electron donor substituents introduced at different positions on the pyridine fragments to increase the intramolecular charge transfer capabilities towards the strongly withdrawing nitrosyl (NO) ligand. The UV-visible spectra reflect the presence and position of the MP substituents on the complexes. In the case of species containing the 4’-(MP)-terpy ligand, a low-lying transition is identified as arising from a 4’-(MP)-terpy to Ru(NO) intramolecular charge transfer, which is further confirmed by a TD-DFT analysis. Irradiations performed at = 436 nm on this isolated transition on different complexes lead to quantum yields of NO photo-release equal to 0.002 and 0.011, in a ratio of 6 (instead of 1), which allows concluding non-ambiguously that a single electron transition cannot account for the NO release mechanism.
2
Introduction
Nitric oxide (NO·) has been recognized to possess many biological functions such as blood pressure regulation, stimulation of immune response, neurotransmission and cytotoxic activity in tumor cells by apoptosis.1,2 These numerous potential therapeutic actions have prompted research aimed at developing efficient NO· donor molecules. Among them, ruthenium-nitrosyl [Ru(NO)] complexes provide particularly appealing candidates in relation with their generally low toxicity, good chemical stability, and moreover their capability to release NO· under light irradiation in the = 300-600 nm domain, exclusively,3,4 taking advantage of the noninvasive and highly controllable characteristics of light, according to the following equation:
[𝑅𝑢𝐼𝐼(𝑁𝑂+)] + 𝑠𝑜𝑙𝑣𝑒𝑛𝑡 ℎ𝜈→ [𝑅𝑢𝐼𝐼𝐼(𝑠𝑜𝑙𝑣𝑒𝑛𝑡)] + 𝑁𝑂· (1)
NO is a classic non-innocent ligand and metal-nitrosyls can have different electronic structure descriptions depending on their coordination environment. In the complexes here under investigation, the total number of electrons present in the ruthenium 3d orbitals and the * orbitals of the nitrosyl ligand is equal to 6, which is written {RuNO}6 in the Enemark and Feltham notation which avoids the assignment of a formal oxidation state of the metal and a charge on the ligand.5,6 However, it is reported that almost any {RuNO}6 electronic configurations correspond to the formal RuIINO+ electronic structure, which is EPR silent and in which the nitrosyl is regarded as a cation.7 The presence of this resulting diamagnetic singlet ground state has been further supported by several computational studies.8-11 Under these assumptions, the photo-release of the NO· radical depicted in equation (1) occurs after a formal electron transfer to the nitrosyl ligand, achieved within an intense low-lying electron transition having a strong charge transfer character towards the strongly withdrawing nitrosyl, in any case.
Several research teams have targeted NO· donors in the class of ruthenium-bipyridine12-14 and ruthenium-terpyridine12a,,15-17 complexes, built up from ligands of different donating/accepting capabilities. As a part of this research effort, we have recently reported on various ruthenium-nitrosyl complexes based on the [Ru(tpy)(bpy)(NO)]3+ core18 ([RuT0B0]3+ in Scheme 1) initially investigated by Meyer et al.19 (tpy stands for 2,2’:6’,2’’-terpyridine and bpy for 2,2’-bipyridine). These various attempts were motivated by the idea that introducing a donor (either fluorene,18a carbazole,18b or methoxyphenyl18c) on the terpyridine ligand would favor an intense charge transfer towards the RuNO fragment, thus increasing the quantum yield of NO· release (NO = number of NO· generated / number
3 In the present contribution, we wish to target the role devoted to an electron donating substituent in the optical and photo-chemical properties of the ruthenium nitrosyl species through the investigation of a set of substitution achieved either on the terpyridine ([RuT1B0]3+), on the bipyridine ([RuT0B2]3+), and on both ligands ([RuT1B2]3+), as shown in Scheme 1. After the report and whole characterization of the ruthenium complexes, their optical spectra will be presented experimentally and approached computationally, within the framework of the density functional theory (DFT) to determine the origin of the observed transitions. NO will be investigated by irradiation on the low-lying “push-pull”
transitions, and tentatively analyzed in an attempt to provide new features towards a comprehensive description of the release process.
Scheme 1 [Ru(terpy)(bipy)(NO)]2+ complexes with 0, 1, 2, and 3 methoxyphenyl substituents.
Experimental
Starting materials and equipment
The 4,4’-bis(4-methoxyphenyl)-2,2’-bipyridine (MP2bipy) 20
and 4’-(4-methoxyphenyl)-2,2’:6’,2’’-terpyridine (MPterpy)21 ligands were synthesized as previously described in the literature. Likewise,
4 [Ru(terpy)(Cl)3] and [Ru(MPterpy)(Cl)3] was synthetized following Adcock’s procedure.
22
Triethylamine (Sigma-Aldrich), LiCl (Alfa Aesar), Ethylene glycol (Fluka), NH4PF6 (Alfa Aesar), and
NaNO2 (Fluka) were the highest purity grade and were used as received. The 1H NMR and 13C NMR spectra were recorded at 298 K with a Bruker Avance 400 spectrometer, using CDCl3, CD3OD or CD3CN as an internal reference. The IR spectra were recorded with a Perkin–Elmer (FTIR/FIR) 100 Spectrometer. The ESI mass spectra were performed on a UPLC Xevo G2 Q TOF (Waters) spectrometer. The UV-Vis spectra were obtained on a Perkin Elmer Lambda 35 UV-Vis spectrometer.
For the deconvolution of the spectra, the shapes of the transitions were assumed to correspond to Gaussian functions while drawn against the transition energies. Elemental analyses were performed at LCC with a Perkin–Elmer 2400 series II Instrument. Electron paramagnetic resonance experiments (EPR) were performed on a Bruker ESP 500E spectrometer. The setting employed for the measurements was the same as that previously reported.18c [Fe(MGD)2] (MGD =
N–methyl-D-glucamine dithiocarbamate) was used as a spin trapping reagent.23 The light source was a 250 W Oriel Hg lamp (Palaiseau, France).
Synthesis
The synthetic route towards [RuT0B2](PF6)3, and [RuT0B2](PF6)3 is summarized in Scheme 2. The atom labeling used for the 1 H- and 13C-NMR assignments is provided as supplementary information (Figure S3).
5
[RuII(terpy)(MP2bipy)Cl](Cl). [Ru
III
(terpy)Cl3] (88 mg, 0.2 mmol), MP2bipy (74 mg, 0.2 mmol),
lithium chloride (64 mg, 1.5 mmol), ethylene glycol (27 mL), and triethylamine (0.24 mL, 1.7 mmol) were successively added into a 50 mL flask. The mixture was heated at 160°C during 4h. After a hot filtration, the mixture was evaporated to dryness under reduced pressure, at 120°C. The residue obtained was washed with a large volume of water and sonicated, and finally filtered and dried under vacuum, providing 99 mg (64%) of the desired compound, as a dark purple solid. 1H NMR (CD3OD,
400 MHz) : δ 10.15 (1H, d, H6B, 3 J6/5 = 6.0 Hz); 9.17 (1H, d, H3B, 4 J3/5 = 2.0 Hz); 8.88 (1H, d, H3’B, 4 J3’/5’ = 1.9 Hz); 8.66 (2H, d, H3’T + H5’T, 3J3’/4’ = 3J5’/4’ = 8.1 Hz); 8.54 (2H, d, H3T + H3’’T, 3 J3/4 = 3 J3’’/4’’ = 7.9 Hz); 8.28 (1H, dd, H5B, 3 J5/6 = 6.1 Hz, 4 J5/3 = 1.9 Hz); 8.17-8.20 (2H, m, H2P + H6P); 8.14-8.17 (1H, t, H4’T, 3J4’/3’ = 3J4’/5’ = 8.1 Hz); 7.94 (2H, td, H4T + H4’’T, 3 J4/3 = 3 J4/5 = 3 J4’’/3’’ = 3J4’’/5’’ = 7.9 Hz, 4J4/6 = 4J4’’/6’’ = 1.6 Hz); 7.82 (2H, m, H6T + H6’’T); 7.77 (2H, m, H2’P + H6’P); 7.36 (2H, m, H5T + H5’’T); 7.28 (2H, m, H5’B + H6’B); 7.23 (2H, m, H3P + H5P); 7.02 (2H, m, H3’P + H5’P); 3.95 (3H, s, OCH3); 3.82 (3H, s, OCH3). 13 C NMR (CD3OD, 100 MHz) : δ 163.18 (C4P or C4’P); 163.05 (C4P or C4’P); 160.61 (C2’B); 160.33 (C2T + C2’’T); 159.65 (C2’T + C6’T); 158.10 (C2B); 153.47 (C6B); 153.36 (C6T + C6’’T); 152.48 (C6’B); 149.94 (C4B); 149.01 (C4’B); 138.30 (C4T + C4’’T); 135.22 (C4’T); 130.04 (C2P + C6P); 129.86 (C1P); 129.72 (C2’P + C6’P); 129.13 (C1’P); 128.56 (C5T + C5’’T); 124.76 (C3T + C3’’T); 124.69 (C5B); 124.08 (C5’B); 123.65 (C3’T + C5’T); 121.48 (C3B); 121.35 (C3’B); 115.97 (C3P + C5P); 115.76 (C3’P +
C5’P); 55.34 (OCH3); 55.24 (OCH3). ESI-MS : m/z: 738.5 [M] +
.
[RuII(terpy)(MP2bipy)(NO2)](PF6). [Ru
II
(terpy)(MP2bipy)(Cl)](Cl) (95 mg, 0.12 mmol) was dissolved
in a mixture of ethanol (8.6 mL) and water (2.9 mL). After complete dissolution, NaNO2 (83 mg, 1.2
mmol) was added and the violet resulting solution was heated under reflux for 3h30. The solution turned dark red. After cooling down to room temperature, an excess of NH4PF6 (250 mg, 1.53 mmol)
dissolved in 1 mL of water was added. The solution was concentrated to three-quarters of its volume and the resulting solution was cooled in a fridge overnight. After a filtration and a washing with cold water, a dark red solid was dried under vacuum, affording 73 mg (68 %) of the desired compound. 1H NMR (CD3CN, 400 MHz) : δ 9.82 (1H, d, H6B, 3 J6/5 = 6.1 Hz); 8.93 (1H, d, H3B, 4 J3/5 = 2.0 Hz); 8.69 (1H, d, H3’B, 4J3’/5’ = 1.8 Hz); 8.49 (2H, d, H3’T + H5’T, 3J3’/4’ = 3J5’/4’ = 8.0 Hz); 8.37 (2H, d, H3T + H3’’T, 3 J3/4 = 3 J3’’/4’’ = 8.0 Hz); 8.21-8.16 (2H, m, H5B + H4’T); 8.10 (2H, m, H2P + H6P); 7.94 (2H, td, H4T + H4’’T, 3J4/3 = 3J4/5 = 3J4’’/3’’ = 3J4’’/5’’ = 7.8 Hz, 4J4/6 = 4J4’’/6’’ = 1.5 Hz); 7.83 (2H, dd, H6T + H6’’T, 3J6/5 = 3 J6’’/5’’ = 5.5 Hz, 4J6/4 = 4 J6’’/4’’ = 1.4 Hz); 7.74 (2H, m, H2’P + H6’P); 7.34-7.22 (6H, m, H5T + H5’’T + H5’B + H6’B + H3P + H5P); 7.04 (2H, m, H3’P + H5’P); 3.94 (3H, s, OCH3); 3.83 (3H, s, OCH3) 13 C NMR (CD3CN, 100 MHz) : δ 162.69 (C4P ou C4’P); 162.62 (C4P ou C4’P); 159.56 (C2T + C2’’T); 159.09 (C2’T + C6’T); 158.14 (C2’B); 157.19 (C2B); 153.70 (C6B); 153.50 (C6T + C6’’T); 151.81 (C6’B); 149.50 (C4’B); 149.20 (C4B); 138.74 (C4T + C4’’T); 136.40 (C4’T); 129.91 (C2P + C6P); 129.84 (C2’P + C6’P); 129.34 (C1P); 128.72 (C1’P); 128.44 (C5T + C5’’T); 124.57 (C3T + C3’’T + C5B); 123.73 (C3’T + C5’T + C5’B); 121.57 (C3B); 121.10 (C3’B); 115.92 (C3P + C5P); 115.63 (C3’P + C5’P); 56.34 (OCH3); 55.24
6 (OCH3). ESI-MS: m/z : 749.1 [M] + ; 372 [M-NO2+CH3CN] 2+ ; 252. IR: (cm-1): 1387 (NO2), 1346 (NO2), 839 (PF6), 558 (PF6).
[RuT0B2](PF6)3. [Ru(terpy)(MP2bipy)(NO2)](PF6) (75 mg, 0.083 mmol) was dissolved in a mixture of
ethanol (30 mL) and HCl 37% (7 mL). The resulting dark red-brown solution was heated at 60°C for 1 hour. The mixture was left at room temperature, and an excess of NH4PF6 (250 mg, 1.53 mmol)
dissolved in 3 mL of water was added. A beginning of precipitation was noticed. The solution was put in a fridge for 2h30. Filtrating, washing with cold water, and eventually drying under vacuum afforded 75 mg (77 %) of a dark yellow solid. 1H NMR (CD3CN, 400 MHz) : δ 9.23 (1H, d, H6B,
3 J6/5 = 6.2 Hz); 9.16 (1H, d, H3B, 4 J3/5 = 2.0 Hz); 9.00 (1H, m, H4’T); 8.95-8.92 (3H, m, H3’T + H5’T + H3’B); 8.76 (2H, d, H3T + H3’’T, 3J3/4 = 3 J3’’/4’’ = 7.9 Hz); 8.51-8.45 (3H, m, H4T + H4’’T + H5B); 8.24 (2H, m, H2P + H6P); 8.17 (2H, dd, H6T + H6’’T, 3J6/5 = 3 J6’’/5’’ = 5.7 Hz, 4J6/4 = 4 J6’’/4’’ = 1.4 Hz); 7.91 (2H, m, H2’P + H6’P); 7.76 (2H, m, H5T + H5’’T); 7.62 (1H, ddd, H5’B, 3 J5’/4’ = 7.8 Hz, 3J5’/6’ = 5.7 Hz, 4J5’/3’ =1.3 Hz); 7.31 (2H, m, H3P + H5P); 7.13 (2H, m, H3’P + H5’P); 7.11 (1H, m, H6’B); 4.00 (3H, s, OCH3); 3.97 (3H, s, OCH3). 13 C NMR (CD3CN, 100 MHz) : δ 164.36 (C4’P); 164.20 (C4P); 157.6 (C2T + C2’’T); 156.00 (C2’B); 155.66 (C6T + C6’’T); 155.57 (C2B + C4’B); 155.16 (C2’T + C6’T); 154.69 (C4B); 153.44 (C6B); 148.31 (C6’B); 147.90 (C4’T); 145.36 (C4T + C4’’T); 131.27 (C5T + C5’’T); 131.01 (C2P + C6P ou C2’P + C6’P); 130.95 (C2P + C6P ou C2’P + C6’P); 128.66 (C3T + C3’’T); 128.44 (C3’T + C5’T); 127.28 (C1P); 127.18 (C5B); 126.74 (C1’P); 126.24 (C5’B); 124.34 (C3B); 123.47 (C3’B); 116.26 (C3P + C5P); 116.14 (C3’P +
C5’P); 56.54 (OCH3); 56.52 (OCH3). IR: (cm -1
): 1937 (NO), 816 (PF6), 552 (PF6). ESI-MS: m/z:
360 [Ru(terpy)(MP2bpy)(H2O)] 2+ ; 372 [Ru(terpy)(MP2bpy)(CH3CN)] 2+ ; 749 [Ru(terpy)(MP2bpy)(NO2)] +
. UV-Vis (CH3CN): λmax (ε): 229 nm (55000 L.mol -1
.cm-1), 292 nm (43000 L.mol-1.cm-1), 322 nm (sh), 360 nm (33000 L.mol-1.cm-1). Anal. Calcd for C39H31F18N6O3P3Ru: C,
40.12; H, 2.68; N, 7.2. Found: C, 40.43; H, 2.34; N, 7.2.
[Ru(MPterpy)(MP2bipy)Cl](Cl). [Ru(MPterpy)Cl3] (137 mg, 0.25 mmol), MP2bipy (92 mg, 0.25
mmol), lithium chloride (80 mg, 1.875 mmol [7.5 eq]), ethylene glycol (29 mL), and triethylamine (0.29 mL, 2.125 mmol) were successively introduced in a 50 mL flask. The mixture was heated at 170°C during 8h. After a hot filtration, the solution was evaporated to dryness under reduced pressure at 120°C. The residue obtained was washed with a huge amount of water and sonicated. The resulting dark purple solid is filtered, washed with water, a minimum of ethanol and ether, and dried under vacuum, affording 180 mg (82 %) of the desired compound. 1H NMR (CD3OD, 400 MHz) : δ 10.20
(1H, d, H6B, 3 J6/5 = 6.0 Hz); 9.19 (1H, d, H3B, 4 J3/5 = 1.9 Hz); 8.90 (3H, m, H3’T + H5’T + H3’B; 8.69 (2H, d, H3T + H3’’T, 3J3/4 = 3 J3’’/4’’ = 7.9 Hz ); 8.31 (1H, dd, H5B, 3 J5/6 = 6.2 Hz, 4 J5/3 = 1.9 Hz); 8.21 (2H, d, H2Pb + H6Pb, 3 J2/3 = 3 J6/5 = 8.4 Hz); 8.15 (2H, d, H2Pt + H6Pt, 3 J2/3 = 3 J6/5 = 8.3 Hz); 7.93 (2H, m, H4T + H4’’T); 7.84 (2H, d, H6T + H6’’T, 3J6/5 = 3 J6’’/5’’ = 5.4 Hz); 7.79 (2H, d, H2’Pb + H6’Pb, 3J2’/3’ = 3J6’/5’ = 8.5 Hz); 7.38-7.36 (3H, m, H6’B + H5T + H5’’T); 7.31-7.29 (1H, m, H5’B); 7.26-7.21 (4H, m, H3Pb + H5Pb +
7 H3Pt + H5Pt); 7.04 (2H, m, H3’Pb + H5’Pb, 3J3’/2’ = 3J5’/6’ = 8.5 Hz); 3.97 (3H, s, OCH3); 3.96 (3H, s, OCH3); 3.84 (3H, s, OCH3). 13 C NMR (CD3OD, 100 MHz) : δ 161.79 (C4Pb); 161.65 (C4’Pb); 161.59 (C4Pt); 159.31 (C2’B); 159.18 (C2T + C2’’T); 158.13 (C2’T + C6’T); 156.82 (C2B); 152.12 (C6B); 152.00 (C6T + C6’’T); 151.09 (C6’B); 148.43 (C4B); 147.52 (C4’B); 146.55 (C4’T); 136.80 (C4T + C4’’T); 128.95 (C1Pt); 128.63 (C2Pt + C6Pt + C2Pb + C6Pb); 128.50 (C1Pb); 128.30 (C2’Pb + C6’Pb); 127.78 (C1’Pb); 127.04 (C5T + C5’’T); 123.54 (C3T + C3’’T); 123.26 (C5B); 122.67 (C5’B); 120.07 (C3B); 119.92 (C3’B); 119.29 (C3’T + C5’T); 114.57 (C3Pb + C5Pb or C3Pt + C5Pt); 114.55 (C3Pb + C5Pb or C3Pt + C5Pt) ; 114.34 (C3’Pb + C5’Pb) ;
54.63 (OCH3 x2); 54.51 (OCH3). ESI-MS : m/z : 844.4 [M] +
.
[Ru(MPterpy)(MP2bipy)(NO2)](PF6). [Ru(MPterpy)(MP2bpy)(Cl)]Cl (130 mg, 0.15 mmol) was
dissolved in a mixture of ethanol (12 mL) and water (4 mL). NaNO2 (96 mg, 1.40 mmol) was added
and the reaction mixture was heated under reflux during 4h20. The dark brown solution was cooled down to room temperature, and an excess of NH4PF6 (350 mg, 2.1 mmol) dissolved in 1 mL of water
was added. The solution was concentrated to three-quarters of its volume, and the resulting solution was cooled in a fridge for 1h. After filtration and washing with cold water, the resulting dark brown solid was dried under vacuum in a desiccator. The crude compound (138 mg) was purified as following: the solid was dissolved in 135 mL of dichloromethane and the solution was filtrated. Petroleum ether (550 mL) was slowly added to the filtrate under stirring. The resulting mixture was put in a freezer for 3h. Filtrating, washing with cold petroleum ether and drying under vacuum provided 93 mg (62%) of the desired compound, as a brown solid. 1H NMR (CD3CN, 400 MHz) : δ
9.87 (1H, d, H6B, 3 J6/5 = 6.0 Hz); 8.97 (1H, d, H3B, 4 J3/5 = 2.0 Hz); 8.73 (1H, d, H3’B, 4J3’/5’ = 2.0 Hz); 8.71 (2H, s, H3’T + H5’T); 8.50 (2H, m, H3T + H3’’T); 8.23 (1H, dd, H5B, 3 J5/6 = 6.1 Hz, 4 J5/3 = 2.0 Hz); 8.14 (2H, m, H2Pb + H6Pb); 8.10 (2H, m, H2Pt + H6Pt); 7.96 (2H, td, H4T + H4’’T, 3J4/3 = 3 J4/5 = 3 J4’’/3’’ = 3 J4’’/5’’ = 7.9 Hz, 4J4/6 = 4 J4’’/6’’ = 1.6 Hz); 7.88 (2H, m, H6T + H6’’T); 7.77 (2H, m, H2’Pb + H6’Pb); 7.39-7.33 (3H, m, H6’B + H5T + H5’’T); 7.30-7.23 (5H, m, H5’B + H3Pb + H5Pb + H3Pt + H5Pt); 7.06 (2H, m, H3’Pb + H5’Pb); 3.97 (6H, s, OCH3 × 2); 3.85 (3H, s, OCH3). 13 C NMR (CD3CN, 100 MHz) : δ 161.71 (C4Pb or C4’Pb or C4Pt); 161.61 (C4Pb or C4’Pb or C4Pt); 161.60 (C4Pb or C4’Pb or C4Pt); 158.79 (C2T + C2’’T); 157.91 (C2’T + C6’T); 157.23 (C2’B); 156.28 (C2B); 152.70 (C6B); 152.58 (C6T + C6’’T); 150.74 (C6’B); 148.47 (C4’B); 148.11 (C4B); 147.43 (C4’T); 137.63 (C4T + C4’’T); 129.10 (C2Pt + C6Pt); 129.00 (C1Pt); 128.91 (C2Pb + C6Pb or C2’Pb + C6’Pb); 128.86 (C2Pb + C6Pb or C2’Pb + C6’Pb) 128.38 (C1Pb); 127.76 (C1’Pb); 127.35 (C5T + C5’’T); 123.63 (C3T + C3’’T); 123.59 (C5B); 122.73 (C5’B); 120.57 (C3B); 120.11 (C3’B); 120.01 (C3’T + C5’T); 114.93 (C3Pb + C5Pb or C3Pt + C5Pt); 114.86 (C3Pb + C5Pb or C3Pt + C5Pt) ; 114.63
(C3’Pb + C5’Pb) ; 55.35 (OCH3 × 2); 55.24 (OCH3). IR: (cm -1
): 1334 (NO2), 843 (PF6), 826 (PF6), 557
(PF6). ESI-MS : m/z : 855.2 [M] +
.
[RuT1B2](PF6)3. [Ru(MPterpy)(MP2bipy)(NO2)](PF6) (60 mg, 0.060 mmol) was dissolved in a
8 for 1h. The solution was left to room temperature, and an excess of NH4PF6 (350 mg, 2.13 mmol)
dissolved in 3 mL of water was added. The resulting solution was evaporated under vacuum at a temperature maintained below 30°C, until a beginning of precipitation occurred. The mixture was put in a fridge overnight. After filtration and washing with cold water, the resulting dark orange solid was dried under vaccum. (72 mg, 94 %). 1H NMR (CD3CN, 400 MHz) : δ 9.23 (1H, d, H6B,
3 J6/5 = 6.2 Hz); 9.13 (1H, d, H3B, 4 J3/5 = 2.1 Hz); 9.08 (2H, s, H3’T + H5’T); 8.92-8.89 (3H, m, H3’B + H3T + H3’’T); 8.51 (2H, td, H4T + H4’’T, 3J4/3 = 3 J4/5 = 3 J4’’/3’’ = 3J4’’/5’’ = 7.9 Hz, 4J4/6 = 4 J4’’/6’’ = 1.5 Hz); 8.47 (1H, dd, H5B, 3 J5/6 = 6.2 Hz, 4 J5/3 = 2.1 Hz); 8.32 (2H, m, H2Pt + H6Pt); 8.23 (2H, m, H2Pb + H6Pb); 8.17 (1H, dd, H6T + H6’’T, 3J6/5 = 3 J6’’/5’’ = 5.6 Hz, 4J6/4 = 4 J6’’/4’’ = 1.4 Hz); 7.90 (2H, m, H2’Pb + H6’Pb); 7.76 (2H, m, H5T + H5’’T); 7.62 (1H, dd, H5’B, 3J5’/6’ = 6.4 Hz, 4J5’/3’ = 2.1 Hz); 7.36 (2H, m, H3Pt + H5Pt); 7.31 (2H, m, H3Pb + H5Pb); 7.24 (1H, d, H6’B, 3J6’/5’ = 6.4 Hz); 7.13 (2H, m, H3’Pb + H5’Pb); 4.02 (3H, s, OCH3); 4.00 (3H, s, OCH3); 3.89 (3H, s, OCH3). 13 C NMR (CD3CN, 100 MHz) : δ 163.90 (C4Pt); 163.37 (C4’Pb); 163.22 (C4Pb); 158.07 (C4’T); 156.90 (C2T + C2’’T); 154.99 (C4’B); 154.63 (C6T + C6’’T + C2’B); 154.54 (C4B); 153.68 (C2’T + C6’T); 153.61 (C2B); 152.33 (C6B); 147.34 (C6’B); 144.25 (C4T + C4’’T); 130.58 (C2Pt + C6Pt); 130.10 (C5T + C5’’T); 130.00 (C2Pb + C6Pb or C2’Pb + C6’Pb); 129.93 (C2Pb + C6Pb or C2’Pb + C6’Pb); 127.48 (C3T + C3’’T); 126.63 (C1Pt); 126.30 (C1Pb); 126.21 (C5B); 125.76 (C1’Pb); 125.25 (C5’B); 123.53 (C3’T + C5’T); 123.28 (C3B); 122.42 (C3’B); 115.54 (C3Pt + C5Pt); 115.28 (C3Pb + C5Pb); 115.14 (C3’Pb +
C5’Pb); 55.73 (OCH3); 55.58 (OCH3); 55.52 (OCH3). IR: (cm -1
): 1933 (NO), 829 (PF6), 556 (PF6).
ESI-MS : m/z: 855.2 [RuII(MPterpy)(MP2bipy)(NO2)] +
; 425.1 [RuII(MPterpy)(MP2bipy)(CH3CN)] 2+
; 419.6 [RuII(MPterpy)(MP2bipy)(NO•)]
2+
; 413.6 [RuII(MPterpy)(MP2bipy)(H2O)] 2+
; 404.6
[RuII(MPterpy)(MP2bpy)] 2+
; 283.4 [RuIII(MPterpy)(MP2bpy)(CH3CN)]
3+
; 269.4
[RuIII(MPterpy)(MP2bpy)] 3+
. UV-Vis (CH3CN): λmax (ε): 227 (52000 L.mol -1
.cm-1), 275 (sh), 291 (51000 L.mol-1.cm-1), 315 (sh), 365 (39000 L.mol-1.cm-1), 440 (sh). Anal. Calcd for C46H37F18N6O4P3Ru: C, 43.37; H, 2.93; N, 6.6. Found: C, 43.25; H, 2.69; N, 6.47. [Ru(terpy)(MP2bipy)(CH3CN)](PF6)2. 1H NMR (CD3CN, 400 MHz) : δ 9.55 (1H, d, H6B, 3J6/5 = 6.0 Hz); 8.97 (1H, d, H3B, 4 J3/5 = 2.0 Hz); 8.70 (1H, d, H3’B, 4J3’/5’ = 2.1 Hz); 8.58 (2H, d, H3’T + H5’T, 3J3’/4’ = 3 J5’/4’ = 8.1 Hz); 8.44 (2H, m, H3T + H3’’T); 8.32 (1H, t, H4’T, 3J4’/3’ = 3J4’/5’ = 8.1 Hz); 8.19 (1H, dd, H5B, 3 J5/6 = 6.0 Hz, 4 J5/3 = 2.0 Hz); 8.13 (2H, m, H2Pbpy + H6Pbpy); 8.01 (2H, td, H4T + H4’’T, 3J4/3 = 3 J4/5 = 3 J4’’/3’’ = 3
J
4’’/5’’= 7.9 Hz,
4J
4/6=
4J
4’’/6’’= 1.5 Hz); 7.81 (2H, d, H
6T+ H
6’’T,
3J
6/5=
3J
6’’/5’’= 5.5
Hz); 7.75 (2H, m, H
2’Pbpy+ H
6’Pbpy); 7.38 (2H, m, H
5T+ H
5’’T); 7.30-7.21 (4H, m, H
6’B+ H
5’B+ H
3Pbpy+ H
5Pbpy); 7.05 (2H, m, H
3’Pbpy+ H
5’Pbpy); 3.95 (3H, s, OCH
3); 3.83 (3H, s, OCH
3).
[Ru(MPterpy)(MP2bipy)(CH3CN)](PF6)2.
1
H NMR (CD
3CN, 400 MHz) : δ 9.60 (1H, d, H
6B, 3J
6/5= 6.0 Hz); 9.00 (1H, m, H
3B,
4J
3/5= 2.1 Hz); 8.83 (2H, s, H
3’T+ H
5’T); 8.74 (1H, m, H
3’B); 8.61
9
+ H
2Pb+ H
6Pb); 8.07 (2H, td, H
4T+ H
4’’T,
3J
4/3=
3J
4/5=
3J
4’’/3’’=
3J
4’’/5’’= 7.9 Hz,
4J
4/6=
4J
4’’/6’’= 1.5 Hz); 7.85 (2H, d, H
6T+ H
6’’T,
3J
6/5=
3J
6’’/5’’= 5.5 Hz); 7.78 (2H, m, H
2’Pb+ H
6’Pb); 7.40
(2H, m, H
6’B+ H
5’B); 7.34-7.27 (6H, m, H
5T+ H
5’’T+ H
3Pt+ H
5Pt+ H
3Pb+ H
5Pb); 7.08 (2H, m,
H
3’Pb+ H
5’Pb); 3.99 (3H, s, OCH
3); 3.98 (3H, s, OCH
3); 3.86 (3H, s, OCH
3).
Computational details
The four ruthenium-nitrosyl complexes were fully optimized using the Gaussian-09 program package24 within the framework of the Density Functional Theory (DFT). In any case, the calculations were performed in the presence of acetonitrile, which was modelized by the Polarizable Continuum Model (SCRF=PCM method).25 The double- basis set 6-31G* was used for all atoms except the heavy ruthenium atom, for which the LANL2DZ basis set was applied to account for relativistic effects.26 We have selected the hybrid functional B3PW91 for the optimization, for a better coherency with previous investigations. Indeed, B3PW91 has been shown to outperform other hybrid functionals (e.g. B3LYP) and pure functionals (e.g. PW91) in numerous cases of ruthenium complexes,27 especially when back bonding ligands (like NO) are present.28 In our previous investigation of [RuT1B0]3+,18c several functionals were tested for the calculations of the UV-visible spectra (B3PW91, B3LYP, PBE0, and CAM-B3LYP) by time-dependent (TD)-DFT. CAM-B3LY29 was finally selected, for its better accuracy to reproduce the experimental transition energies (< 0.5 eV in any case). Using the same conditions was found satisfactory here as well. The computed geometries of FT, cis- and trans-[RuII(FT)Cl2(NO)]
+
are provided as Supplementary Information with the details of the related UV-visible computed spectra.
Photochemical investigations
Photochemistry: Kinetic studies on the photolysis reactions were carried out with a diode array
Hewlett Packart 8452A spectrophotometer. Solutions of 2 mL of [RuT0B2](PF6)3 (2.33 10 -5
mol L-1 for irradiation at 365 nm) and [RuT1B2](PF6)3 (3.75 10
-5
mol L-1 for irradiation at 436 nm) in non-deoxygenated acetonitrile were used. The optical fiber was fixed laterally from the cuvette. Absorption spectra were taken after each 3 minutes, in fast scan mode, during a period of 21 hours, which allows reaching apparent stable absorption conditions. The UV-vis spectra were recorded under irradiation realized with a Muller reactor device equipped with a cooling water filter and a mercury arc lamp equipped with appropriate interference filter to isolate the desired irradiation wavelength (max = 365
10
Quantum yield measurements: Light intensities were determined before each photolysis
experiments by chemical actinometry procedure. The actinometers used were potassium ferrioxalate at
irr = 436 nm (I0 = 2.59 10 -7
mol L-1 s-1), and at irr = 365 nm (I0 = 5.30 10 -6
mol L-1 s-1). The quantum yield () was determined by the program Sa3.3 written by D. Lavabre and V. Pimienta.30 It allows the resolution of the following differential equation:
d[A]
dt = −Φ𝐴 Ia
A = −Φ
𝐴 AbsAλI0F (2)
where IaA is the intensity of the light absorbed by the precursor, AbsAλ the absorbance before irradiation, AbsTotλ the total absorbance, I
0 the incident intensity measured at 436 nm, and F the
photo-kinetic factor given defined as:
F =(1−10−AbsTot
λ )
AbsTotλ (3)
The equation (2) was fitted with the experimental data AbsTotλ = 𝑓(𝑡) and 2 parameters
and ( is the molar extinction coefficient measured at the end of the reaction) at two wavelengths (irr=436
nm, obs = 470 nm for [RuT1B2](PF6)3 ; irr = 365 nm, obs = 420 nm for [RuT0B0](PF6)3) and irr =
365 nm, obs = 470 nm for [RuT0B2](PF6)3).obs was chosen because it corresponds to a large
difference between molar extinction coefficient at the initial and final time of the photochemical reaction. Simulation and optimization procedures were performed by using numerical integration and a non-linear minimization algorithm for the fitting of the model to the experimental data.30,31 It has to be pointed out that NO was previously published elsewhere for [RuT1B0](PF6)3.
18c
Nevertheless, we have found that this previous value was overestimated due to a wrong evaluation of I0. Contrary to the
previous study, the pH of the solution was carefully lowered by addition of sulfuric acid in the actinometry procedure in the present case, thus leading to a better evaluation of I0 and a concomitant
reduction of NO. The experimental data reported here are all based on this new procedure.
Data for [RuT0B0](PF6)3
[A]0= 8.66 10−5mol L−1, ε𝐴365= 7500 mol−1 L cm−1 , ε𝐴420= 577 mol−1 L cm−1 ,
ε𝐵365= 2246 mol−1 L cm−1 , ε 𝐵
420= 6813 mol−1 L cm−1
Data for [RuT0B2](PF6)3
[A]0= 2.33 10−5mol L−1, ε
𝐴365= 31759 mol−1 L cm−1 , ε𝐴470= 3527 mol−1 L cm−1 ,
ε𝐵365= 14116 mol−1 L cm−1 , ε 𝐵
470= 18058 mol−1 L cm−1
Data for [RuT1B2](PF6)3
11 ε𝐵436= 15131 mol−1 L cm−1 , ε
𝐵
470= 20126 mol−1 L cm−1
Electrochemical studies
Electrochemical experiments were performed with a potentiostat Autolab PGSTAT100 (EcoChemie, The Netherlands) controlled by GPES 4.09 software. Experiments were carried out at room temperature in a homemade airtight three-electrode cell connected to a vacuum/argon line. The reference electrode was a saturated calomel electrode (SCE) separated from the solution by a bridge compartment. The counter electrode was a platinum wire of ca. 1 cm2 apparent surface. The working electrode was a Pt microdisk (radius = 0.25 mm). The supporting electrolyte (nBu4N)(PF6) (Fluka, 99% electrochemical grade) was used as received and simply degassed under argon. Acetonitrile was freshly purified prior to use. The solutions used during the electrochemical studies were 10-3 mol L-1 and 10-1 mol L-1 respectively for the ruthenium complexes and for the supporting electrolyte. Before each measurement, the solutions were degassed by bubbling argon through them, and the working electrode was polished with a polishing machine (Presi P230). Typical instrumental parameters for recorded square wave voltammograms were: SW frequency f = 20 Hz, SW amplitude Esw = 20 mV, and scan increment dE = 5 mV. The irradiations performed prior recording the voltammograms of the photoproducts were performed with a mercury lamp. The voltammograms for the new [RuT0B2](PF6)3 and [RuT1B2](PF6)3 compounds and the complete redox potentials tables along the
[RuT0B0](PF6)3, [RuT1B0](PF6)3, [RuT0B2](PF6)3, [RuT1B2](PF6)3 series are provided as
supplementary information.
Results and discussion
Synthesis and characterization
The synthesis of [RuT0B2](PF6)3 and [RuT1B2](PF6)3 reported here follows the general route
previously reported for [RuT1B0](PF6)3 which implies the introduction of the ruthenium atom as
RuIIICl3 followed by that of the nitrosyl ligand through a first reaction of a nitrite (NO2
-) switched to NO+ in acidic medium.18c This synthetic procedure avoids the production of a large amount of undesirable homoleptic [RuII(terpy)2]
2+
, species which was observed when Ru(NO) is introduced with the [RuIICl5(NO)]
reagent.32
Contrary to the synthesis of related complexes built up from unsubstituted bipyridines,18 the first step of the present synthesis (Scheme 2), requires the use of the rather insoluble MP2bipy, which led to
12 unexpected difficulties. Eventually, the reactions were successfully achieved in ethylene glycol, following a procedure previously used in our group in the case of ruthenium nitrosyl complexes with insoluble ligands.33 The use of an excess of triethylamine (TEA) is justified at this step to facilitate the reduction of RuIII to RuII according to a mechanism previously suggested,34,35 which implies an electron transfer from TEA to the hexacoordinated ruthenium center without direct binding. Additionally, we have observed in most cases that a [RuIII(terpy)(bipy)X] complex undergoes a spontaneous RuIII → RuII reduction, even in the absence of clear reducing agent (vide infra). In the case of [RuT1B2](PF6)3, the substitution of NO2
for Cl- required a purification step as previously reported by Snow et al.22 The reaction steps 2 and 3 in Scheme 2 are easily monitored by 1H-NMR spectroscopy, from the observation of the shift of one proton located in position 6 on the bipyridine, spatially close to the monodentate ligands (Cl, NO2 or NO), and therefore submitted to its deshielding
influence. Thereby, switching from -Cl to -NO2 substituent and subsequently to -NO leads to the
peak-shifting of the proton in position 6 from 10.18 ppm (in CD3CN) to 9.82 ppm (in CD3CN) and finally to
9.23 ppm (in CD3CN) in the case of [RuT0B2](PF6)3 and from 10.20 ppm (in CD3OD) to 9.87 ppm (in
CD3CN) and finally to 9.23 ppm (in CD3CN) in the case of [RuT1B2](PF6)3.
Applying two-dimensional NMR-techniques HMBC, HMQC and COSY allows the complete assignment of the peaks observed in 1H- and 13C- NMR spectra for the six diamagnetic Ru(Cl), Ru(NO2), and Ru(NO)-based species. The stretching vibrations (NO) are observed at 1933 cm
-1
and 1937 cm-1 for [RuT1B2](PF6)3, and [RuT0B2](PF6)3, respectively. These values fall close to those of
1940 cm-1 and 1944 cm-1 previously recorded in [RuT1B0](PF6)3, 18c
and [RuT0B0](PF6)3. 33
Nevertheless, a tendency for decreasing frequencies is apparent when the number of methoxyphenyl donating substituent increases. This observation is in complete agreement with the idea that increasing the donating capabilities of the complexes gradually increases the charge transfer towards the antibonding * level of the withdrawing nitrosyl, reduces its bond order and eventually its stretching frequency.
Optical properties
The UV-visible spectra recorded in acetonitrile are compared in Figure 1 for the four compounds under investigations. At first glance, a rough tendency for higher intensity is observed as the size of the -skeleton of the ligands increases, from [RuT0B0](PF6)3 to [RuT1B2](PF6)3. More precisely, and
apart from high energy transitions in the 250-300 nm range having likely →* intra-ligand character, two main features are observed at about 375 nm and at about 425 nm. The transition at 375 nm is present in the four complexes, with a tendency for higher intensity in the species containing the MP2bipy ligand. The transition at 425 nm of weaker intensity is present on species containing the
13 MPterpy ligand, only. Interestingly, the UV-visible spectrum of [RuT1B2](PF6)3 seems to result
grossly from the sum of that of [RuT1B0](PF6)3, and that of [RuT0B2](PF6)3. This observation
suggests that, to a large extent, the origin of the electronic transition at 425 nm is roughly the same for both [RuT1B2](PF6)3, and [RuT0B2](PF6)3. This idea is farther developed by a DFT analysis.
Figure 1 Comparison of the UV-visible spectra of the ruthenium complexes, in acetonitrile.
DFT analyses
Before discussing the computed optical properties, it is interesting to comment the evolution of few relevant data from the ground state optimizations in order to evaluate the charge transfer features along the [Ru(NO)] series. They are gathered in Table 1.
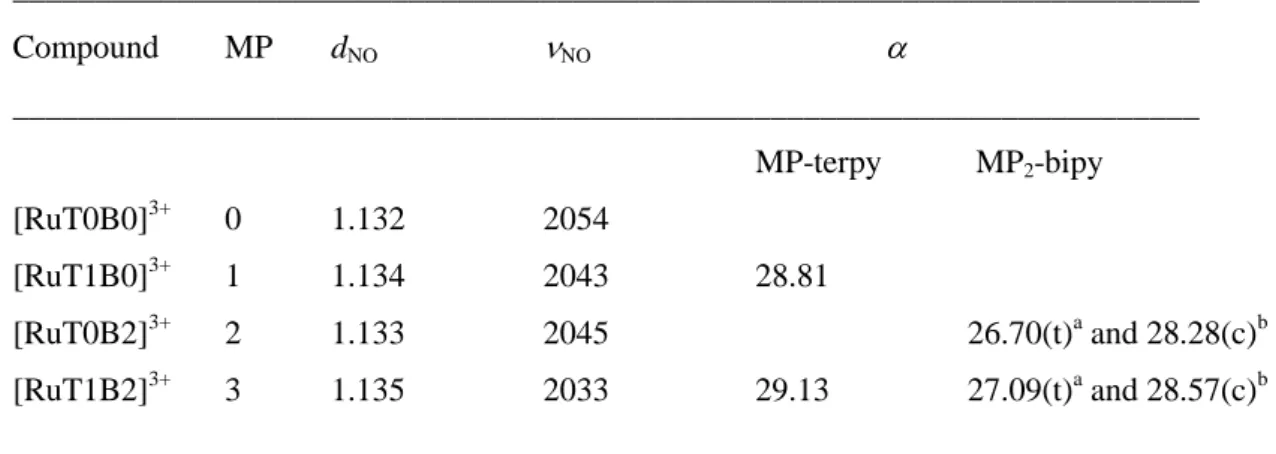
Table 1 Relevant data in the DFT-computed ruthenium nitrosyl complexes in the ground state: NO bond length (dNO in Å), NO stretching frequency (NO in cm
-1
), and torsion angle between the methoxyphenyl and the related pyridine rings ( in °).
________________________________________________________________________ Compound MP dNO NO ________________________________________________________________________ MP-terpy MP2-bipy [RuT0B0]3+ 0 1.132 2054 [RuT1B0]3+ 1 1.134 2043 28.81 [RuT0B2]3+ 2 1.133 2045 26.70(t)a and 28.28(c)b [RuT1B2]3+ 3 1.135 2033 29.13 27.09(t)a and 28.57(c)b ________________________________________________________________________ a
methoxyphenyl on the pyridine in trans position with respect to the Ru(NO).
b
14 As previously discussed, the charge transfer effects on NO (increasing dNO, and decreasing NO values)
are more pronounced when the number of MP donor units increases. Nevertheless, the opposite is observed on the donating counterparts. Indeed, the MP to pyridine charge transfer is reduced (increasing torsion angle) when the number of donors increases from 0 to 3. This evolution is readily understood from the fact that the withdrawing capability of a single NO is distributed on several donors, thus leading to a reduction of the effect on each individual donor. Additionally, the data gathered in Table 2 suggest that the effect of one substitution achieved on the terpyridine ligand is as efficient as that of two substitutions achieved on the bipyridine. A similar behavior has previously been observed in our group on a fluorenyl-based Ru(NO) complex.33
The TD-DFT computed spectra are compared in Figure 2, for the four [RuT0B0]3+, [RuT1B0]3+, [RuT0B2]3+, and [RuT1B2]3+ complexes. Although some discrepancies are apparent in the general course between the theoretical and experimental spectra, it is possible to point out few computational features supporting the experimental data: (i) the tendency for higher overall intensity as the size of the
-skeleton of the ligands increases is evidenced in full agreement with the experiment; (ii) the presence of a sizeable low-lying transition at > 400 nm, is observed in the only complexes in which a donor is present on the terpyridine (MPterpy); and (iii) the spectrum of [RuT1B2]3+ seems to result from the sum of those of [RuT1B0]3+ and [RuT0B2]3+, in the low-lying 375 - 425 nm wavelength domain. More precisely, the transitions at 413 nm and 382 nm computed in [RuT1B2]3+ seem to correspond to those computed at 417 nm and 394 nm in [RuT1B0]3+ and [RuT0B2]3+, respectively. The detailed analysis of these transitions is provided in Table 2, to check out this hypothesis.
The data gathered in Table 2 lead to the suggestion that the two dominant transitions of [RuT1B2]3+ (1 → 5 and 1 → 7) are reminiscent of those of [RuT1B0]3+
(1 → 3) and [RuT0B2]3+ (1 → 5), respectively. Indeed, they are found to possess roughly the same energies, relative intensities and charge transfer properties. The comparison of these transitions is farther depicted at the molecular level in Figure 3. It allows concluding unambiguously that the two transitions present in [RuT1B2]3+ are those of the parent [RuT1B0]3+ and [RuT0B2]3+ species without any significant mixing. This absence of mixing can be tentatively related to the symmetries of the orbitals involved in the transitions.
15
Figure 2 Comparison of the UV-visible spectra computed at the CAM-B3LYP/6-31G* level for the ruthenium nitrosyl complexes.
16
Table 2 Details for the low energy transitions involved in the TD-DFT computed spectra of the ruthenium-nitrosyl complexes: absorption maxima (max), oscillator strengths (f), composition of the configuration interactions (CI), and characters.
________________________________________________________________________________________________________________
Compound Transition max (nm) f CI expansion
a
main character
________________________________________________________________________________________________________________
[RuT0B0]3+ 1 → 7 345 0.058 59% 116→117 + 14% 112→117 terpy → Ru(NO)
1 → 10 324 0.042 88% 115→118 bipy → Ru(NO)
[RuT1B0]3+ 1 → 3 417 0.227 76% 144→145 MP(terpy) → Ru(NO)
[RuT0B2]3+ 1 → 3 434 0.029 33% 172→174 + 32% 166→174 MP(bipy) + bipy → Ru(NO)
1 → 5 393 0.276 47% 171→174 + 31% 172→174 MP(bipy) → Ru(NO)
[RuT1B2]3+ 1 → 5 413 0.269 65% 198→201 MP(terpy) → Ru(NO)
1 → 7 382 0.359 37% 199→202 + 36% 200→202 MP(bipy) → Ru(NO)
________________________________________________________________________________________________________________
a
17
Figure 3 Main orbitals involved in the dominant low-energy transitions of [RuT1B0]3+, [RuT0B2]3+, and [RuT1B2]3+.
Within the assumption of an ideal octahedral RuN6 coordination sphere, schematized in Scheme 3, the
terpyridine ligand appears to lie in the XZ plane and the bipyridine ligand to lie in the XY plane. In [RuT1B0]3+, the dominant 1 → 3 transition possesses a Y (terpy) to dXYX
*
character, while the dominant 1 → 5 transition of [RuT0B2]3+ possesses a Z (bipy) to dYZZ
*
character. Both charge transfer phenomena being strictly orthogonal, it is therefore not surprising that they found their counterpart in the [RuT1B2]3+, without any mixing.
Scheme 3 Partial coordination sphere in the XY plane for a [Ru(terpy)(bipy)(NO)]3+ species in the case of an ideal RuN6 octahedral symmetry.
18
NO· photo-release from [RuT1B0](PF6)3, [RuT0B2](PF6)3 and [RuT1B2](PF6)3
Numerous ruthenium nitrosyl complexes have been observed to release NO· under irradiation, with very different quantum yields, depending on the nature of the ligands. For example, in the case of [Ru(bipy)2L(NO)]
2-3+
complexes, Da Silva et al. reported NO value of 0.98 when L = Cl
-.12(d) This value drops to 0.17 with L = 4-picoline and furthermore to 0.07 with L ) 4-acetylpyridine.12(c) In [Ru(terpy)L(NO)]3+ complexes, NO = 0.14 when L = bipy, but rises to 0.46 when L is an
orthophenylenediamine.17 The authors relate these evolutions to the withdrawing character of the L ligand, which hampered an efficient Ru → NO charge transfer, assuming that this charge transfer is the dominant parameter to account for the NO· release.
Clearly ruthenium-nitrosyl complexes with polypyridyl ligands possess a very broad range of possible
NO values. However, the mechanism responsible for the release process was never unambiguously
established. According to theoretical analyses by Mascharak, the release is ascribed in any case to the population of an excited state having strong dRu-NO* antibonding character.
3a, 36
Interestingly, the associated transitions tend towards the overall process depicted in equation (1), which leads to: (i) electron transfer to NO+ which is switched to NO·, (ii) weakening of the Ru-NO bond and finally, (iii) NO· release supporting a mechanism in one step. Apart from this simple picture, different dissociation mechanisms have been suggested with a first excitation towards an additional ligand, however still followed by conversion to the antibonding dRu-NO* excited state.
36-38
Recently, molecular dynamics beyond the Born-Oppenheimer approximation has been used to point out the possibility for intersystem crossing towards a triplet state susceptible to undergoes additional excitation towards higher triplet states or isomerization to a metastable bent conformation prior to the NO· releasing.9,39 The use of multiconfigurational wave functions has also been proposed to provide a better description of the bonding properties of Ru(NO) metal complexes.40 These proposed mechanisms should further be tested by experimental data to support the computational suggestions, although it is difficult to compare experiments conducted on different species at different wavelength irradiations, owing to the number of potential parameters to be taken into account.
A recent investigation in our group has come to the conclusion that the quantum yield of photo-release (NO) is hardly correlated with the donating capabilities of the ligands, along a series of substituted
[Ru(R-terpy)Cl2(NO)] +
complexes.41 However, the irradiations were performed at a constant wavelength on these complexes in which the absorption maxima, the nature and the number of the involved transitions were variable, thus hampering reliable conclusions to be established. By contrast, we present here an evaluation of NO at = 436 nm in [RuT1B0](PF6)3 and [RuT1B2](PF6)3, which
19 suitable for this investigation. First, the deconvolution of the UV-visible spectra in the low energy domain (Figure 4), is examined to verify the effect of the irradiation on the different species. The wavelengths of the de-convoluted transitions are compared to the TD-DFT data in Table 3, to verify the reliability of the analysis. In the case of [RuT1B0](PF6)3, the transition at 425 nm, is the only one
active under irradiation at 436 nm. By contrast, the deconvolution reveals the presence of three transitions (= 340 nm, 369 nm, and 421 nm) in closer proximity in [RuT1B2](PF6)3, so the resulting
shape shows a shoulder at the irradiation wavelength. Nevertheless, it appears that about 90 % of the light provided at 436 nm is used to promote the transition at 421 nm (Figure 4, bottom). It can therefore be concluded that, to a large extent, the behaviors of [RuT1B2](PF6)3 and [RuT1B0](PF6)3
should be identical under this irradiation. By contrast, the deconvolution clearly reveals that the irradiation has to be conducted around = 350 nm in [RuT0B2](PF6)3, on the only intense transition
observed at low-energy. More precisely, = 365 nm was selected as corresponding to the most suitable wavelength in our set of filters available.
Figure 4 UV-visible spectra of [RuT1B0](PF6)3, [RuT0B2](PF6)3, and [RuT1B2](PF6)3 (black
solid line) with deconvolutions: the red dashed lines are the sum of the contribution of dotted lines (see text).
20 The change in the electronic absorption spectrum of [RuT1B2](PF6)3 in acetonitrile, under irradiation
at = 436 nm, is shown in Figure 5. It reveals the presence of isosbestic points at = 222, 266, 348 and 442 nm, which indicate a clean conversion of the RuII(NO+) complexes to the related photolysed species. No back-reaction is observed when the light is turned off. In the resulting photo-product, new bands arise at 282, 312, and 476 nm. Similar experiments were conducted on [RuT1B0](PF6)3 at 436
nm and on [RuT0B2](PF6)3 at 365 nm (see Supplementary Information). Moreover, the three
photoproducts exhibit rather similar UV-visible spectroscopic features with a transition in the 450-500 nm domain and a multi-transitions band located between 250 and 350 nm.
Table 3 Comparison of the de-convoluted (left) and computed (right) transitions showing the matching between the UV-visible spectrum of [RuT1B2](PF6)3 and those of the
parents [RuT1B0](PF6)3 (blue) and [RuT0B2](PF6)3 (red) compounds.
______________________________________________________________
Experimental data TD-DFT computation
Compound deconvoluted Compound transition
transition
______________________________________________________________
[RuT1B0](PF6)3 425 nm [RuT1B0]3+ 417 nm
369 nm 355 nm
[RuT0B2](PF6)3 458 nm (weak) [RuT0B2]
3+ 434 nm (weak) 356 nm 393 nm [RuT1B2](PF6)3 421 nm [RuT1B2] 3+ 413 nm 369 nm 382 nm 340 nm 349 nm ______________________________________________________________
It is worth pointing out that the shape of the UV-visible spectra of the photoproducts (red curve in Figure 5 and Figure S7 in Supplementary Information) does not exhibit the large and broad band centered at 600 nm characteristic of RuIII, which is predicted by equation (1). This might suggest that NO is released as NO+ rather than NO·. However, this hypothesis has to be abandoned after the examination of the EPR spectra recorded under irradiation in the presence of a [FeII(MGD)2] which
behaves as a powerful spin trapping reagent and leads to the observation of a stable spin adduct exhibiting the characteristic triplet signal of NO· (Figure 6). These behaviors are exemplified here for [RuT0B2](PF6)3, in Figure 6, with a hyperfine splitting constant value of aN = 1.21 10
-3
cm-1 and a g-factor equal to 2.040, values which are fully consistent with reports found in the literature for
21 [FeII(MGD)2-NO] adducts.
23
Note that the residual signal observed without irradiation (upper part of Figure 6) is related to the fact that experiments are never strictly conducted in the dark.
Figure 5 Changes in the absorption spectrum of [RuT1B2](PF6)3, in acetonitrile, under
irradiation at = 436 nm. The blue curve corresponds to the starting complex and the red curve corresponds to the photo-product.
Figure 6 Representative triplet signal from NO· trapped by [FeII(MGD)2] in acetonitrile, after
irradiation of [RuT0B2](PF6)3, with a Hg lamp (bottom). The signal recorded before
22 Eventually, the observation of a ruthenium (II) complex as the stable final photoproduct is not so surprising. Indeed, we have observed that, after NO· release, the expected [RuIII(solvent)]3+ complex is invariably reduced to a RuII, in the case of complexes in which 5 pyridines are present in the coordination sphere, so [RuII(solvent)] is the only observable species arising after the NO· release.18 A previous investigation has pointed out the unexpected appearance of nitrates in the crystal structure of the RuII photoproduct of RuNO complexes containing 5 pyridines. This leads to the suggestion of NO· as the potential reducing agent in the fast reduction process.18c Indeed, one third of the released NO· available could be used to reduce the photoproducts, as described below:
RuIII +1𝑒→ RuII (4) 1/3 NO· −1𝑒→ 1/3 NO3
(5)
No other investigations were carried out to elucidate the nature of the reducing agent accounting for the fast reduction process.
The presence of RuII instead of RuIII after irradiation is further confirmed by electrochemistry, with the appearance of an oxidation wave after irradiation along the RuNO series, the values of which are gathered in Table 4. Interestingly, the oxidation becomes more favorable (shifted to lower potentials), as the number of donating substituents increases, in agreement with the chemical intuition. A similar effect is evidenced before irradiation with the NO+ → NO· wave shifted to lower potential indicating that it becomes more difficult to reduce the species having more donating substituents. Altogether the spectroscopic and electrochemical data lead to the conclusion that, although the nature of the reducing agent is not clearly established, Equation (1) has to be re-written as follows:
[𝑅𝑢𝐼𝐼(𝑁𝑂+)] + 𝑠𝑜𝑙𝑣𝑒𝑛𝑡 ℎ𝜈→ [𝑅𝑢𝐼𝐼𝐼(𝑠𝑜𝑙𝑣𝑒𝑛𝑡)] + 𝑁𝑂· 𝑓𝑎𝑠𝑡→ [𝑅𝑢𝐼𝐼(𝑠𝑜𝑙𝑣𝑒𝑛𝑡)] + 𝑁𝑂· (6)
Finally, the NO values obtained by treatment of the time dependence of the absorbance of the intense
low-energy transitions of [RuT1B0](PF6)3, [RuT0B2](PF6)3, and [RuT1B2](PF6)3 are shown in Table
5. Surprisingly, and while the transitions arise from the same general MP → RuNO charge transfer behavior in any case, their associated NO values scale from 0.002 to 0.024, in a ratio of 1 to 12. More
precisely, the experiments conducted in the same irradiation conditions ( = 436 nm) on [RuT1B2](PF6)3 and [RuT1B0](PF6)3 lead to NO values of 0.002 and 0.011, respectively, in a ratio 1
to 6 contrary to the expectation of unvarying properties arising from identical (MP-terpy → RuNO) charge transfer transitions. This striking difference forces us to recognize that the simple one step (transition → release) mechanism cannot account for the observation of so different properties. It has therefore to be inferred that the singlet excited state promoted after one-photon absorption cannot release NO· spontaneously.
23
Table 4 Selected redox potential (vs SCE electrode) observed in the square-wave voltammograms of [RuT0B0](PF6)3, [RuT1B0](PF6)3, [RuT0B2](PF6)3, and
[RuT1B2](PF6)3.
____________________________________________________
Compound before irradiation after irradiation
NO+/NO· RuIII/RuII
____________________________________________________ [RuT0B0](PF6)3 0.47 1.29 [RuT1B0](PF6)3 0.44 a 1.27a [RuT0B2](PF6)3 0.42 1.23 [RuT1B2](PF6)3 0.39 1.20 ____________________________________________________ a
data from ref. 12c.
Alary et al. have recently proposed that, in [RuII(terpy)Cl2(NO] +
complexes, the Ru-NO bond cannot be broken in the singlet excited state, but is rather switched to a triplet state by intersystem crossing reaction.9 Furthermore, this triplet could be subjected to an evolution towards a bent Ru-N-O intermediate, so called MS2 state, subjected to additional photon absorption and finally, to the release of nitric oxide. A two-photon mechanism was recently evidenced in the RuNO/RuON photo-isomerization of [Ru(py)4Cl(NO)](PF6)2, a reaction which frequently competes with the photorelease
and implies first the breaking of the Ruthenium-nitrosyl bond.42 Owing to this observation, the issue of a possible sequential two-photon mechanism along the present RuNO series cannot be avoided.
Table 5 Quantum yield of NO· photo release (NO) after irradiation (irr) on the intense
low-energy transition (max) of [RuT0B0](PF6)3, [RuT1B0](PF6)3, [RuT0B2](PF6)3, and
[RuT1B2](PF6)3.
____________________________________________________
compound max (nm) irr (nm) NO
____________________________________________________ [RuT0B0](PF6)3 352 365 0.086 [RuT1B0](PF6)3 425 436 0.011 [RuT0B2](PF6)3 356 365 0.024 [RuT1B2](PF6)3 421 436 0.002 ____________________________________________________
24 To the best of our knowledge, the requirement for a second photon and the need of a triplet state mechanism were never proven experimentally, in the release process. In the present case, the requirement for an intermediate (e.g. MS2) species is not verified experimentally, due to the presence of isosbestic points in Figure 5 which favors a simple two-species (A→ B) mechanism. If it is involved here, MS2 must necessarily be extremely photo-reactive, so its concentration stays very weak all over the release process. Although this possibility cannot be strictly dismissed, we clearly have no experimental data in hands suggesting that this two-photon mechanism takes place in our compounds.
As a final comment, it is worth pointing out that the photoproduct generated under irradiation of [RuT1B2](PF6)3 undergoes a significant absorption at 436 nm (Figure 5). As a consequence the
completion of the photo-release process required a long irradiation time of about 40 hours. Under these conditions, the issue of possible additional photoreactions of the photoproduced with dissociation of the chelating ligands could have been considered. Indeed, release of bidentate -acceptors ligands, such as bipyridine, has been observed under irradiations in some cases.43-46 Nevertheless, a set of experimental features allow us to exclude this possibility as a significant behavior: (i) isosbestic point in the UV-vis spectra revealing the presence of a single photoproduct; (ii) photochemical analysis applied satisfactory on the basis of a single photoproduct, (iii) lack of NO in the photoproduct confirmed by EPR and IR spectroscopy (, and (iv) finally presence of a single photoproduct monitored by 1H NMR spectroscopy.
Conclusion
The report of the new [RuT0B2](PF6)3, and ([RuT1B2](PF6)3 compounds allowed us to obtain a series
of four ruthenium nitrosyl complexes built up from the [Ru(terpy)(bipy)(NO)]3+ core with 0, 1, 2, and 3 methoxyphenyl donating units. A computational DFT analysis conducted in support of the experimental data leads to a comprehensive report of the role devoted to the charge transfer effects in both ground and excited states with low-energy transitions arising from a methoxyphenyl to ruthenium nitrosyl charge transfer, in any case. Despite these similarities, irradiations performed on these transitions lead to NO· photorelease with significantly different quantum yields, in the broad 0.002 – 0.02 range. More precisely, and due to orbital orthogonality, the low energy transitions are found identical in [RuT1B0](PF6)3 and [RuT1B2](PF6)3, nevertheless, with different quantum yield in a ratio
of 1 to 6. This unexpected result proves that the intuitive mechanism based on a simple “absorption + release” scheme is inoperative to account for the experimental data. More sophisticated models are required either by introducing very reacting intermediates or intersystem conversions to hypothetical
25 triplet states, as suggested by theorist. Additional experimental data are necessary to clarify if more than one photon is required to release NO· in these species.
Supplementary information: 1H NMR for the 6 Ru-X ruthenium complexes (X = Cl, NO2, NO) with
atom labeling, computational detail (optimized structures and UV-visible spectra), electrochemical and photorelease data for [RuT1B0](PF6)3 and [RuT0B2](PF6)3. 1H-NMR-tracking of NO· release from
[RuT1B2](PF6)3. IR spectrum for [RuT1B2](PF6)3 and its photoproduct.
Acknowledgements
The authors wish to thank Dr Alix Sounia-Saquet (LCC – CNRS) for performing the electrochemical experiments, Lionel Rechignat (LCC-CNRS) for his assistance in EPR experiment, and Dr Isabelle Sasaki (ISM-Bordeaux) for helpful discussions. M.R. thanks the Ministère de l’Enseignement Supérieur et de la Recherche (MESR) for a PhD fellowship.
References
1 L. J. Ignarro, Nitric oxide biology and pathobiology, Academic Press, San Diego, 1st edn, 2000.
2 S. Singh and A. K. Gupta, Cancer Chemother. Pharmacol. 2011, 67, 1211-1224.
3 (a) N. L. Fry and P. K. Mascharak, Acc. Chem. Res. 2011, 44, 289-298; (b) M.J. Rose and P.K. Mascharak, Coord. Chem. Rev. 2008, 252, 2093-2114.
4 for recent reports on NO· release from ruthenium nitrosyl complexes, see:
(a) M. Guo, H.J. Xiang, Y. Wang, Q.L. Zhang, L. An, S.P. Yang, Y. Ma, Y. Wang, J.G. Liu and Jin-Gang, Chem. Commun. 2017, 53, 3253-3256; (b) G.L.S. Rodrigues and W.R. Rocha, J. Phys. Chem. B 2016, 120, 11821-11833; (c) N. Cacita, B. Possato, C.F.N. da Silva, C.M. Paulo, A.L.B. Formiga, L.M. Bendhack and S. Nikolaou, Inorg. Chim. Acta 2015, 429, 114-121; (d) J.C.M. Pereira, M.L. Souza and D.W. Franco, Eur. J. Inorg. Chem. 2015, 2015, 1005-1011; (e) K. Ghosh, R. Kumar, K. Kumar, A. Ratnam and U.P. Singh, RSC Adv. 2014, 4, 43599-43605; (f) M.S.P. Marchesi, S.A. Cicillini, A.C.L. Prazias, L.M. Bendhack, A.A. Batista and R.S. Silva, Trans. Met. Chem. 2012, 37, 475-479.
26 6 R.D. Feltham and J.H. Enemark, Topics in Stereochemistry; Geoffroy, G., Ed.; J. Wiley
& Sons: New York, 1981; Vol. 12, p155.
7 G.K. Lahiri and W. Kaim, Dalton Trans. 2010, 39, 4471-4478.
8 A.P. de Lima Batista, A.G.S. de Oliveira-Filho and S.E. Galembeck, Phys. Chem. Chem. Phys. 2017, 19, 13860-13867.
9 J.S. Garcia, F. Alary, M. Boggio-Pasqua, I.M. Dixon and J.-L. Heully, J. Mol. Model. 2016, 22:284
10 G.L.S. Rodrigues and W.R. Rocha, J. Phys. Chem. B 2016, 120, 11821-11833. 11 L. Freitag and L. Gonzalez, Inorg. Chem. 2017, 53, 6415-6426.
12 (a) R. Galvao de Lima, M. Gama Sauaia, C. Ferezin, I. Muniz Pepe, N.M. Jose, L.M. Bendhack, Z. Novais da Rocha and R. Santana da Silva, Polyhedron 2007, 26, 4620-4624 ; (c) M. Gama Sauaia, R. Galvao de Lima, A.C. Tedesco and R. Santana Da Silva, J. Am. Chem. Soc. 2003, 125, 14718-14719; (d) M. Gama Sauaia, F. de Souza Oliveira, A.C. Tedesco and R. Santana Da Silva, Inorg. Chim. Acta 2003, 355, 191-196; (e) V. Togniolo, R. Santana da Silva and A.C. Tedesco, Inorg. Chim. Acta 2001, 316, 7-12.
13 (a) F.O.N. Silva, M.C.L. Candido, A.K.M. Holanda, I.C.N. Diogenes, E.H.S. Sousa and L.G.F. Lopes, J. Inorg. Biochem. 2011, 105, 624-629 ; (b) F.O.N. Silva, S.X.B. Araujo, A.K.M. Holanda, E. Meyer, F.A.M. Sales, I.C.N. Diogenes, I.M.M. Carvalho, I.S. Moreira, and L.G.F. Lopes, Eur. J. Inorg. Chem. 2006, 10, 2020-2026.
14 E.C. Fornari, M.S.P. Marchesi, A.E.H. Machado and S. Nikolaou, Polyhedron 2009, 28, 1121-1126.
15 (a) A.D. Chowdhury, P. De, S.M. Mobin and G.K. Lahiri, RSC Advances 2012, 2, 3437-3446; (b) P. De, B. Sarkar, S. Maji, A.K. Das, E. Bulak, S.M. Mobin, W. Kaim and G.K. Lahiri, Eur. J. Inorg. Chem. 2009, 18, 2702-2710; (c) S. Maji, B. Sarkar, M. Patra, A.K. Das, S.M. Mobin, W. Kaim and G.K. Lahiri, Inorg. Chem. 2008, 47, 3218-3227.
16 H. Giglmeier, T. Kerscher, P. Kluefers, D. Schaniel and Th. Woike, Dalton Trans. 2009, 42, 9113-9116.
17 R. Galvao de Lima, M. Gama Sauaia, D. Bonaventura, A.C. Tedesco, L.M. Bendhack and R. Santana da Silva, Inorg. Chim. Acta 2006, 359, 2543-2549;
18 (a) A. Enriquez-Cabrera, I. Sasaki, V. Bukhanko, M. Tassé, S. Mallet-Ladeira, P.G. Lacroix, R.M. Barba-Barba, G. Ramos, N. Farfán, Z. Voitenko and I. Malfant, Eur. J. Inorg. Chem. 2017, 1446-1456.
(b) A. Enriquez-Cabrera, P.G. Lacroix, I. Sasaki, S. Malet-Ladeira, N. Farfan, R.M. Barba-Barba, G. Ramos-Ortiz and I. Malfant, Eur. J. Inorg. Chem. 2018, 531-543.
(c) V. Bukhanko, P.G. Lacroix, I. Sasaki, M. Tassé, S. Mallet-Ladeira, Z. Voitenko and I. Malfant, Inorg. Chim. Acta 2018, 482, 195-205.
27 19 (a) W.R. Murphy Jr., K. Takeuchi, M.H. Barley and T.J. Meyer, Inorg. Chem. 1986, 25,
1041-1053.
(b) D.W. Pipes and T.J. Meyer, Inorg. Chem. 1984, 23, 2466-2472.
20 E.C. Constable , C.E. Housecroft, M. Neuburger, I. Poleschak and M. Zehnder, Polyhedron, 2003, 22, 93-108.
21 Y. Chen, W. Guo, Z. Ye,G. Wang and J. Yuan, Chem. Comm., 2011, 47, 6266-6268.
22 P.A. Adcock, F. Richard Keene, R. S. Smythe and M.R. Snow, Inorg. Chem., 1984, 23, 2336-2343.
23
A. J. Liu, Q. Duan, J. Wang, Z. Song, X. Qiao and H. Wang, J. Biomed. Opt., 2015,
20(1), 015004-1 - 015004-7.
24 Gaussian 09, Revision D.01, M. J. Frisch, G. W. Trucks, H. B. Schlegel, G. E. Scuseria, M. A. Robb, J. R. Cheeseman, G. Scalmani, V. Barone, B. Mennucci, G. A. Petersson, H. Nakatsuji, M. Caricato, X. Li, H. P. Hratchian, A. F. Izmaylov, J. Bloino, G. Zheng, J. L. Sonnenberg, M. Hada, M. Ehara, K. Toyota, R. Fukuda, J. Hasegawa, M. Ishida, T. Nakajima, Y. Honda, O. Kitao, H. Nakai, T. Vreven, J. A. Montgomery, Jr., J. E. Peralta, F. Ogliaro, M. Bearpark, J. J. Heyd, E. Brothers, K. N. Kudin, V. N. Staroverov, R. Kobayashi, J. Normand, K. Raghavachari, A. Rendell, J. C. Burant, S. S. Iyengar, J. Tomasi, M. Cossi, N. Rega, J. M. Millam, M. Klene, J. E. Knox, J. B. Cross, V. Bakken, C. Adamo, J. Jaramillo, R. Gomperts, R. E. Stratmann, O. Yazyev, A. J. Austin, R. Cammi, C. Pomelli, J. W. Ochterski, R. L. Martin, K. Morokuma, V. G. Zakrzewski, G. A. Voth, P. Salvador, J. J. Dannenberg, S. Dapprich, A. D. Daniels, Ö. Farkas, J. B. Foresman, J. V. Ortiz, J. Cioslowski, and D. J. Fox, Gaussian, Inc., Wallingford CT, 2009.
25 J. Tomasi, B. Mennucci, and R. Cammi, Chem. Rev. 2005, 105, 2999-3093.
26 (a) P. J. Hay and W. R. Wadt, J. Chem. Phys. 1985, 82, 270-283. (b) W. R. Wadt and P. J. Hay, J. Chem. Phys. 1985, 82, 284-298. (c) P. J. Hay and W. R. Wadt, J. Chem. Phys. 1985,
82, 299-310.
27 for example: (a) M. P. Waller, H. Braun, N. Hojdis and M. Bühl, J. Chem. Theory Comput. 2007, 3, 2234-2242. (b) T. Ayed, J. C. Barthelat, B. Tangour, C. Pradère, B. Donnadieu, M. Grellier and S. Sabo-Etienne, Organometallics 2005, 24, 3824-3826. (c) H. Hratchian and M. C. Milleti, J. Mol. Struct. : THEOCHEM 2005, 340, 119-126. (d) D. Huang, W. E. Streib, O. Eisenstein and K. G. Caulton, Organometallics 2000, 19, 1967-1972.
28 P. Hirva, M. Haukka and M. Jaconen, J. Mol. Modell. 2008, 14, 171-181. 29 T. Yanai, D. Tew, and N. Handy, Chem. Phys. Lett. 2004, 393, 51-57.
30 Program Sa3.3 written by D. Lavabre and V. Pimienta ( http://cinet.chim.pagesperso-orange.fr/tele_sa/install_Sa.html).
31 V. Pimienta, C. Frouté, M.-H. Deniel, D. Lavabre, R. Guglielmetti and J. C. Micheau, J.
28 32 J. Akl, Ch. Billot, P.G. Lacroix, I. Sasaki, S. Malet-Ladeira, I. Malfant, R. Arcos-Ramos, M.
Romero and N. Farfan, New J. Chem. 2013, 37, 3518-3527.
33 M. Roose, I. Sasaki, V. Bukhanko, S. Mallet-Ladeira, R.M. Barba-Barba, G. Ramos-Ortiz, A. Enriquez-Cabrera, N. Farfan, P.G. Lacroix and I. Malfant, Polyhedron 2018, 151, 100-111. 34 K. Abbas and D. Marji, Zeitschrift fur Naturforsch. - Sect. A J. Phys. Sci. 2005, 60, 667-671. 35 F. Kanoufi, Y. Zu and A.J. Bard, J. Phys. Chem. B 2001, 105, 210-216.
36 N.L. Fry and P.K. Mascharak, Dalton Trans. 2012, 41, 4726-4735.
37 A.C. Merkle, N.L. Fry, P.K. Mascharak and N. Lehnert, Inorg. Chem. 2011, 50, 12192-21203 38 W. Zheng, S. Wu, S. Zhao, Y. Geng, J. Jin, Z. Su and Q. Fu, Inorg. Chem. 2012, 51,
3972-3980.
39 L. Freitag and L. González, Inorg. Chem. 2014, 53, 6415-6426
40 A.P. de Lima Batista, A.G.S. de Oliveira-Filho, and S.E. Galembeck, Phys. Chem. Chem.
Phys. 2017, 19, 13860-13867.
41 S. Amabilino, M. Tasse, P.G. Lacroix, S. Mallet-Ladeira, V . Pimienta, J. Akl, I. Sasaki and I. Malfant, New J. Chem. 2017, 41, 7371-7383.
42 L. Khadeeva, W. Kaszub, M. Lorenc, I. Malfant and M. Buron-Le Cointe, Inorg.Chem. 2016,
55, 4117-4123.
43 L.M. Loftus, K.F. Al-Afyouni, Kathlyn F. and C. Turro, Chem Eur. J. 2018, 24, 11550-11553. 44 D. Havrylyuk, D.K. Heidary, L. Nease, S. Parkin and E.C. Glazer, Eur. J. Inorg. Chem. 2017,
1687-1694.
45 E. Wachter, D.K. Heidary, B.S. Howerton, S. Parkin and E.C. Glazer, Chem. Commun. 2012,
48, 9649–9651
 3 , [RuT0B2](PF 6 ) 3 , and [RuT1B2](PF 6 ) 3 (black solid line) with deconvolutions: the red dashed lines are the sum of the contribution of dotted lines (see text)](https://thumb-eu.123doks.com/thumbv2/123doknet/13638178.427141/20.892.318.578.507.1045/figure-visible-spectra-black-deconvolutions-dashed-contribution-dotted.webp)
 3 and those of the parents [RuT1B0](PF 6 ) 3 (blue) and [RuT0B2](PF 6 ) 3 (red) compou](https://thumb-eu.123doks.com/thumbv2/123doknet/13638178.427141/21.892.152.685.494.859/comparison-convoluted-computed-transitions-showing-matching-visible-spectrum.webp)
![Figure 6 Representative triplet signal from NO· trapped by [Fe II (MGD) 2 ] in acetonitrile, after irradiation of [RuT0B2](PF 6 ) 3 , with a Hg lamp (bottom)](https://thumb-eu.123doks.com/thumbv2/123doknet/13638178.427141/22.892.283.632.577.1033/figure-representative-triplet-signal-trapped-mgd-acetonitrile-irradiation.webp)
 3 , [RuT1B0](PF 6 ) 3 , [RuT0B2](PF 6 ) 3 , and [RuT1B2](PF 6 ) 3](https://thumb-eu.123doks.com/thumbv2/123doknet/13638178.427141/24.892.204.736.99.477/table-quantum-yield-release-irradiation-intense-energy-transition.webp)
