HAL Id: inserm-02497242
https://www.hal.inserm.fr/inserm-02497242
Submitted on 3 Mar 2020
HAL is a multi-disciplinary open access
archive for the deposit and dissemination of
sci-entific research documents, whether they are
pub-lished or not. The documents may come from
teaching and research institutions in France or
abroad, or from public or private research centers.
L’archive ouverte pluridisciplinaire HAL, est
destinée au dépôt et à la diffusion de documents
scientifiques de niveau recherche, publiés ou non,
émanant des établissements d’enseignement et de
recherche français ou étrangers, des laboratoires
publics ou privés.
Hyperprogression under Immune Checkpoint Inhibitor:
a potential role for germinal immunogenetics
Sadal Refae, Jocelyn Gal, Patrick Brest, Damien Giacchero, Delphine
Borchiellini, Nathalie Ebran, Frederic Peyrade, Joël Guigay, Gérard Milano,
Esma Saada-Bouzid
To cite this version:
Sadal Refae, Jocelyn Gal, Patrick Brest, Damien Giacchero, Delphine Borchiellini, et al..
Hyperpro-gression under Immune Checkpoint Inhibitor: a potential role for germinal immunogenetics. Scientific
Reports, Nature Publishing Group, 2020, 10 (1), pp.3565. �10.1038/s41598-020-60437-0�.
�inserm-02497242�
Hyperprogression under immune
checkpoint inhibitor: a potential
role for germinal immunogenetics
Sadal Refae
1, Jocelyn Gal
2, patrick Brest
3, Damien Giacchero
4, Delphine Borchiellini
4,
nathalie ebran
1, frederic peyrade
4, Joël Guigay
4, Gérard Milano
1*& esma Saada-Bouzid
4 Hyperprogressive disease (HpD), an unexpected acceleration of tumor growth kinetics, is described in cancer patients treated with anti-PD-1/anti-PD-L1 agents. Here, our aim was to take into consideration the host and explore whether single nucleotide polymorphisms (Snps) in key genes involved in immune response might predispose to HPD. DNA was extracted from blood-samples from 98 patients treated under CPI monotherapy. Four candidate genes (PD-1, PD-L1, IDO1 and VEGFR2) and 15 potential SNPs were selected. The TGKR (ratio of the slope of tumor growth before treatment and the slope of tumorgrowth on treatment) was calculated. Hyperprogression was defined as a TGKR≥2. TGKR calculation
was feasible for 80 patients (82%). HPD was observed for 11 patients (14%) and was associated with shorter overall survival (p = 0.003). In univariate analysis, HPD was significantly associated with age ≥70 y (P = 0.025), immune-related toxicity (P = 0.016), VEGFR2 rs1870377 A/T or A/A (P = 0.005), PD-L1 rs2282055 G/T or G/G (P = 0.024) and PD-L1 rs2227981 G/A or A/A (P = 0.024). Multivariate analysis confirmed the correlation between HPD and age ≥70 y (P = 0.006), VEGFR2 rs1870377 A/T or A/A (P = 0.007) and PD-L1 rs2282055 G/T or G/G (P = 0.018). Immunogenetics could become integral predictive factors for CPI-based immunotherapy.
Checkpoint inhibitors (CPIs) including compounds targeting PD-1/PD-L1 axes have brought significant improvements in terms of overall survival in several types of advanced cancers1–6. A single response profile, such
as pseudo-progression, is observed under CPIs7. Among these typically-related response profiles under CPIs is hyperprogressive disease (HPD) which was defined as an unanticipated and paradoxical acceleration of the tumor growth7,8. The incidence of HPD is variable according to the way it is defined and ranges between 4 and
29%7. Though such acceleration of the tumor growth kinetic was also observed with other agents
(chemother-apy9, tyrosine kinase inhibitors10), the intensity and the frequency of the phenomenon appears to be higher with
checkpoint inhibitors used alone7. A single response profile, such as pseudo-progression, is observed under CPIs7.
Among these typically-related response prfiles under CPIs is hyperprogressive disease (HPD), which has been defined as an unanticipated and paradoxical acceleration of tumor growth7,8. The incidence of HPD is variable
according to the way it is defined and ranges between 4 to 29%7. Although this acceleration of tumor growth
kinetics was also observed with other agents (chemotherapy9, tyrosine kinase inhibitors10), the intensity and
frequency of the phenomenon appears to be higher with checkpoint inhibitors used alone7. HPD may be
asso-ciated with a worsening of the outcome11. Different physiopathological hypotheses have been tested to explain
phenomena such as tumoral genomics variations12,13. Indeed, CPI has been shown to hasten tumor growth in a
mouse model with a relative lack of PD-1 expression14. As HPD was observed in several malignant tumor types,
a role for the host variations has been advocated13,15,16. Indeed, allelic variations of HLA class I genes have been
shown to impact clinical outcome under CPI17. However, dedicated germinal immunogenetics studies remains
rare in the context of CPI-based treatment18. To better elucidate the potential relationship between host
immu-nogenetics and CPI treatment outcome and particularly HPD, we correlated the outcome of patients treated with CPI and selected polymorphisms described in four key genes: PD-1 (Programmed Cell Death 1 gene, 2q37.3),
PD-L1 (Programmed Death Ligand 1 gene, 9p24.1), IDO1 (Indoleamine 2,3-Dioxygenase 1 gene, 8p11.21) and VEGFR2 (Vascular Endothelial Growth Factor Receptor 2 gene, 4q12).
1University Côte d’Azur, Centre Antoine Lacassagne, Oncopharmacology Unit, Nice, France. 2University Côte d’Azur,
Centre Antoine Lacassagne, Epidemiology and Biostatistics Department, Nice, France. 3University Côte d’Azur,
Centre Antoine Lacassagne, CNRS, Inserm, Ircan, FHU-Oncoage, Nice, F-06189, France. 4University Côte d’Azur,
Centre Antoine Lacassagne, Medical Oncology Department, Nice, France. *email: [email protected]
www.nature.com/scientificreports
www.nature.com/scientificreports/
Results
Patient characteristics and outcome.
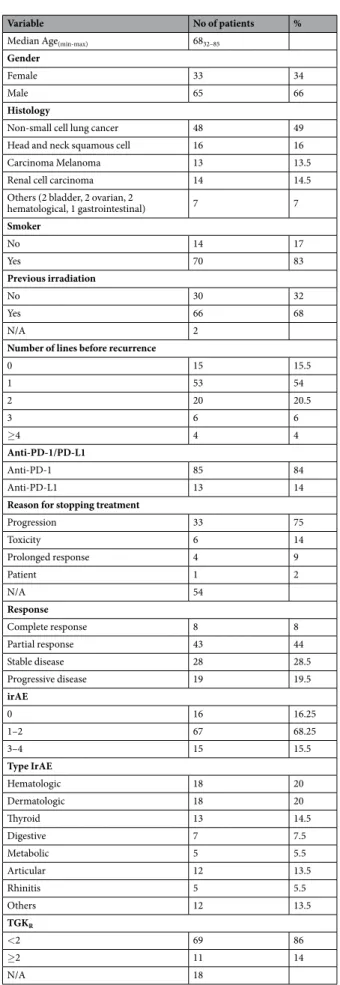
Patient baseline characteristics are given in Table 1. All patients were treated for an advanced malignancy. Non-small cell lung cancer (NSCLC) (n = 48) was the largest subgroup followed mainly by head and neck squamous cell carcinoma (HNSCC) (n = 16), renal cell carcinoma (RCC) (n = 14) and melanoma (n = 13). Importantly, all patients were treated by CPI monotherapy alone (PD-1 or anti-PD-L1), with a majority of anti-PD1 (87%). Median age was 68 (range: 32–85), 65 were males (66%) and 70 were smokers (83%). Sixty-six patients had received previous irradiation (69%). The SNP genotype, gene information and genotype frequency are shown in Table 2.Median follow-up was 13.3 months (95% confidence interval [CI]; 10.6 months to 15.4 months). Median irPFS was 16.8 months (95% confidence interval [CI]; 10.2 months to NA) and median OS was not reached. Twelve-month OS and 12-month PFS were 80% (95% confidence interval [CI], 72% to 90%) and 47% (95% con-fidence interval [CI]; 5% to 60%), respectively.
Fifteen patients experienced grade 3–4 IrAEs (15.5%), 67 grade 1–2 IrAEs (68.25%) and 16 patients had no IrAE (16.25%). Overall response was complete for 8 patients (8%), partial for 43 patients (44%), stable disease for 28 patients (28.5%) and progressive disease for 19 patients (19.5%). TGKR could be calculated for 80 patients (15
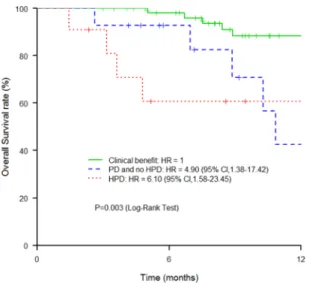
patients had CPI as first line for advanced disease; pre-baseline scanner was not available for 3 patients). HPD was observed in 11 patients (14%). HPD was correlated with shorter OS (Fig. 1) compared with non-HPD patients (P = 0.003).
HPD predictive factors.
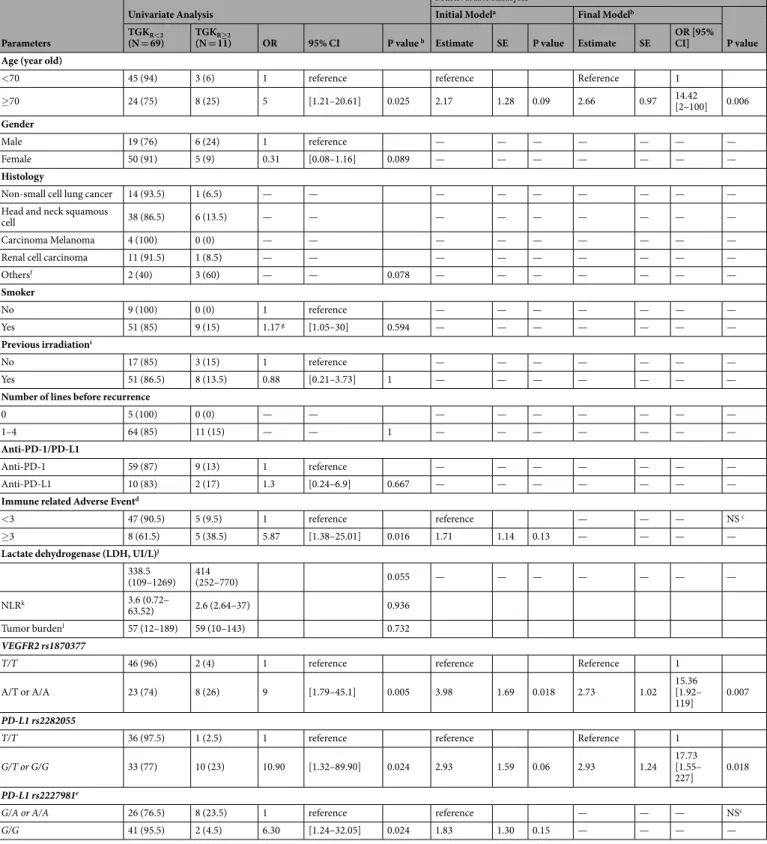
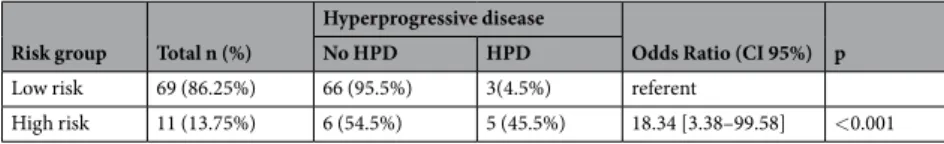
In univariate analysis (Table 3), HPD was significantly associated with age ≥70 years (25% versus 6%; P = 0.025), immune-related toxicity grade ≥3 (38.5% versus 9.5%; P = 0.016), VEGFR2 rs1870377 A/T or A/A (26% versus 4%; P = 0.005), PD-L1 rs2282055 G/T or G/G (23% versus 2.5%; P = 0.024) and PD-L1 rs2227981 G/G (4.5% versus 23.5%; P = 0.024). HPD was not significantly correlated with lactate dehydrogenase (LDH) blood levels at baseline (p = 0.055). Similarly, the neutrophil-to-lymphocyte ratio (NLR) was not linked to HPD (p = 0.936). Also, tumor burden was not associated with HPD (p = 0.732). Multivariate analysis revealed an independen t association between HPD and age ≥ 70 years (OR = 14.42; 95% confidence interval [CI]; 2 to 100; P = 0.006), rs1870377 T/A or A/A, and VEGFR2 (OR = 15.36; 95% confidence interval [CI]; 1.92 to 119; P = 0.007) and rs2282055 T/G or G/G, PDL1 (OR = 17.73; 95% confidence interval [CI]; 11.55 to 227; P = 0.01).A risk score was calculated by logistic regression and integrated the 3 independent variables (age, rs2282055, rs1870377) for predicting HPD. The risk for HPD was optimally estimated (OR = 18.34; 95% confidence interval [CI]; 3.38 to 99.58; P <0.001) (Table 4).
Discussion
We observed HPD in 14% of treated patients by CPI, a figure in the range of figures reported in independ-ent series7. We identified older age as a predictive variable for HPD in accord with previously reported series11.
However, this point is controversial and observations have been reported in recent studies by Kim et al.19 and
Ferrara et al.9 showingno association between HPD and age. These discrepancies may be due to the different
evaluation methods used to evaluate HPD as well as to the retrospective nature of these studies. In agreement with others19, we noted that patients with HPD had higher baseline LDH levels but which did not reach statistical
significance in our hands. Our negative finding contrasts with that of Kim and coworkers19 reporting that patients
with HPD had baseline NLR values higher than those of patients without HPD. This discrepancy can be explained by the retrospective nature of both studies and also by the relatively small number of patients. Clearly, prospective studies based on a larger set of patients would be more likely to provide firmer conclusions regard of this possible association between baseline NLR and the risk to developing HPD under CPI. To the best of our knowledge, the present study is the first cohort that explores the link between host gene polymorphisms and HPD under CPI. Our data highlight two germinal variations with rs2282055 (PD-L1) and rs1870377 (VEGFR2) having a signifi-cant and independent influence on the occurrence of HPD.
The group of patients with rs2282055 (PD-L1) G allele, either homozygous or heterozygous, was found to be significantly associated with a higher risk of developing HPD in comparison with T/T genotype, the locus being located on chromosome 9p24.1. When expressed on tumor cells, this gene down-regulates the activation of T effector cells through a key mechanism responsible for immune response evasion20. However, the real impact of
tumor PD-L1 expression on treatment outcome under CPI remains controversial21. The regulation of tumoral and
non-tumoral PD-L1 expression is a complex phenomenon and is influenced by multiple molecular pathways22–24.
rs2282055 (PD-L1) is associated with 10 other SNP all inserted in different introns of the PD-L1 gene25. It has
been shown that introns may have a direct or indirect influence on mRNA expression: GTEX portal ( https://gtex-portal.org/home/) indicates that rs2282055 is associated with down-regulated expression of PD-L1 (CD274 gene) in brain tissue while it is overexpressed in the pancreas, suggesting that rs2282055 may impact PD-L1 expres-sion differently in different tissues. rs2282055 (PD-L1) was recently evaluated for its association with survival of patients not treated by CPI26. In this latter study, the impact of rs2282055 (PD-L1) polymorphism on survival was
found to be non-significant, thus suggesting a non-prognostic role of this polymorphism. Since PD-L1 expression was not available in our cohort, we could not examine potential links between this rs and the level of expression of PD-L1 protein In conclusion, it can be suggested that rs2282055 (PD-L1) may interfere with CPI-HPD devel-opment, while the underlying mechanism remains to be elucidated.
VEGFR2 is a gene encoding for vascular endothelial growth factor receptor 2 expressed on both endothelial
cells and various immune cells27,28. VEGFR2 is a key regulator of tumor angiogenesis and tumor
microenviron-ment by mainly promoting a high level of Tregs and by reducing the ability of T effector cells to penetrate the tumor cell bed29. Of note, rs1870377 (KDR, VEGFR2, NM_002253.3:c.1416A>T) induces a missense substitution
Variable No of patients % Median Age(min-max) 6832–85
Gender
Female 33 34
Male 65 66
Histology
Non-small cell lung cancer 48 49
Head and neck squamous cell 16 16
Carcinoma Melanoma 13 13.5
Renal cell carcinoma 14 14.5
Others (2 bladder, 2 ovarian, 2
hematological, 1 gastrointestinal) 7 7 Smoker No 14 17 Yes 70 83 Previous irradiation No 30 32 Yes 66 68 N/A 2
Number of lines before recurrence
0 15 15.5 1 53 54 2 20 20.5 3 6 6 ≥4 4 4 Anti-PD-1/PD-L1 Anti-PD-1 85 84 Anti-PD-L1 13 14
Reason for stopping treatment
Progression 33 75 Toxicity 6 14 Prolonged response 4 9 Patient 1 2 N/A 54 Response Complete response 8 8 Partial response 43 44 Stable disease 28 28.5 Progressive disease 19 19.5 irAE 0 16 16.25 1–2 67 68.25 3–4 15 15.5 Type IrAE Hematologic 18 20 Dermatologic 18 20 Thyroid 13 14.5 Digestive 7 7.5 Metabolic 5 5.5 Articular 12 13.5 Rhinitis 5 5.5 Others 12 13.5 TGKR <2 69 86 ≥2 11 14 N/A 18
Table 1. Patient characteristics. Abbreviations: N/A = Not Available; Anti PD-L1 = Anti-programmed cell death ligand1; Anti PD-1 = Anti-programmed cell death; TGKR= Tumor growth kinetic rate.
www.nature.com/scientificreports
www.nature.com/scientificreports/
and activity inducing increased microvessel density in tumor tissue of patients with non-small cell lung cancer30.
In our series, carriers of rs1870377 (VEGFR2) with any A genotype were more prone to develop HPD. Thus,
VEGFR2 substitution Q472H may play a potential role in increased tumor size due to increased angiogenesis and
microvessel development in these patients. It is thus conceivable that the impact of VEGFR2 on tumor and its microenvironment may differ according to the allelic inheritance of the host with an influence on HPD develop-ment under CPI.
Collectively, one can formulate a working hypothesis with HPD occurring in a subset of patients harboring unfavorable alleles which modulate the expression of different genes inducing tumor progression under CPI. It was interesting to identify key immunology-linked genes like PD-L1 and VEGFR2 gene variants using this approach. The present reported results remain challenging in clinical practice with particular attention given to the fact that most allelic variations are present at relatively low frequencies. However, this study contains a num-ber of limitations which do not allow drawing definitive conclusion: the sample size is relatively small (11 HPD cases) and patients received two different classes of PD-1 and PD-L1 CPI. TGKR was not assessable for first-line
treated patients. The study covered different histological types and some patients had been more or less heavily pretreated. According to the meta-analysis by Kim and coworkers31, the histological type of the tumor is not
pre-dictive value for the occurrence of HPD. However, it has been reported that renal cell carcinoma (RCC) patients may be at a lesser risk of HPD11,32. Of note, our cohort was also enriched with long-responding patients as all
patients alive and treated with CPI in the department were asked their consent to dedicated blood sampling for the study. This explains the high response rate reported in our series (52%). Above all, the study remains original leading to identification of potential host-linked biomarkers for HPD prediction. Interestingly, it was possible to establish a powerful (OR = 18.34; 95% confidence interval [CI]; 3.38 to 99.58; P <0.001) predictive score com-bining host characteristics such as age and germinal gene polymorphisms. Evaluating the risk of HPD by testing host immunogenetics must remain probabilistic in nature and may differ according to ethnic population, thus limiting extrapolation of the present study outside the Caucasian population. Efforts to expand other candidate
Gene SNPs
PD-1 PD-L1 VEGFR2 IDO1
rs10204525 rs11568821 rs2227981 rs2282055 rs2297136 rs2297137 rs4143815 rs10815225 rs2305948 rs1870377 rs2071559 rs3739319 rs3808606 rs373931 rs9657182 Population
C/C (81) C/C (74) A/A (12) T/T (49) G/G (16) G/G (52) G/G (42) G/G (68) C/C (84) T/T (63) A/A (25) G/G (23) A/A (12) T/T (3) C/C (17) C/T (17) C/T (21) A/G (42) G/G(3) A/A (28) A/A (4) C/C (13) C/C (4) C/T (14) A/A (3) A/G (23) A/A (25) A/G (57) C/C (65) C/T (53) T/T (0) T/T (1) G/G (41) G/T (46) A/G (54) A/G (41) C/G (42) C/G (24) T/T (0) A/T (32) G/G (50) A/G (50) G/G (29) C/T (30) T/T (28) Ancestral allele C/T Ancestral: A C/T Ancestral: C A/G Ancestral: G T/G Ancestral: T G/A Ancestral: G G/A Ancestral: G G/C Ancestral: G G/A Ancestral: G C/T Ancestral: C T/A Ancestral: T A/G Ancestral: A G/A Ancestral: G A/G Ancestral: G T/C Ancestral: C C/T Ancestral: T Minor allele
frequency 0.35 (T) 0.04 (T) 0.35 (A) 0.30 (G) 0.33 (G) 0.23 (A) 0.28 (C) 0.16 (C) 0.15 (T) 0.21 (A) 0.5 (A) 0.41 (A) 0.46 (A) 0.16 (T) 0.45 (C) SNPs
Functional Impact
3′UTR
variant Intron variant
Synony-mous variant
Intron variant 3′UTR variant
Non-coding transcript exon variant 3′UTR
variant Upstream gene variant Missense variant Missense variant Upstream gene variant
Intron
variant Intron variant Intergenic variant Intron variant
Table 2. Summary of genotyping results by MassARRAY (AGENA) of 98 patients.
Figure 1. Association between HPD and OS: Kaplan Meier estimates of OS of patients treated with anti PD1/ anti PDL1 according to ir-RECIST criteria: clinical benefit (complete response, partial response, stable disease), PD non HPD (progressive disease) and HPD.
Parameters
Univariate Analysis
Multivariate Analysis
Initial Modela Final Modelb
P value TGKR<2
(N = 69) TGKR≥2 (N = 11) OR 95% CI P value h Estimate SE P value Estimate SE OR [95% CI] Age (year old)
<70 45 (94) 3 (6) 1 reference reference Reference 1
≥70 24 (75) 8 (25) 5 [1.21–20.61] 0.025 2.17 1.28 0.09 2.66 0.97 14.42 [2–100] 0.006
Gender
Male 19 (76) 6 (24) 1 reference — — — — — — —
Female 50 (91) 5 (9) 0.31 [0.08–1.16] 0.089 — — — — — — —
Histology
Non-small cell lung cancer 14 (93.5) 1 (6.5) — — — — — — — — —
Head and neck squamous
cell 38 (86.5) 6 (13.5) — — — — — — — — —
Carcinoma Melanoma 4 (100) 0 (0) — — — — — — — — —
Renal cell carcinoma 11 (91.5) 1 (8.5) — — — — — — — — —
Othersf 2 (40) 3 (60) — — 0.078 — — — — — — — Smoker No 9 (100) 0 (0) 1 reference — — — — — — — Yes 51 (85) 9 (15) 1.17 g [1.05–30] 0.594 — — — — — — — Previous irradiationi No 17 (85) 3 (15) 1 reference — — — — — — — Yes 51 (86.5) 8 (13.5) 0.88 [0.21–3.73] 1 — — — — — — —
Number of lines before recurrence
0 5 (100) 0 (0) — — — — — — — — —
1–4 64 (85) 11 (15) — — 1 — — — — — — —
Anti-PD-1/PD-L1
Anti-PD-1 59 (87) 9 (13) 1 reference — — — — — — —
Anti-PD-L1 10 (83) 2 (17) 1.3 [0.24–6.9] 0.667 — — — — — — —
Immune related Adverse Eventd
<3 47 (90.5) 5 (9.5) 1 reference reference — — — NS c
≥3 8 (61.5) 5 (38.5) 5.87 [1.38–25.01] 0.016 1.71 1.14 0.13 — — — —
Lactate dehydrogenase (LDH, UI/L)j 338.5 (109–1269) 414 (252–770) 0.055 — — — — — — — NLRk 3.6 (0.72– 63.52) 2.6 (2.64–37) 0.936 Tumor burdenl 57 (12–189) 59 (10–143) 0.732 VEGFR2 rs1870377
T/T 46 (96) 2 (4) 1 reference reference Reference 1
A/T or A/A 23 (74) 8 (26) 9 [1.79–45.1] 0.005 3.98 1.69 0.018 2.73 1.02 15.36 [1.92– 119] 0.007
PD-L1 rs2282055
T/T 36 (97.5) 1 (2.5) 1 reference reference Reference 1
G/T or G/G 33 (77) 10 (23) 10.90 [1.32–89.90] 0.024 2.93 1.59 0.06 2.93 1.24 17.73 [1.55–
227] 0.018
PD-L1 rs2227981e
G/A or A/A 26 (76.5) 8 (23.5) 1 reference reference — — — NSc
G/G 41 (95.5) 2 (4.5) 6.30 [1.24–32.05] 0.024 1.83 1.30 0.15 — — — —
Table 3. Univariate and multivariate analyses for hyperprogressive disease. Significant p values are bolded;
aInitial model: including all variables with P < 0.05 in univariate analysis; bFinal model: same model after
backward stepwise algorithm; cNS = not significant after stepwise algorithm; dData available for 65 patients; eData available for 77 patients; f2 bladder, 2 ovarian, 1 gastrointestinal; gRelative Risk [95% CI]; hFisher’s exact
or Wilcoxon’s test; iData available for 79 patients; jmedian (min-max), Baseline data available for 55 patients:
N = 48 for TGKR <2 and N = 7 for TGKR ≥2; kNeutrophil-to Lymphocyte Ratio; median (min-max); lSum of
www.nature.com/scientificreports
www.nature.com/scientificreports/
genes and their polymorphisms are currently ongoing in larger prospective cohorts. Particular attention should be paid to allelic variations of HLA class I genes.
Finally, our results support the notion of a genetic susceptibility potentially impacting the development of HPD in a Caucasian population. In a broader perspective, it is hoped that the present data can stimulate further studies integrating both somatic and germinal variability aimed at satisfying the still unmet need for faithful pre-dictive biomarkers to ensure enhanced management of cancer therapy by CPI.
patients and Methods
Study design and patients.
This is a retrospective study covering the period April to August 2018. All data were retrieved from the clinical database of the Centre Antoine Lacassagne (Nice, France). Tumor responses were evaluated after monotherapy according to RECIST 1.1 criteria (complete response (CR), partial response (PR), stable disease (SD), and progressive disease (PD)). Objective response was evaluated as previously published33–35.Immune-related adverse events (irAEs) were evaluated according to National Cancer Institute Common Terminology Criteria for Adverse Events (NCI-CTCAE V5). Pre-baseline, baseline, and initial imaging results were recorded and were to calculate the TGKR (ratio of the slope of tumor growth before treatment and the slope of tumor growth during
treatment), as previously reported8. The sum of the largest diameter of target lesions at baseline indicated the tumor
burden at baseline. HPD was defined as a TGKR ≥2. Written informed consent was systemically obtained before
collecting a study-dedicated blood sample. Patient characteristics, at baseline, also included age, gender, histology, smoker status, lactate dehydrogenase (LDH), neutrophil-to-lymphocyte (NLR) and tumor burden.
SNP selection and genotyping.
Seventeen SNPs of PD-1 (rs10204525; rs11568821; rs22727981),PD-L1 (rs2282055; rs2297136; rs2297137; rs4143815; rs10815225; rs822339), IDO1 (rs3739319; rs3808606;
rs373931; rs9657182; rs34820341) and VEGFR2 (rs2305948; rs1870377; rs2071559) were selected accord-ing to their functional and/or clinical relevance. Genomic DNA was extracted from a blood sample usaccord-ing the commercially-available Maxwell
®
16 LEV Blood DNA Kit (#AS1290, Promega). The assay to screen the 17 SNPs was created by using Assay Design Suite v2.0 (AGENA Bioscience online software) with the “Genotyping Design”option. We had created the assay to screen the 17 SNPs. Data were verified and compatible with DNA controls polymorphism for 15 SNPs; the remaining 2 SNPs had been eliminated (PD-L1 rs822339 and IDO1 rs34820341) because incompatible with DNA control polymorphism (https://www.coriell.org/1/NIGMS/ Collections/CEPH-Resources). For 15 SNPs minor allele frequency was ≥5% in Caucasians according to SNPpedia (http://www.snppedia.com) and the Ensemble database (http://www.Ensembl.org). All tested SNPs were in Hardy-Weinberg equilibrium (Table 2).Statistical considerations.
The link between the 15 SNPs and clinico-radiological parameters and CPI response according to ir-RECIST35 criteria and irAEs was examined. Statistical comparisons were performedusing χ2 test or Fisher’s exact test for categorical data and Student’s test or Wilcoxon’s test for continuous variables.
Immune-related progression-free survival (irPFS) and Overall Survival (OS) were respectively calculated from the baseline CT scan to progression (according to ir-RECIST criteria) or death and presented graphically using the Kaplan-Meier method. All variables significant at the 5% level in both univariate and multivariate logistic regression models were included. Co-linearity between all variables of the initial multivariate model was evalu-ated. The choice of the final model was made by performing a backward stepwise selection model. A fitted score for each participant by logistic regression was used to define two risk groups of patients (low or high risk of HPD). The optimal number of risk groups for predictive models was obtained using the Younden method36. Statistical
analyses were performed using R version 3.5.0 on Windows
®
.Ethical approval.
All procedures performed in studies involving human participants were in accordance with the ethical standards of the institutional and/or national research committee (French National Commission for Informatics and Liberties N°17010).Informed consent.
All patients provided written informed consent before enrollment. Received: 9 August 2019; Accepted: 11 February 2020;Published: xx xx xxxx
References
1. Bellmunt, J. et al. Pembrolizumab as Second-Line Therapy for Advanced Urothelial Carcinoma. N. Engl. J. Med. 376, 1015–1026,
https://doi.org/10.1056/NEJMoa1613683 (2017).
2. Ferris, R. L. et al. Nivolumab for Recurrent Squamous-Cell Carcinoma of the Head and Neck. N. Engl. J. Med. 375, 1856–1867,
https://doi.org/10.1056/NEJMoa1602252 (2016).
3. Herbst, R. S. et al. Pembrolizumab versus docetaxel for previously treated, PD-L1-positive, advanced non-small-cell lung cancer (KEYNOTE-010): a randomised controlled trial. Lancet 387, 1540–1550, https://doi.org/10.1016/S0140-6736(15)01281-7 (2016).
Risk group Total n (%)
Hyperprogressive disease
Odds Ratio (CI 95%) p
No HPD HPD
Low risk 69 (86.25%) 66 (95.5%) 3(4.5%) referent
High risk 11 (13.75%) 6 (54.5%) 5 (45.5%) 18.34 [3.38–99.58] <0.001 Table 4. Classification of patients based on risk group and risk evaluation of each group.
4. Horn, L. et al. Nivolumab Versus Docetaxel in Previously Treated Patients With Advanced Non-Small-Cell Lung Cancer: Two-Year Outcomes From Two Randomized, Open-Label, Phase III Trials (CheckMate 017 and CheckMate 057). J. Clin. Oncol. 35, 3924–3933, https://doi.org/10.1200/JCO.2017.74.3062 (2017).
5. Motzer, R. J. et al. Nivolumab versus Everolimus in Advanced Renal-Cell Carcinoma. N. Engl. J. Med. 373, 1803–1813, https://doi.
org/10.1056/NEJMoa1510665 (2015).
6. Robert, C. et al. Pembrolizumab versus Ipilimumab in Advanced Melanoma. N. Engl. J. Med. 372, 2521–2532, https://doi.
org/10.1056/NEJMoa1503093 (2015).
7. Borcoman, E. et al. Novel patterns of response under immunotherapy. Ann. Oncol. 30, 385–396, https://doi.org/10.1093/annonc/ mdz003 (2019).
8. Saada-Bouzid, E. et al. Hyperprogression during anti-PD-1/PD-L1 therapy in patients with recurrent and/or metastatic head and neck squamous cell carcinoma. Ann. Oncol. 28, 1605–1611, https://doi.org/10.1093/annonc/mdx178 (2017).
9. Ferrara, R. et al. Hyperprogressive Disease in Patients With Advanced Non-Small Cell Lung Cancer Treated With PD-1/PD-L1 Inhibitors or With Single-Agent Chemotherapy. JAMA. Oncol. 4, 1543–1552, https://doi.org/10.1001/jamaoncol.2018.3676 (2018). 10. Mellema, W. W., Burgers, S. A. & Smit, E. F. Tumor flare after start of RAF inhibition in KRAS mutated NSCLC: a case report. Lung
Cancer 87, 201–203, https://doi.org/10.1016/j.lungcan.2014.11.014 (2015).
11. Champiat, S. et al. Hyperprogressive Disease Is a New Pattern of Progression in Cancer Patients Treated by Anti-PD-1/PD-L1. Clin.
Cancer Res. 23, 1920–1928, https://doi.org/10.1158/1078-0432.CCR-16-1741 (2017).
12. Kato, S. et al. Hyperprogressors after Immunotherapy: Analysis of Genomic Alterations Associated with Accelerated Growth Rate.
Clin. Cancer Res. 23, 4242–4250, https://doi.org/10.1158/1078-0432.CCR-16-3133 (2017).
13. Liu, X. S. & Mardis, E. R. Applications of Immunogenomics to Cancer. Cell 168, 600–612, https://doi.org/10.1016/j.cell.2017.01.014 (2017). 14. Wartewig, T. et al. PD-1 is a haploinsufficient suppressor of T cell lymphomagenesis. Nat. 552, 121–125, https://doi.org/10.1038/
nature24649 (2017).
15. Fairfax, B. P. et al. Innate immune activity conditions the effect of regulatory variants upon monocyte gene expression. Sci. 343, 1246949, https://doi.org/10.1126/science.1246949 (2014).
16. Sun, C., Mezzadra, R. & Schumacher, T. N. Regulation and Function of the PD-L1 Checkpoint. Immun. 48, 434–452, https://doi. org/10.1016/j.immuni.2018.03.014 (2018).
17. Chowell, D. et al. Patient HLA class I genotype influences cancer response to checkpoint blockade immunotherapy. Sci. 359, 582–587, https://doi.org/10.1126/science.aao4572 (2018).
18. Nomizo, T. et al. Clinical Impact of Single Nucleotide Polymorphism in PD-L1 on Response to Nivolumab for Advanced Non-Small-Cell Lung Cancer Patients. Sci. Rep. 7, 45124, https://doi.org/10.1038/srep45124 (2017).
19. Kim, Y. et al. Comprehensive Clinical and Genetic Characterization of Hyperprogression Based on Volumetry in Advanced Non-Small Cell Lung Cancer Treated With Immune Checkpoint Inhibitor. J. Thorac. Oncol. 14, 1608–1618, https://doi.org/10.1016/j. jtho.2019.05.033 (2019).
20. Wang, Y. et al. Regulation of PD-L1: Emerging Routes for Targeting Tumor Immune Evasion. Front. Pharmacol. 9, 536, https://doi. org/10.3389/fphar.2018.00536 (2018).
21. Coelho, M. A. et al. Oncogenic RAS Signaling Promotes Tumor Immunoresistance by Stabilizing PD-L1 mRNA. Immun. 47, 1083–1099 e1086, https://doi.org/10.1016/j.immuni.2017.11.016 (2017).
22. Topalian, S. L., Drake, C. G. & Pardoll, D. M. Immune checkpoint blockade: a common denominator approach to cancer therapy.
Cancer Cell 27, 450–461, https://doi.org/10.1016/j.ccell.2015.03.001 (2015).
23. Ben Nasr, M. et al. PD-L1 genetic overexpression or pharmacological restoration in hematopoietic stem and progenitor cells reverses autoimmune diabetes. Sci Transl Med 9, https://doi.org/10.1126/scitranslmed.aam7543 (2017).
24. Sun, L. O. et al. Spatiotemporal Control of CNS Myelination by Oligodendrocyte Programmed Cell Death through the TFEB-PUMA Axis. Cell 175, 1811–1826 e1821, https://doi.org/10.1016/j.cell.2018.10.044 (2018).
25. Ward, L. D. & Kellis, M. HaploReg: a resource for exploring chromatin states, conservation, and regulatory motif alterations within sets of genetically linked variants. Nucleic Acids Res. 40, D930–934, https://doi.org/10.1093/nar/gkr917 (2012).
26. Yoon, S. et al. Prognostic relevance of genetic variants involved in immune checkpoints in patients with colorectal cancer. J. Cancer
Res. Clin. Oncol. 142, 1775–1780, https://doi.org/10.1007/s00432-016-2196-2 (2016).
27. Shibuya, M. Vascular Endothelial Growth Factor (VEGF) and Its Receptor (VEGFR) Signaling in Angiogenesis: A Crucial Target for Anti- and Pro-Angiogenic Therapies. Genes. Cancer 2, 1097–1105, https://doi.org/10.1177/1947601911423031 (2011).
28. Miettinen, M., Rikala, M. S., Rys, J., Lasota, J. & Wang, Z. F. Vascular endothelial growth factor receptor 2 as a marker for malignant vascular tumors and mesothelioma: an immunohistochemical study of 262 vascular endothelial and 1640 nonvascular tumors. Am.
J. Surg. Pathol. 36, 629–639, https://doi.org/10.1097/PAS.0b013e318243555b (2012).
29. Zhu, P., Hu, C., Hui, K. & Jiang, X. The role and significance of VEGFR2(+) regulatory T cells in tumor immunity. Onco Targets Ther.
10, 4315–4319, https://doi.org/10.2147/OTT.S142085 (2017).
30. Glubb, D. M. et al. Novel functional germline variants in the VEGF receptor 2 gene and their effect on gene expression and microvessel density in lung cancer. Clin. Cancer Res. 17, 5257–5267, https://doi.org/10.1158/1078-0432.CCR-11-0379 (2011). 31. Kim, J. Y. et al. Hyperprogressive Disease during Anti-PD-1 (PDCD1) / PD-L1 (CD274) Therapy: A Systematic Review and
Meta-Analysis. Cancers (Basel) 11, https://doi.org/10.3390/cancers11111699 (2019).
32. Hwang, I., Park, I., Yoon, S. K. & Lee, J. L. Hyperprogressive Disease in Patients With Urothelial Carcinoma or Renal Cell Carcinoma Treated With PD-1/PD-L1 Inhibitors. Clin Genitourin Cancer, https://doi.org/10.1016/j.clgc.2019.09.009 (2019).
33. Nishino, M. et al. Developing a common language for tumor response to immunotherapy: immune-related response criteria using unidimensional measurements. Clin. Cancer Res. 19, 3936–3943, https://doi.org/10.1158/1078-0432.CCR-13-0895 (2013). 34. Seymour, L. et al. iRECIST: guidelines for response criteria for use in trials testing immunotherapeutics. Lancet Oncol. 18,
e143–e152, https://doi.org/10.1016/S1470-2045(17)30074-8 (2017).
35. Wolchok, J. D. et al. Guidelines for the evaluation of immune therapy activity in solid tumors: immune-related response criteria.
Clin. Cancer Res. 15, 7412–7420, https://doi.org/10.1158/1078-0432.CCR-09-1624 (2009).
36. López-Ratón, M., Rodríguez-Álvarez, M. X., Cadarso-Suárez, C. & Gude-Sampedro, F. OptimalCutpoints: an R package for selecting optimal cutpoints in diagnostic tests. J. Stat. Softw. 61, 1–36 (2014).
Acknowledgements
The authors acknowledge support from Centre Antoine Lacassagne, Oncopharmacology unit team, University Côte d’Azur, France.
Author contributions
G.M. and E.S.B. conceived the research idea. J.Ga. and N.E. performed the data analysis. S.R. collected the data. S.R., J.Ga., P.B., D.G., D.B., N.E., F.P., J.Gu., G.M. and E.S.B. participated in the writing and are involved in critical revision of this manuscript for important intellectual content. All authors approved the final manuscript as submitted and agree to be accountable for all aspects of the work.
www.nature.com/scientificreports
www.nature.com/scientificreports/
competing interests
Gérard Milano is a member of an advisory board at B.M.S., M.S.D. and Merck. Fréderic Peyrade is a member of an advisory board at M.S.D. and Merck. Delphine Borchiellini is a member of an advisory board at M.S.D., Pfizer, Astra-Zeneca, Roche, B.M.S. Joel Guigay is a member of an advisory board at Merck. The remaining authors declare no competing interests.
Additional information
Correspondence and requests for materials should be addressed to G.M. Reprints and permissions information is available at www.nature.com/reprints.
Publisher’s note Springer Nature remains neutral with regard to jurisdictional claims in published maps and institutional affiliations.
Open Access This article is licensed under a Creative Commons Attribution 4.0 International License, which permits use, sharing, adaptation, distribution and reproduction in any medium or format, as long as you give appropriate credit to the original author(s) and the source, provide a link to the Cre-ative Commons license, and indicate if changes were made. The images or other third party material in this article are included in the article’s Creative Commons license, unless indicated otherwise in a credit line to the material. If material is not included in the article’s Creative Commons license and your intended use is not per-mitted by statutory regulation or exceeds the perper-mitted use, you will need to obtain permission directly from the copyright holder. To view a copy of this license, visit http://creativecommons.org/licenses/by/4.0/.