HAL Id: hal-01739513
https://hal-univ-rennes1.archives-ouvertes.fr/hal-01739513
Submitted on 25 Apr 2018
HAL is a multi-disciplinary open access
archive for the deposit and dissemination of sci-entific research documents, whether they are pub-lished or not. The documents may come from teaching and research institutions in France or abroad, or from public or private research centers.
L’archive ouverte pluridisciplinaire HAL, est destinée au dépôt et à la diffusion de documents scientifiques de niveau recherche, publiés ou non, émanant des établissements d’enseignement et de recherche français ou étrangers, des laboratoires publics ou privés.
observations and laboratory experiments
Karima Khalil, Anniet M. Laverman, Mélanie Raimonet, Christophe Rabouille
To cite this version:
Karima Khalil, Anniet M. Laverman, Mélanie Raimonet, Christophe Rabouille. Importance of nitrate reduction in benthic carbon mineralization in two eutrophic estuaries Modeling, ob-servations and laboratory experiments. Marine Chemistry, Elsevier, 2018, 199, pp.24-36. �10.1016/j.marchem.2018.01.004�. �hal-01739513�
ACCEPTED MANUSCRIPT
Importance of nitrate reduction in benthic carbon mineralization in
two eutrophic estuaries: modeling, observations and laboratory
experiments
Khalil K.1,*, A. M. Laverman2, M. Raimonet3, C. Rabouille4
1
Université Cadi Ayyad/Ecole Supérieure de Technologie d'Essaouira, Km 9, Route d'Agadir, BP. 383, Essaouira Aljadida, Morocco
2
Ecobio, UMR 6553, Université de Rennes 1, Campus de Beaulieu, 263 avenue du Général Leclerc, 35042 Rennes Cedex, France
3
Sorbonne Universités, UPMC, Univ Paris 06, CNRS, EPHE, IPSL, UMR 7619 Metis, 4 place Jussieu, 75252 Paris cedex 05, France
4Laboratoire des Sciences du Climat et de l’Environnement, Laboratoire mixte CNRS-CEA, Av. de la Terrasse, 91190 Gif sur Yvette, France
ACCEPTED MANUSCRIPT
Abstract
Estuaries are important nutrient filters between rivers and coastal zones. However, the quantification of the nutrient mitigation capacity related to benthic diagenesis is still poorly quantified.
In this paper, we investigated carbon mineralization and the contribution of benthic nitrate reduction in two macrotidal eutrophic estuaries (Elorn and Aulne, Brittany, France) during winter and spring. These anthropized estuaries exhibited large variations of bottom water nitrate concentrations from very high values in upstream waters (up to 500 µM) to low values downstream (less than 10 µM). Bottom water oxygen concentrations presented small gradients compared to nitrate concentrations gradients resulting in large variation in nitrate to oxygen ratios NOx-/O2 between
downstream and upstream (0.03-1.6).
We combined the use of diagenesis modeling with field data (porosity, organic carbon and nitrogen, pore water profiles of dissolved oxygen, nitrogen, iron, manganese and sulfide concentrations, published in Khalil et al. 2013) and experimentally-determined nitrate reduction rates, in order to investigate the different organic carbon mineralization pathways in these estuarine sediments including denitrification and the contribution of benthic nitrate reduction to the estuarine N budget. Overall a good agreement between pore water data (organic carbon, oxygen, nitrate and ammonium) and model simulations was observed. The modeled organic matter mineralization rates were high in the upstream estuary and low in the saline estuary for the two estuaries Aulne and Elorn. This decrease may be related to the dilution and the trapping of allochtonous organic matter in estuarine sediments and its subsequent recycling in the upper estuary. Organic carbon mineralization rates were higher in the Elorn than in the Aulne estuary, which is most likely related to the labile character of the organic matter from urban origin exported from the Elorn watershed.
The contribution of nitrate reduction to the total mineralization was generally high in upstream sediments (15-35%) of both Aulne and Elorn estuaries and decreased consistently downstream to 5-10%. The relative large contribution of nitrate reduction to organic matter degradation was to a large extent related to high bottom water nitrate concentrations that fueled 37-78% of total nitrate reduction in the upstream part of the estuaries.
ACCEPTED MANUSCRIPT
Overall, the reduction of bottom water nitrate by denitrification to N2 represented
3-13% of the river flux of nitrate in these estuaries in winter and spring, and could reach ~50% during summer. These results highlight that nitrate reduction in the sediment attenuate the high river nitrate flux, despite the huge quantities of anthropogenic nitrate discharged by the two rivers to the estuaries.
Keywords:
Sediment; estuaries; nitrogen; oxygen; carbon; nitrate reduction; modeling; mineralizationACCEPTED MANUSCRIPT
1. Introduction
As human activities have influenced global biogeochemical cycling of carbon, nitrogen and phosphorus with important environmental consequences, the need for understanding the behavior of these elements in the natural environment has fueled a constant research interest over the last decades (NRC, 2000; Howarth et al., 2011). The production and use of fertilizer and the growth of livestock breeding have drastically increased the amount of reactive nitrogen in the biosphere and have led to large release of nitrogen in the land-ocean continuum, unbalanced nutrient ratios relative to phosphorus and silica, and associated coastal eutrophication symptoms (Billen and Garnier, 2007; Cloern, 2001; Nixon et al., 1996; Rockström et al., 2009; Howarth et al., 2011). In Northern Europe, France, and particularly Brittany, intensive livestock has resulted in important nitrogen input via groundwater and river water to the coastal zone (Aurousseau, 2013) associated with major eutrophication events such as extended green tides (Billen et al. 2011; Gravier et al. 2012).
In shallow aquatic systems, sediments play a key role in biogeochemical cycles, especially for oxygen sensitive processes such as denitrification which is an anoxic process related to organic matter diagenesis. Denitrification is the reduction of nitrate, via nitrite (NO2-) and nitrous oxide (N2O) to nitrogen gas (N2) in the absence of
oxygen (Zumft, 1997).
Since the early review of Seitzinger (1988), the prominent role of denitrification in nitrogen cycling in shallow marine and freshwater ecosystems has been a constant research interest (Howarth et al., 2011 and references therein). It has been shown that a large share of denitrified nitrogen is linked to particulate organic nitrogen ammonification and its nitrification (Seitzinger, 1988), thus linking denitrification to organic matter deposition and mineralization. Furthermore, the consumption of oxygen linked to organic matter mineralization within millimeters in sediments, generating anoxia, and consequently creating favorable conditions for anaerobic denitrification (Dedieu et al., 2007) is a key control on denitrification in shallow water bodies such as estuaries or near shore coastal ocean. River catchments and estuaries are important nutrient filters due to biogeochemical transformations occurring in the water column and in the sediment. It has been shown that 40-60% of
ACCEPTED MANUSCRIPT
the nitrogen input is denitrified within the estuaries thus mitigating the nitrogen load discharged to the coastal zone (e.g. Billen et al., 1991).
In estuarine sediments, different bacterial processes contribute to the cycling of nitrogen in close association with the carbon cycle (Billen, 1982; Canavan et al., 2006; Dedieu et al., 2007; Giblin et al., 2013). In the oxygenated part of the sediment, ammonium is converted to nitrite and nitrate by nitrifying microorganisms. In the anoxic part, nitrate is mainly transformed to nitrogen gas by denitrification, a microbially-mediated process, which is the ultimate process in transforming inorganic nitrogen to its inert gaseous form (Billen, 1982). Other processes capable of reducing nitrate, under anoxic conditions, are dissimilatory nitrate reduction to ammonium (DNRA, Bernard et al. 2015; Den Berg et al., 2016; Burgin and Hamilton, 2007) or anaerobic ammonia oxidation (anammox, De Graaf et al., 1995, Dalsgaard et al., 2005). Anammox reduces nitrite and oxidizes ammonium to N2 gas without utilizing
organic carbon. The succession of nitrification and nitrate reduction is intrinsically linked to the oxic-anoxic boundary, which is controlled by organic carbon processing and re-oxidation of reduced substances (e.g. H2S, Fe2+). Bio-irrigation in burrows
allows for coupled nitrification-denitrification/nitrate reduction as it tightly connects oxic burrow water and wall to surrounding anoxic sediments, which favors these two processes and their interaction (Howarth et al., 2011). In addition to this nitrate turnover, nitrogen concentrations in the water column may influence nitrate reduction intensity as indicated by a correlation between nitrogen inputs to estuaries and nitrate reduction rates (Seitzinger, 1988). The amount of nitrogen discharged to the coastal zone through estuaries depends also on the residence time of the river and the nitrate reducing capacity of the benthic compartment (Nixon et al., 1996).
Despite these large scale correlations, the detailed interactions between processes and the environmental constraints on overall nitrate reduction are still poorly known. In order to evaluate how nitrogen retention and loss via the benthic compartment may evolve in the future, new approaches coupling pore water nutrient profiles and sediment characteristics, rate measurements and models are needed to evaluate mineralization and nitrate reduction rates in aquatic continuums, and particularly along estuaries. Nitrogen fluxes at the sediment-water interface are the result of nitrogen cycling within the sediments relying on coupled microbial processes, the supply, transformation and transport of dissolved nitrogen species, oxygen as well as carbon. In such a complex network of processes, diagenetic
ACCEPTED MANUSCRIPT
models are the ideal tool to disentangle the different processes constraining the contribution of nitrate reduction to carbon mineralization and nitrate removal to N2 in
estuarine sediments (Vanderborght et al., 1977; Billen, 1982; Soetaert et al., 1996; Canavan et al., 2006; Dedieu et al., 2007).
In this study, we investigated carbon mineralization and the contribution of benthic nitrate reduction to this carbon mineralization in two impaired estuaries (Elorn, Aulne) in Brittany, France. The two estuaries exhibit large gradients of nitrate concentrations: high values of NOx are found in upstream waters (up to 500 µM) and
low values downstream (down to 10 µM), with limited O2 changes due to large
ventilation and mixing of the estuarine waters resulting in large variation in nitrate to oxygen ratios (NOx-/O2). We hypothesized that these differences in nitrate
concentrations may have an impact on the contribution of benthic nitrate reduction to organic matter recycling, and consequently on the different organic carbon mineralization pathways in these estuarine sediments. Therefore, we evaluated the capacity of the estuarine sediments in processing organic carbon and nitrate, in order to get a better insight in the nitrogen losses and the contribution of the different diagenetic pathways (oxic mineralization, nitrate reduction and anoxic mineralization) to organic carbon mineralization in the benthic compartment. To this end, we coupled the use of an early diagenesis model, field measured vertical pore water compounds (O2, NOx-, NH4+, Fe2+, Mn2+), solid phase Org-C and experimentally determined
nitrate reduction rates. Along the two estuaries, this approach allowed determining (1) the relative contributions of different benthic mineralization pathways to sediment organic matter recycling, with special emphasis on denitrification, as well as (2) benthic denitrification rates and estuarine capacity of nitrate removal depending on nitrate concentrations and NOx-/O2 ratios.
2. Materials and methods
2.1. Study sites and sampling
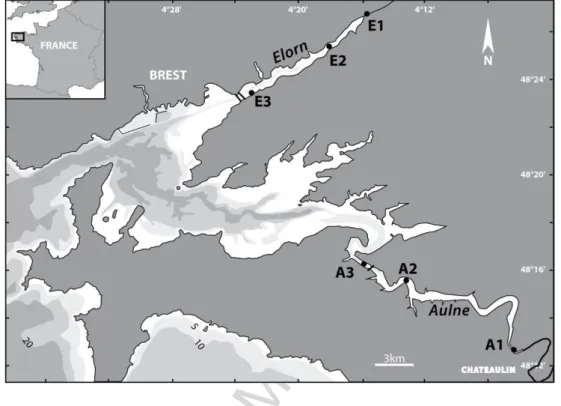
The two studied estuaries are located at the interface between the rivers Elorn and Aulne and the Bay of Brest in Northwestern France (Fig. 1). The two rivers are
ACCEPTED MANUSCRIPT
rich in nutrients, in particular nitrate due to intensive agricultural activity in the upstream watersheds (Del Amo, 1996; Ragueneau et al., 2002). The Elorn watershed is impacted by a higher population density (280 km², 285000 habitants) than the Aulne watershed (1822 km², 70000 habitants). Both watersheds are influenced by a temperate oceanic climate: high precipitation associated with frequent storms and seasonal fluctuations of river discharge from winter (42 and 189 m3 s-1 in 2009) to summer (1.0 and 1.7 m3 s-1 in 2009) in Elorn and Aulne rivers, respectively. The two estuaries have different shapes. The Elorn estuary is approximately 15 km long, straight and directly exposed to marine hydrodynamic influence; the Aulne estuary is 35 km long, meandering and protected from marine influence by the Bay of Brest (Fig. 1).
Sediment cores were sampled at three locations along the Elorn and Aulne estuaries in February and May 2009. The three locations were upstream (stations E1 and A1), midstream (E2 and A2) and downstream (E3 and A3) in the Elorn and Aulne estuaries, respectively (Fig. 1). Samples were collected in subtidal shores - between the channel and the border - at mid-tide. For further details regarding sampling see Raimonet et al. (2013b).
The sediment cores were collected from a semi-rigid boat with a gravity corer (UWITEC®) and brought back to the main research ship (maximum 1 hour). Sediment cores were processed within 4 hours. One core was used for oxygen profiling, a second core for the measurements of porosity and pore water nutrient concentrations, and a third core was used to sample sediment for potential nitrate reduction rate determination using flow-through reactors. This last core was kept at +4°C until the start of the reactor experiments.
2.2. Sediment and pore water chemistry
All pore water data and methods are detailed in Khalil et al. (2013). Therefore, we only provide a brief review in this paragraph.
Pore water oxygen profiles were determined by Clark type oxygen microsensors with a built-in reference and an internal guard cathode (Revsbech, 1989, Unisense, Arhus, DK). Sediment porosity was determined on 0.5 cm intervals in the first 2 cm, at 1 cm intervals for 2-4 cm, at 2 cm intervals for 4-12 cm, and at 4 cm intervals for
ACCEPTED MANUSCRIPT
12-20 cm (Raimonet et al., 2013a). Pore water was extracted from the same sediment sections as applied for porosity according to Andrieux-Loyer et al. (2008).
Concentrations of nitrate+nitrite (NOx- in Khalil et al., 2013) and ammonium were
analyzed using segmented flow analysis (SFA; Aminot et al., 2009). Fe2+ was measured with the ferrozine method (Sarradin et al., 2005) and Mn2+ with the leuco-malachite green method (Resing and Mottl, 1992), both adapted for SFA. The precision of the analyses was 0.5%.
The total nitrogen and organic carbon contents were measured in triplicates in surficial sediments at all stations and seasons. We used an automatic Carlo Erba NA1500 analyzer, after removal of the carbonate fraction by dissolution in HCl 1.2N. Total nitrogen and organic carbon concentrations were expressed as the percentage of sediment dry weight (% d.w.).
2.3. Potential nitrate reduction rates
Potential nitrate reduction rates were determined on 1 cm thick sediment slices using flow-through reactors. Sediment from the top 1 cm was placed in 1 cm high persplex rings, capped at the top and bottom with a 0.2 µm pore size PVDF (Durapore) membrane filter, a glass fiber filter of 1.2 mm thick (PALL Corp., NY) and an O-ring to prevent leaking (for more details, see Laverman et al. (2006, 2012)). The reactors were supplied with anoxic saline water (adapted to the onsite salinity as described in Laverman et al 2012) containing 5 mM of NaNO3 at a flow rate of 5 ml h -1
with a peristalic pump (minipuls evolution, Gilson, France) and incubated at a constant temperature (+20°C). Anoxic solutions were prepared as described in Laverman et al. 2012. The outflow of the reactor was sampled every 3 hours and kept at +4°C until analysis of nitrate, nitrite and ammonium. Samples from the input solution were also collected and analysed for the exact nitrate concentrations. The different dissolved nitrogen species were measured colorimetrically using an autoanalyser (Quaatro, Bran & Luebbe).
Reactors were run for approximately 48 hours, allowing determination of nitrate consumption using the in situ available carbon present in the sediment without changing the microbial community structure and abundance. This time frame allowed nitrate output concentrations to reach relatively constant values. Potential nitrate reduction rates were consequently calculated by determining the difference between
ACCEPTED MANUSCRIPT
nitrate concentrations in the input and output solutions, which corresponds to the nitrate reduced by the nitrate reducing bacteria in the incubated sediment. The amount of nitrate reduced was then multiplied by the imposed flow rate (Q) and normalised to the sediment volume present in the reactor. The resulting rates are expressed in nmol NO3- per cm3 wet sediment per hour.
The potential nitrate reduction rates obtained previously at laboratory temperature (+20°C) were corrected using in situ temperature at each station and season. The values were recalculated for a standard temperature of +10°C. A temperature coefficient Q10 was applied to the potential nitrate reduction rates. The Q10 represents
the factor by which the bacterial activity increases for a rise of +10°C of the temperature (Thamdrup et al. 1998) and a Q10 value of 2.5 was used (Laverman et
al., 2006). The potential nitrate reduction rates at a given temperature T was obtained from the Arrhenius relation:
( )
Where is the potential nitrate reduction rate at laboratory temperature Ti. A similar treatment was performed with the total mineralization rates
to be recalculated at a same temperature (+10°C).
2.4. Model description
A steady state version of the numerical 1-dimensional diagenetic model OMEXDIA (Soetaert et al., 1996) was used, as implemented in the open source software R (Soetaert and Herman, 2009). This model has 6 state variables: FastC, SlowC, O2, NOx-, NH4+ and ODU which correspond to labile OC, semi-labile OC,
oxygen, nitrate+nitrite, ammonium, and oxygen demand units (ODU see below), respectively. In the present model, we included the non-local bioirrigation for all pore water solutes by adding this term ( ) ( - )(Boudreau, 1997) where is the depth-profile irrigation rate, and are the bottom water and depth solute concentrations (mmol m-3), respectively. Solutes are transported by molecular diffusion and irrigation, whereas solid phase compounds are transported by advection and bioturbation.
ACCEPTED MANUSCRIPT
This model takes into account depth-dependent porosity as: ( ) ( ⁄ )
where is the porosity at depth x, is the surface porosity, is the deep porosity and is the porosity coefficient (cm).
Bioturbation is also depth-dependent. It is set at a constant value in a layer with thickness and declines rapidly below.
Thus, for b
for b ( ) ⁄
where is the bioturbation rate (cm2 d-1) at depth x, b is the surface bioturbation, is the mixing layer (cm) and is the bioturbation coefficient (cm).
The distribution of the bioirrigation is described as:
for
for ( ) ⁄
where is the irrigation rate (cm2 d-1) at depth x (d-1), is the surface irrigation
rate, is the irrigation depth (cm) and the irrigation coefficient (cm).
The OMEXDIA model explicitly describes oxic mineralization, suboxic nitrate reduction, and lumped anoxic mineralization which includes manganese, iron and sulfate reduction. It also includes nitrification and the re-oxidation by oxygen of reduced anoxic mineralization products (Table 1). Note that nitrate reduction is represented in the model as denitrification, nitrate reduction to N2. Dissimilatory
nitrate reduction to ammonium (DNRA) was not included in the model because the nitrate reduction experiments showed little ammonium production with most ratio of ammonium production/nitrate reduction below 0.1 and occasional maximal values of 0.4, (see Laverman et al., 2006 for details) suggesting that DNRA is generally low in these sediments. Furthermore, massive DNRA would create a large peak of NH4+ in
the first centimetre of the sediment (see Canavan et al., 2007) which was not observed on the ammonium profile. Anaerobic ammonium oxidation (anammox) is not represented either in the model because it was shown to contribute by only 5-15% to nitrogen removal in eutrophic coastal systems such as estuaries and wetlands (Trimmer et al., 2003; Dale et al., 2009; Naeher et al., 2015; Hou et al., 2015).
ACCEPTED MANUSCRIPT
Organic carbon is modeled as two degradable fractions characterized by different C/N ratios and first-order degradation rates (labile and more refractory) to account for the decreasing C/N ratio and reactivity of the organic matter with depth into the sediment, respectively. All reactive carbon that settles on the sediment surface is mineralized, and a third fraction of inert carbon is considered (Soetaert et al., 1996) which is refractory carbon Crefrac (Table 3).
The consumption of oxygen and nitrate as terminal electron acceptors is explicitly modeled, and mineralization is limited by both carbon (first order kinetics) and oxidant availability (Michaelis-Menten type kinetics). Mineralization process using others oxidants (manganese oxides, iron oxides, sulfate) are lumped into one process (Soetaert et al., 1996) which generates ODU as a reduced by-product. ODU represents the Oxygen Demand Units, i.e. the amount of O2 necessary to reoxidize
reduced counter parts from anaerobic mineralization i.e. ODU= 0.25 Fe2+ + 0.5 Mn2+ + 2 H2S. Anoxic mineralization of one mole of carbon produces one mole of an
apparent ODU (Table 1; Eq. 1.4). Re-oxidation of one mole of ODU requires one mole of oxygen (Table 1; Eq. 1.5).
A fraction of the reduced substances that are produced through anoxic mineralization is permanently lost from the system. In this study, the ODU deposition is a function of ODU produced in the system:
where is the depth profile ODU deposition (mmol m-3 d-1), is an
adjusted parameter corresponding to ODU deposition rate (d-1).
2.5. Model parameters
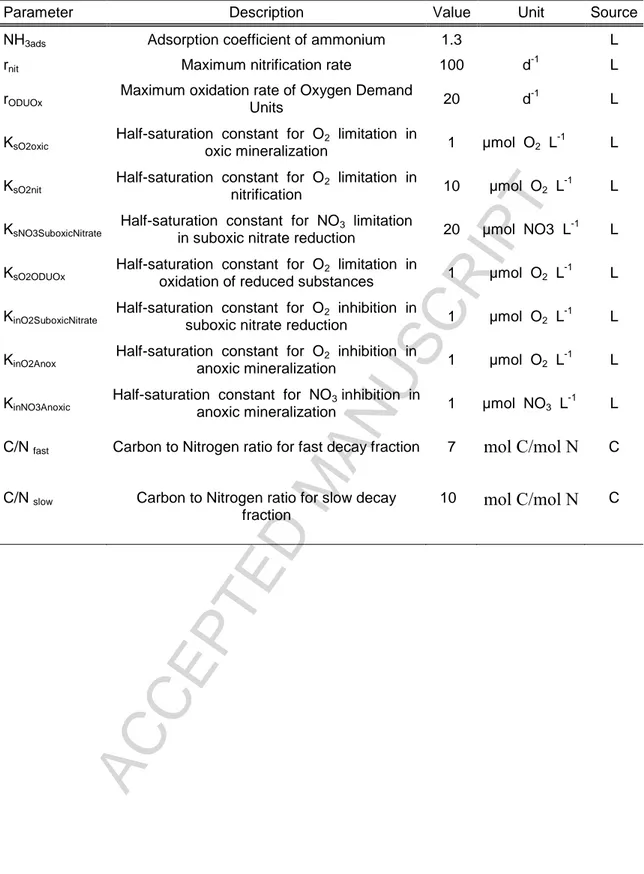
A list of parameters based on the literature is provided in Table 2. These fixed parameters include the ammonium adsorption coefficient, maximum oxidation and nitrification rate constants, half-saturation constants for O2 limitation for oxic
mineralization and nitrification, nitrate limitation for nitrate reduction, O2 limitation for
the oxidation of reduced substances, O2 inhibition for nitrate reduction and anoxic
mineralization, nitrateinhibition for anoxic mineralization and finally, the C/N ratio for fast and slow decay fraction determined from laboratory analyses of sediments.
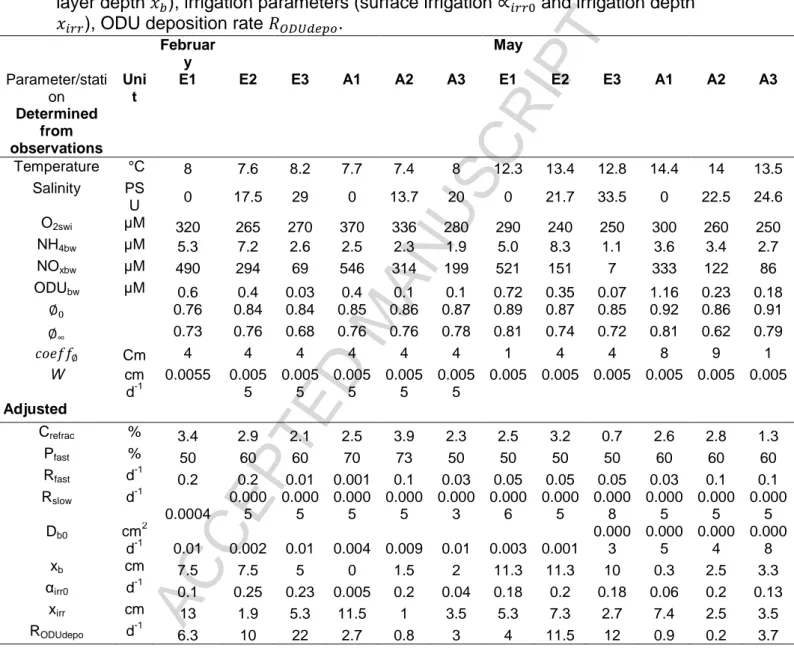
The station-dependent boundary conditions and parameters used in the model are described in Table 3. Boundary conditions and parameters obtained from
ACCEPTED MANUSCRIPT
measurements are temperature, salinity, sediment-water interface oxygen concentration O2swi, bottom water concentrations of nitrate+nitrite (NOxbw), ammonium
(NH4bw) and ODU (ODUbw), porosity parameters (surface , deep and coefficient
) and sedimentation rate w. Note that porosity and sedimentation parameters were obtained by fitting porosity and radionuclides profiles (data not shown), respectively. The diffusivity coefficients of dissolved substances were calculated according to Boudreau (1986) and corrected for salinity and temperature (Li and Gregory, 1974).
The boundary fluxes and adjusted parameters are: refractory carbon fraction Crefrac, organic carbon flux OCflux, part of sedimenting carbon that is fast decaying Pfast,
mineralization rate constants of labile carbon Rfast and intermediate carbon Rslow,
bioturbation parameters (surface bioturbation b , mixing layer depth ), irrigation
parameters (surface irrigation and irrigation depth ), ODU deposition rate .
2.6. Model output
The model outputs were compared to the pore water and solid profiles (Khalil et al., 2013) collected at Elorn and Aulne stations from downstream to upstream during two seasons (February and May 2009). Model profiles were fitted to the measured organic carbon, oxygen, nitrate+nitrite, ammonium and ODU profiles. For the ODU calculation, H2S was neglected because of the overall low values encountered in
these sediments. Generally, H2S was below 10 µM (Khalil et al. 2013) with
occasional concentration between 10 and 40 µM.
The total carbon oxidation rates, the relative contribution of the major pathways of organic matter mineralization (oxic, suboxic nitrate reduction, and anoxic), and oxygen utilization, were then calculated.
In order to compare measured and modeled potential nitrate reduction rates, we calculated the integrated potential nitrate reduction rate using the model. First, we calculated the depth profile of carbon mineralization rate (mmol m-3 d-1) using the following equation:
ACCEPTED MANUSCRIPT
where and are depth profiles carbon concentrations in the sediment (mmol m-3) for labile and intermediate fraction, respectively.
We then integrated it over the first centimeter, which is the layer thickness of the incubated layer. In order to mimic the incubation experiments, (i) we attributed all carbon mineralization to nitrate reduction in this first centimeter thus removing aerobic mineralization as is done in anoxic incubation and (ii) we removed any limitation by nitrate to mimic nitrate saturation concentration that were used in the slice incubations. The integrated carbon mineralization was then multiplied by the stoichiometry coefficient 0.8 corresponding to the ratio between nitrate consumption and carbon mineralization, in order to obtain modeled potential nitrate reduction rates which can be compared to the measured ones.
∫
where is the potential nitrate reduction rate from the model (mmol m-3) and L = 1 cm.
, and depth profiles (mmol m-3
d-1), which are the organic matter mineralization rates by different oxic, nitrate reduction and anoxic pathways, respectively, were calculated in the model as:
where: ⁄( ) [ ⁄( )] [ ⁄( )] [ ( ) ⁄ ] [ ( ) ⁄ ] ( ⁄ )
Total mineralization (mmol m-2 d-1) was calculated using the model as the sum of total oxic mineralization , total nitrate reduction and
ACCEPTED MANUSCRIPT
and are the integrated values of , and .
2.7. Estimation of the estuarine filtering capacity for nitrate
In order to calculate the estuarine filtering capacity for nitrate, we calculated the estuarine sediment surface area using a GIS-based approach (QGIS® software) in which we divided the estuary in three polygons from station 1 at salinity 0 to downstream of station 3 at the estuarine opening to the bay. The limits between the polygons were located at mid-distance between stations. The surfaces were calculated at average mid-tide. We then multiplied the surface area of each of the three zones for each estuary (upstream, midstream and downstream) by the specific nitrate removal flux for each zone multiplied by the fraction of nitrate originating from the water column as calculated by the model, and compared it to the nitrate discharge for the two rivers.
3. Results
3.1. Boundary conditions and fixed parameters in the diagenetic model
The boundary conditions and parameters used in the model are detailed in Table 3. Bottom water temperatures followed a seasonal pattern. They ranged between 7.4 °C (station A2) and 8.2 °C (station E3) in February and between 12.3 °C (station E1) and 14.4 °C (station A1) in May. O2 concentrations at the sediment-water interface
O2swi decreased from inner to mid-estuaries during the two seasons, but low
variations were observed in the outer estuaries, except in the Aulne estuary in February. The bottom water NH4+ concentrations (NH4bw) were low for all stations and
seasons. The bottom water NOx- concentrations (NOxbw) were typical of highly
eutrophic waters and higher in the inner and mid stations (up to 500 µM) than in the outer estuaries. Note that in this eutrophic context, nitrite were negligible compared to nitrate. The bottom water ODU concentrations (ODUbw) were low for all stations and
ACCEPTED MANUSCRIPT
2 cm yr-1). The C/N ratios for fast and slow reactive organic carbon fraction in the sediments were 7 and 10, respectively (Table 2).
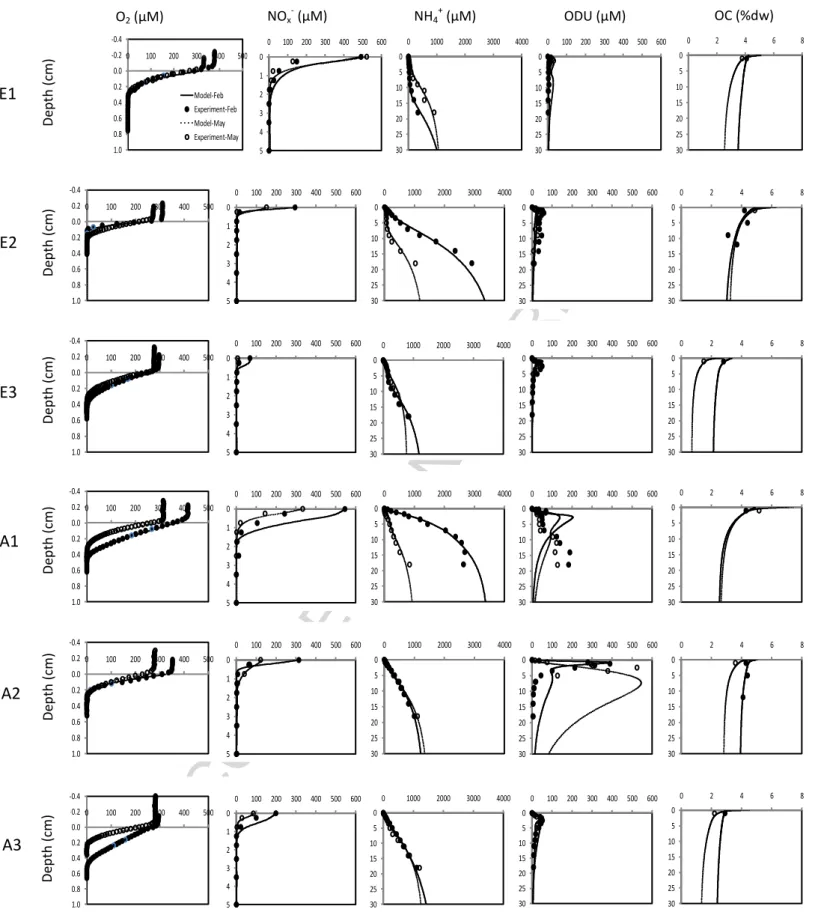
3.2. Modeled and measured pore water profiles
The results of the measured (see Khalil et al. (2013) for more details) and modeled pore water profiles of total organic carbon, oxygen, nitrate+nitrite, ammonium and ODU concentrations and OC contents are shown for the 3 stations along the Elorn and Aulne estuaries (Fig. 2). A sharp decrease of O2 profiles with
depth was observed at all stations. The modeled and measured O2 profiles were in
good agreement and showed an O2 penetration of 3-4.5 mm in upstream sediments,
with the lowest O2 penetration observed in midstream sediments of both estuaries.
Pore water NOx- concentrations decreased rapidly over the first centimeter of the
sediment. This decrease was well represented by the model at all stations with a sharper decrease in the data compared to the simulations at upstream stations in February. The increase with depth of pore water NH4+ concentrations was well
represented at all stations i.e. high ammonium concentrations in the midstream sediments of the Elorn estuary as well as in the upstream Aulne sediments in February (~ 3000 µM), in downstream Elorn, midstream and downstream Aulne in February (1000 µM) and more homogeneous ammonium concentrations at depth in May. The ODU peak observed near the sediment-water interface and the sharp decrease in deeper sediments were generally reproduced by the model. However, the comparison between model and data for ODU often showed an offset at depth. Organic carbon (OC) contents varied from 1.5 to 5% in the two estuaries, with the highest content midstream. Relatively low values (<3%) were present in downstream sediments. The modeled values showed a decrease of OC with depth at all sites.
3.3. Adjusted parameters in the model
The adjusted parameters are detailed in Table 3. The organic carbon fluxes (OCflux) were higher in Elorn compared to Aulne estuary and varied between 23 and
98 mmol m-2 d-1. Overall, these fluxes showed a general decrease from high values upstream to lower values in the lower estuaries. The proportion of the most labile fraction PFast ranged between 50% and 73%. The labile carbon mineralization
ACCEPTED MANUSCRIPT
constants Rfast showed large variations between stations, ranging from 0.001 d-1 (A1
in February) to 0.2 d-1 (E1 in February). This pattern was not observed for the less reactive fraction Rslow, with no clear spatial pattern and low variability (3 10-4 to 7.5 10 -4
d-1). The refractory carbon Crefrac varied slightly between stations, from 0.7% at E3
in May to 3.9% at A2 in February. The bioturbation b showed large variations from
0.0003 cm2 d-1 (station E3 in May) to 0.01 cm2 d-1 (stations E1, E3 and A3 in February). Mixing layer depths were lower in Aulne (average of 1.6 cm) than Elorn estuary (average of 8.8 cm). The bioirrigation rates were higher in Elorn than Aulne estuary, except for A2 (0.2 d-1). This difference was more visible in February (0.19 d-1 for Elorn and 0.08 d-1 for Aulne) than in May (0.19 d-1 for Elorn and 0.13 d-1 for Aulne). The irrigation depths varied between stations, from 1 cm at A2 to 13 cm at E1 in February. ODU deposition rates ODUdepo were generally larger in Elorn
(12.8 d-1 in February and 9.2 d-1 in May) than in Aulne estuary (2.2 d-1 in February and 1.6 d-1 in May).
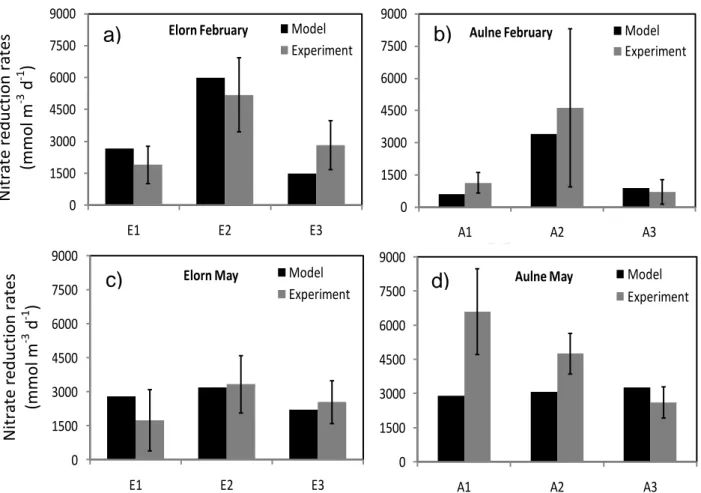
3.4. Nitrate reduction rates
Figure 3 shows the nitrate reduction rates at Elorn and Aulne stations in February and May. Overall modeled and experimental nitrate reduction rates were in good agreement. Maximal rates were observed at midstream stations in February, up to 6000 mmol m-3 d-1 at station E2 (modeled) or to 8000 mmol m-3 d-1 at station A2 (measured) (Fig. 3a, b). In May, rates were similar along the whole Elorn estuary given the large uncertainty (1500-3000 mmol m-3 d-1) which was reproduced by the model. In the Aulne estuary, measured rates decreased from upstream to downstream (from 8000 to 3000 mmol m-3 d-1) whereas modeled rates were constant around 3000 mmol m-3 d-1 for the three stations (Fig. 3c, d).
3.5. Total mineralization and contribution of the different metabolic pathways
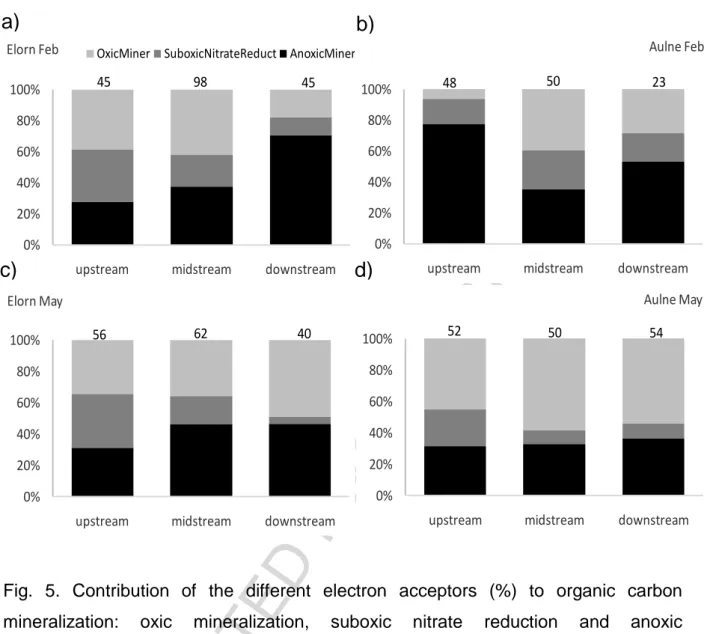
Model predictions of the relative contribution of the different processes, i.e. oxic mineralization, suboxic nitrate reduction, and anoxic mineralization, are detailed in Table 4.
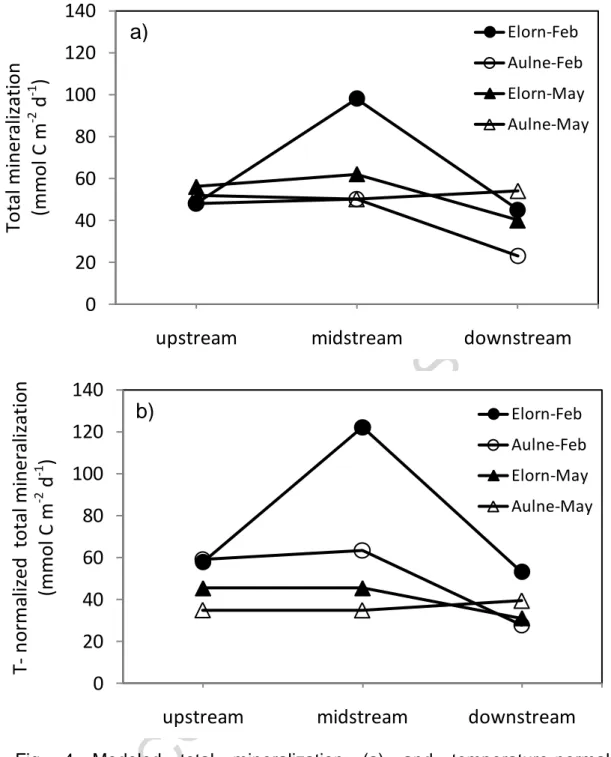
Total mineralization rates were larger in the Elorn compared to the Aulne estuary, regardless of the season, the rates were similar or higher in February than those in
ACCEPTED MANUSCRIPT
May (Fig. 4a; Table 4). The rates showed generally little variation between upstream and midstream (salinity 0 and 15-20) with lower values downstream in saline waters (salinity 30-35). When the integrated mineralization rates were normalized to a common temperature (Fig. 4b), mineralization rates were clearly higher in February than in May in both estuaries.
Oxic and anoxic mineralization represented together an average of 70-80% of total mineralization, and nitrate reduction accounted for the remaining 20-30% of the total mineralization (Fig. 5). The contribution of oxic mineralization compared to anoxic degradation was generally larger in upstream sediments (Fig. 5). In the Elorn estuary, the proportion of anoxic mineralization in sediments increased from upstream to downstream from 30 to >50% along with a decrease in nitrate reduction (Fig. 5a, c). In the Aulne estuary, the situation was more complex; nitrate reduction decreased from upstream to downstream in May (as in the Elorn estuary), while no spatial trend was observed in February (Fig. 5b, d). An increase in anoxic mineralization in May along the Aulne estuary (Fig. 5d) was less obvious than in the Elorn estuary (Fig. 5c). In February, the same trend was observed for Elorn estuary (Fig. 5a) with a contrasted situation at Aulne estuary where the upstream station showed a very large contribution of anoxic mineralization (80%; Fig. 5b).
4. Discussion
4.1. Model parameters
The organic matter deposits in Elorn and Aulne estuaries were larger than coastal or freshwater environments and displayed values characteristic of eutrophic or high discharge deltaic environments. Indeed, the organic carbon fluxes OCflux in
the present study (23-98 mmol m-2 d-1) were in the range of values from the Rhone River prodelta (7-150 mmol m-2 d-1; Pastor et al., 2011) or the eutrophic Thau lagoon (55 mmol m-2 d-1; Dedieu et al., 2007). These values were however higher than the range of values (2-29 mmol C m-2 d-1) found in the sea Loch Creran (Brigolin et al., 2009), the freshwater Haringvliet and Zug lakes (Canavan et al., 2006; Maerki et al., 2009) or the Saint Lawrence estuary (Katsev et al., 2007).
ACCEPTED MANUSCRIPT
The degradable organic carbon deposited at the sediment surface is composed of a range of organic matter reactivity (Wakeham et al., 1997). The OMEXDIA model represented two reactive fractions: a labile fraction and an intermediate reactivity fraction (Soetaert et al., 1996). The two fractions are represented by a first-order degradation constant which is characteristic of their reactivity. The range of labile organic carbon degradation constants obtained in this study Rfast (0.001–0.2 d-1)
covered the high value of 0.1 d-1 reported in Dedieu et al. (2007) and Pastor et al. (2011) in eutrophic environments, the intermediate values of 0.04-0.07 d-1 in freshwater environments (Canavan et al., 2007) and the low values of 0.002-0.003 d-1 in coastal environments (Katsev et al., 2007; Brigolin et al., 2009). The δ13C measurements in our previous study (Khalil et al., 2013) showed that the organic matter had different origins in the two watersheds. The highest labile organic carbon degradation rates in the Elorn estuary in February may be explained by the input of labile organic matter from inland human activities (urban sewage, animal farming). The Aulne aquatic system displayed a larger primary production in the river and estuary than the Elorn aquatic system (Fraisse et al., 2013; Labry et al., 2016). This organic matter can be either mineralized in the water column or transferred to the middle estuary before being mineralized in surface sediments, thus leading to higher values of labile carbon mineralization constants Rfast in the Aulne mid-stream estuary.
A high increase in δ13C values was visible in the two estuaries from upstream to downstream, indicating a progressive mixing of terrestrial and marine organic matter.
Along the two estuaries, the less reactive organic matter degradation constants Rslow (0.0003-0.0008 d-1) were close to those estimated in other coastal studies
(0.0003 d-1; Tromp et al., 1995; Brigolin et al., 2009). Nevertheless, other environments showed ten times lower values in freshwater lake (0.00003 d-1; Canavan et al., 2007) and ten times higher values in eutrophic environments (0.001 d-1; Dedieu et al., 2007 and Pastor et al., 2011). The proportions of labile fraction Pfast
(50-73%) were in the range of values found in previous studies (66-73%; Canavan et al., 2006; Pastor et al., 2011).
Surface bioturbation rates b (0.0003-0.01 cm2 d-1) were in the range of values
found in freshwater, coastal and eutrophic environments e.g. 0.005 cm2 d-1 (Dedieu et al., 2007), 0.014-0.015 cm2 d-1 (Katsev et al., 2007; Canavan et al., 2007; Pastor et al., 2011) and 0.021 cm2 d-1 from Soetaert et al. (1996). The bioirrigation rates (0.005-0.25 d-1) covered the range of values found in previous studies e.g. 0.01-0.05
ACCEPTED MANUSCRIPT
d-1 (Emerson et al., 1984; Canavan et al., 2007), 0.07-0.24 d-1 (Raimonet et al., 2015), and in the lower range of values (0.1-9.6 d-1) determined by inverse modelling (Meile et al., 2001).
4.2. Carbon mineralization and metabolic pathways in estuarine sediments
4.2.1. Integrated carbon mineralization
We investigated two estuaries with different characteristics in terms of organic carbon origin and recycling (from isotopes and benthic oxygen demand measurements, Khalil et al., 2013) during two different seasons (winter and spring) and estimated the integrated organic carbon mineralization using diagenetic modeling. As reported in section 4.1, integrated benthic mineralization rates were in the higher range of coastal and freshwater environments, and closer to eutrophic and high discharge deltaic environments.
Overall, the organic matter mineralization rates in the two estuaries showed a downstream decrease with high values in freshwater sediments and lower values in the saline estuary (Fig. 4a). This decrease may be related to the trapping and recycling of allochthonous organic matter in upstream estuarine sediments, as well as to the dilution and organic matter recycling during its transport from the upper to the lower estuary. It has been shown that most of the organic matter in these upstream sediments was from terrigenous origin (Khalil et al., 2013) which indicated the import of organic matter from erosion and river transport to the estuary. The highest organic carbon mineralization rates in the Elorn than in the Aulne estuary was in agreement with oxygen flux data from our previous study (Khalil et al., 2013), but was more visible in this study based on diagenetic modeling. The highest organic carbon mineralization rates in the Elorn estuary were most likely related to the contribution of more labile organic matter imported from the watershed. Indeed, stable isotope analysis of organic matter indicated that Elorn sediments were supplied with organic matter partly originating from sewage (Khalil et al., 2013).
When mineralization rates were corrected for temperature which varied from 8°C in February to 13-14°C in May, a clear difference between the two seasons was visible with higher T-corrected mineralization rates in February than in May (Fig. 4b). After correction of the rates for temperature, the only constraining factor for organic matter mineralization rate was the organic matter quality/quantity since the mix of
ACCEPTED MANUSCRIPT
available oxidant concentrations (O2, NO3-, …) was not drastically altered during the
different seasons. Higher T-corrected minearalization rates in February compared to May suggested a larger organic matter source in these estuaries during winter. In Brittany, which has the most oceanic climate in France, winter is mild and humid with a lot of rainfall and occasional north Atlantic storms, conditions favoring erosion and river export. In this study, the winter sampling followed a storm event (Raimonet et al., 2013b) which may have led to high organic matter export to the estuary in February. Furthermore, as indicated above, most of the organic sediment content in upstream and midstream sediments originated from soil organic matter, with a larger fraction of sewage input in the Elorn estuary. Therefore, it suggests that the larger T-corrected mineralization rates in winter are linked to higher inputs of organic carbon to the sediment in February probably due to larger erosion after storm and rain events. The larger T-corrected mineralization rates in winter compared to spring also indicated a limited role of phytoplankton production in spring in these estuaries, as its deposition could have increased the source of fresh organic matter and generated larger mineralization rates in spring as has been observed in other coastal sediments (Pomeroy et al. 1991, Thamdrup et al. 1998). This is also in agreement with the δ13
C patterns of the sediment organic carbon in the estuaries that showed lower (more negative) values upstream indicating a minor contribution of primary production and heavier values downstream showing a larger contribution of marine planktonic organic matter in the saline part of the estuary (Khalil et al., 2013). It is interesting to note that the downstream station in the Aulne estuary (A3) was the only station where spring mineralization values were larger than winter values, which indicated a potential role of autochtonous production and deposition in spring at the more saline station.
4.2.2. Metabolic pathways
The stations investigated in this study were located along the saline gradient of the Elorn and Aulne estuaries, varying from 0 to 32. This change in salinity was accompanied by a minor change in oxygen concentrations, a marked decrease in nitrate concentrations and a large increase in sulfate concentrations (Table 3 and Khalil et al., 2013). These changing oxidant ratios may consequently impact the different diagenetic pathways with respect to terminal electron acceptors.
ACCEPTED MANUSCRIPT
Oxic mineralization represented a large share of total mineralization in upstream sediments (with the notable exception of station A1 in February). This large fraction of oxic mineralization in freshwaters compared to more saline waters was linked to the lower proportion of anoxic mineralization upstream related to lower sulfate concentration which was, with iron hydroxides, the major oxidant in anoxic mineralization (Khalil et al. 2013). The large proportion of oxic mineralization has already been observed in freshwater lake sediments (Table 4; Canavan et al., 2006; Maerki et al., 2009). The exception of station A1 in February with 80% anoxic mineralization in freshwater sediments was related to low oxygen fluxes and very large ammonium pore water concentrations which indicated high anoxic mineralization (Khalil et al., 2013; Raimonet et al., 2013a). This outlier is most likely related to temporary larger accumulation of organic matter, due to high riverine organic matter inputs before the sampling period and convergence of particles by residuals currents that led to accumulation of fluid muds at the sampling site (Raimonet et al., 2013a).
The contribution of anoxic mineralization showed an increase with salinity for all estuaries and seasons (again excepting station A1 in February). The increase of anoxic mineralization with salinity is also seen in the literature when comparing freshwater and marine datasets. Table 4 compares freshwater settings (Haringvliet and Zug lakes) with estuarine and coastal sediments (Thau lagoon, Rhone river prodelta, Loch Creran, Saint Lawrence estuary), and showed a larger contribution of anoxic mineralization in marine estuarine and coastal sediments (58-80%) than in freshwater sediments (24-47%). In the case of Elorn and Aulne estuaries, this increase can be related to the increase in anoxic oxidant availability (mostly sulfate) related to salinity (Khalil et al., 2013).
There are some exceptions to this overall increase and dominance of anoxic versus oxic mineralization in downstream sediments. In spring, the two high salinity stations (E3 and A3) showed an equal or larger share of oxic mineralization compared to anoxic mineralization. In these marine stations which are, for a large part, fuelled by marine organic matter inputs (Khalil et al., 2013), the relatively lower anoxic mineralization in mid-spring could be due to the late onset and deposition of the phytoplankton bloom, which generally occurred later in May (Lorrain et al., 2000). In winter, however, terrestrial organic matter delivered by the river would allow larger anoxic mineralization by its semi-labile nature.
ACCEPTED MANUSCRIPT
4.3. Denitrification and estuarine filter for nutrients
Estuarine biogeochemical reactors are known as filters for nutrients (Nixon et al., 1996; Cloern, 2001; Laruelle, 2009; Asmala et al., 2017), which, for nitrogen, relies on denitrification in suboxic sediments. In this study, nitrate reduction rates ranged between 2 and 20 mmol m-2 d-1 which is consistent with the highly variable values found in temperate nutrient-rich estuaries (2.5-30.7 mmol m-2 d-1; 35 – 430 mg N m-2 d-1; see Herbert, 1999). The combination of diagenetic modeling and experimental measurements of potential nitrate reduction rates in two macrotidal estuaries at two seasons were useful to go further and describe the spatial and temporal variations of the contribution of nitrate reduction to total mineralization in these transitional zones. Modeled and experimentally determined potential nitrate reduction rates were in good agreement, strengthening the model simulations (Fig. 3).
The contribution of nitrate reduction to the total organic matter mineralization was high in upstream sediments (15-35%) in both Aulne and Elorn estuaries and decreased consistently downstream (Fig. 5) to 5-18%, except in the Aulne estuary in February where it was low in the upper station. The relatively large contribution of nitrate reduction to organic matter degradation was to a large extent related to high bottom water nitrate concentrations in the upper estuaries, reaching up to 500 µM. In the upstream bottom water, nitrate exceeded oxygen concentrations, resulting in a NOx-/O2 ratio higher than one (1.1-1.6). The contribution of nitrate reduction to
organic matter mineralization in the two estuaries was exceptionally high (15-35%) compared to model outputs obtained in other coastal sediments where nitrate concentrations were generally below 10 µM with a low contribution of nitrate reduction (1-6%) (Table 4). Such low values were also found in our study in the downstream stations in spring (5-10%). The only study showing nitrate concentrations up to 150 µM and a contribution of nitrate reduction to total mineralization reaching 21% was the Haringvliet Lake (Canavan et al., 2006). Our study highlighted the significant contribution of nitrate reduction to organic carbon mineralization in eutrophic and temperate macrotidal estuaries in winter and spring, and the usefulness of diagenetic modeling in estimating these rates.
Although total benthic nitrate reduction rates varied seasonally and its proportion of total mineralization remained high (>10%), there was a clear relationship between
ACCEPTED MANUSCRIPT
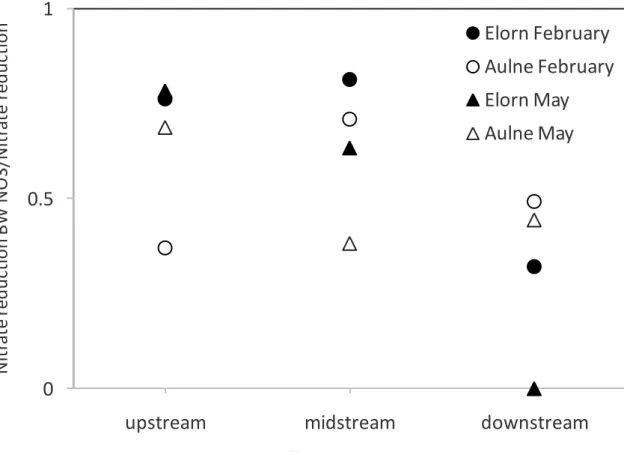
nitrate reduction fraction and the ratio between bottom water nitrate and oxygen concentrations (Fig. 6). This supported the view that elevated NOx- concentrations in
bottom waters sustained high nitrate reduction rates as bottom water NOx
-concentrations ranged from 69-546 µM at all stations during this winter/spring high river discharge. This was consistent with the highest nitrate reduction rates measured in estuarine sediments located close to nitrate-rich sewage effluents (King and Nedwell, 1987) and the positive relationship obtained between denitrification rates and nitrate concentrations (e.g. in Baltic estuaries; Asmala et al., 2017). Interestingly, even with NOx-/O2 ratio larger than 1, the contribution of oxic mineralization was
always higher than that of nitrate reduction. This was in agreement with a larger overall efficiency of oxygen as oxidant versus nitrate which is most likely related to the recycling of very labile organic matter by oxygen in the first millimeters of the sediment.
Interestingly, subtracting nitrification rates from the total nitrate reduction rates in model outputs allowed determining the fraction of nitrate reduction fueled by bottom water nitrate versus by nitrate produced by nitrification. The Fig.7 showed that the contribution of bottom water nitrate to nitrate reduction decreased from upstream and midstream (over 70%) to downstream (below 50%), with decreasing nitrate concentrations. In these nitrate-rich estuaries, the only occasion where bottom waters were not a significant source of nitrate to the sediment, was when low NOx
-concentrations were measured (7 µM at station E3 in May), again highlighting the close relationship between bottom water NOx- concentrations and bottom water
fueled nitrate reduction.
Both the downstream decrease of the contribution of nitrate reduction to organic matter mineralization with decreasing nitrate concentrations along the estuary and the high contribution of bottom water nitrate to total benthic nitrate reduction clearly showed that NOx- concentration is the main controlling factor for nitrate reduction in
benthic estuarine sediments. These findings highlight the role of sediments nitrate removal in eutrophic estuaries when nitrate is abundant in the water column.
As we reported a salinity-differentiated and time-dependent nitrate reduction in estuarine sediments, it was possible to calculate the share of river nitrate load that was directly consumed in estuarine sediments. To achieve that, we multiplied the nitrate reduction rates fueled by nitrate originating from the water column, by the surface area of the three estuarine zones (upstream, midstream, downstream). We
ACCEPTED MANUSCRIPT
then compared the sum of the nitrate reduction in the three zones to riverine nitrate loads at two seasons (winter and spring; Table 5). The share of the river nitrate discharge denitrified in sediments showed values ranging from 3 to 13%. It was stable over time (from February to May) for the Elorn estuary (12-13%) because both riverine nitrate discharge and benthic nitrate reduction decreased in the same proportion over this period. In the Aulne estuary, the situation was different with a much larger seasonal variation of the benthic nitrate removal which increased from 3% of the nitrate discharge in winter to 13% in spring. This seasonal difference was caused by the combination of a decrease in riverine nitrate discharge in spring, but constant nitrate removal from the sediments in winter and spring. The much lower benthic nitrate elimination in winter in the Aulne (3%) compared to the Elorn estuary (12%) was due to the much larger nitrate flux from the Aulne River (2750 kmol d-1 compared to 460 kmol d-1 in the Elorn River) despite higher nitrate reduction rates. These higher rates may reflect the larger input of organic substrate due to higher rains and storms and higher water flux (Khalil et al., 2013).
Extrapolation to summer conditions, where the nitrate discharge is three to five times lower than spring, would imply a benthic nitrate elimination of ~50% of riverine nitrate considering similar nitrate reduction rates. These values of nitrate removal compared to riverine nitrate load were in the highly variable range of values found in various estuaries during different seasons e.g. 15-100% in Narrangansett Bay (Novicki, 1994), 30% in Wash Estuary (Jickells et al., 2014), absent in the Elbe Estuary (Dähnke et al., 2008), 16% for the Baltic coastal zone concentrated in estuaries (Asmala et al., 2017). In spring, the significant share of nitrate filtered in the estuary by sediment nitrate reduction indicated that the benthic compartment played a role in limiting the nitrate export from agricultural land to the coastal marine environment during this key period of marine production. Furthermore, in summer where the maintenance of the ecosystem productivity (and its dystrophic potential) relies on riverine nitrate because of general summer stratification, estuaries could remove around 50% of the nitrate load. However, even if nitrate retention was significant in these nitrate-rich estuaries, the absolute filtering capacity was low compared to the huge river nitrate loads that still need to be managed to limit the deleterious symptoms of eutrophication in the coastal zone.
ACCEPTED MANUSCRIPT
In this paper, we combined the use of diagenetic modeling, sediment and pore water field data, and experimental nitrate reduction rates, in the two eutrophic Elorn and Aulne estuaries (Brittany, France). The model which included oxic mineralization, nitrification, nitrate reduction, and other anoxic processes, simultaneously reproduced the depth-dependent profiles of multiple sediment and pore water constituents, providing strong evidence that the important reaction and transport processes were well represented in these estuarine sediments. The organic matter mineralization rates showed a general decrease from upstream to downstream in the two estuaries, most probably related to the dilution and the trapping of allochtonous organic matter in estuarine sediments and its subsequent recycling. The highest organic carbon mineralization rates in the Elorn estuary were associated with the more labile and urban origin of organic matter in the watershed. The dominance of oxic mineralization in upstream sediments and the increasing contribution of anoxic mineralization with salinity may be due to the increase in anoxic oxidant availability (mostly sulfate). The high nitrate reduction rates compared to other estuaries and the relatively large contribution of nitrate reduction to organic matter degradation were to a large extent related to high bottom water nitrate concentrations, especially in the inner estuaries. The variations in nitrate concentrations in bottom waters had an impact on the contribution of benthic nitrate reduction and consequently the different organic carbon mineralization pathways in these estuarine sediments. Thus, the capacity of estuarine sediments in processing organic carbon and nitrate to effectively consume nitrate from the estuarine water was confirmed and improved our understanding in the nitrogen losses and the contribution of the different diagenetic pathways to organic carbon mineralization in the benthic compartment. The reduction of bottom water nitrate (but not nitrate produced by nitrification) removed 3-13% of the river nitrate flux in these estuaries in winter and spring, and could reach ~50% during summer. These results highlighted the capacity of estuarine sediments to decrease the river nitrate load before the coastal zone. However, this filtering effect was limited considering the huge nitrate loads brought by the two rivers to the estuaries in the context of coastal eutrophication.
ACCEPTED MANUSCRIPT
Data acquisition of this study was financed by the INSU-EC2CO project Moitem-Estuaires. The authors thank the captains and crews of N/O Côtes de la Manche, Bruno Bombled, Imane Dahhaoui, Manon Le Goff, Xavier Philippon, Agnès Youenou, Roger Kérouel, Julien Queré, Erwan Amice, Robert Marc, Chen Yan, Françoise Andrieux-Loyer, Eric Viollier, Bruno Deflandre and Olivier Ragueneau, for their support during field sampling and analysis of the samples and data. This is LSCE paper number XXXX.
References
Aminot, A., Kérouel, R., Coverly, S.C., 2009. Nutrients in seawater using segmented flow analysis. Practical guidelines for the analysis of seawater. CRC Press, Boca Raton, pp. 143-178.
Andrieux-Loyer, F., Philippon, X., Bally, G., Kérouel, R., Youenou, A., Le Grand, J., 2008. Phosphorus Dynamics and Bioavailability in Sediments of the Penzé Estuary (NW France): In Relation to Annual P-Fluxes and Occurrences of AlexandriumMinutum. Biogeochemistry 88, 213–231.
Asmala, E., Carstensen, J., Conley, D. J., Slomp, C. P., Stadmark, J., Voss, M., 2017. Efficiency of the coastal filter: Nitrogen and phosphorus removal in the Baltic Sea. Limnol. Oceanogr.. 62, S222–S238. doi:10.1002/lno.10644
Aurousseau, P., 2013. Evaluation de l'impact des cours d'eau sur l'eutrophisation dans la bande côtière: nécessité de raisonner sur les concentrations et sur les flux. Biotechnologie, Agronomie, Société et Environnement 17(suppl 1), pp. 271.
Bernard, R. J., Mortazavi, B., Kleinhuizen, A.A., 2015. Dissimilatory nitrate reduction to ammonium (DNRA) seasonally dominates NO3− reduction pathways in an
anthropogenically impacted sub-tropical coastal lagoon. Biogeochemistry 125(1), 47–64.
ACCEPTED MANUSCRIPT
Billen, G., 1982. Modelling the processes of organic matter degradation and nutrient recycling in sedimentary systems. In: Nedwell, D. B., Brown, C. M. (eds.) Sediment microbiology. Academic Press, London, pp. 15-52.
Billen, G., Lancelot, C., Meybeck, M., 1991. N, P and Si retention along the aquatic continuum from land to ocean. In: Mantoura, R.F.C., Martin, J.M., Wollast, R. (Eds.), Ocean Margin Processes in Global Change. Dahlem Workshop Reports. Wiley, pp. 19-44.
Billen, G., Garnier, J., 2007. River basin nutrient delivery to the coastal sea: Assessing its potential to sustain new production of non-siliceous algae. Mar. Chem. 106, 148–160. doi:10.1016/j.marchem.2006.12.017
Billen et al., 2011. Nitrogen flows from European regional watersheds to coastal marine waters. The European Nitrogen Assessment, ed. Mark A. Sutton, Clare M. Howard, Jan Willem Erisman et al. Cambridge University Press, 271-297.
Boudreau, B.P., 1986. Mathematics of tracer mixing in sediments: I. Spatially dependent, diffusive mixing. Amer. J. Sci. 286, 161-198.
Boudreau B.P., 1997. Diagenetic models and their implementation. Modelling transport and reactions in aquatic sediments. Springer-Verlag, Berlin.
Brigolin, D., Pastres, R., Nickell, T.D., Cromey, C.J., Aguilera, D.R., Regnier, P., 2009. Modelling the impact of aquaculture on early diagenetic processes in sea loch sediments. Marine Ecology Progress Series 388, 63-80.
Burgin, A.J. and Hamilton, S.K., 2007. Have we overemphasized the role of denitrification in aquatic ecosystems? A review of nitrate removal pathways. Front. Ecol. Environ. 5(2), 89–96.
Canavan, R.W., Slomp, C.P., Jourabchi, P., Van Cappellen, P., Laverman, A.M., Van den Berg, G.A., 2006. Organic matter mineralization in sediment of a coastal
ACCEPTED MANUSCRIPT
freshwater lake and response to salinization. Geochimica Et Cosmochimica Acta 70 (11), 2836-2855.
Canavan, R.W., Laverman, A.M., Slomp, C.P., 2007. Modeling nitrogen cycling in a
coastal fresh water sediment. Hydrobiologia 584 (1), 27–36.
http://doi.org/10.1007/s10750-007-0583-z
Cloern, J.E., 2001. Our evolving conceptual model of the coastal eutrophication problem. Mar. Ecol. Prog. Ser. 210, 223–253. doi:10.3354/meps210223.
Dähnke, K., Bahlmann, E., Emeis, K., 2008. A nitrate sink in estuaries? An assessment by means of stable nitrate isotopes in the Elbe estuary. Limnology and Oceanography 53, doi: 10.4319/lo.2008.53.4.1504.
Dale, O.R., Tobias, C.R., Song, B., 2009. Biogeographical distribution of diverse anaerobic ammonium oxidizing (anammox) bacteria in Cape Fear River Estuary. Environ. Microb. 11, 1194–1207.
Dalsgaard, T., Thamdrup, B., Canfield, D.E., 2005. Anaerobic ammonium oxidation (anammox) in the marine environment. Res. Microbiol. 156(4):457-64.
De Graaf, A.A., Mulder, A., De Bruijn P., Jetten, M.S., Robertson, L.A., Kuenen, J.G., 1995. Anaerobic oxidation of ammonium is a biologically mediated process. Appl.Environ.Microbiol.61(4):1246-51.
Dedieu, K., Rabouille, C., Gilbert, F., Soetaert, K., Metzger, E., Simonucci, C., Jezequel, D., Prevot, F., Anschutz, P., Hulth, S., Ogier, S. and Mesnage, V., 2007. Coupling of carbon, nitrogen and oxygen cycles in sediments from a Mediterranean lagoon: a seasonal perspective. Marine Ecology Progress Series 346, 45-59.
Del Amo, Y., 1996. Dynamique et structure des communautés phytoplanctoniques dans un écosystème côtier perturbé; cinétiques de l'incorporation de silicium par
ACCEPTED MANUSCRIPT
les diatomées. Université de Bretagne Occidentale, Brest. Thèse de Doctorat, pp. 302.
Den Berg, E.M., Boleij, M., Kuenen, J.G.,, RobbertKleerebezem, R., Mark C. M. van Loosdrecht, M.C.M., 2016. DNRA and Denitrification Coexist over a Broad Range of Acetate/N-NO3− Ratios, in a Chemostat Enrichment Culture. Front Microbiol. 7: 1842.
doi: 10.3389/fmicb.2016.01842.
Emerson, S., Jahnke, R., Heggie, D.T., 1984. Sediment water exchange in shallow water estuarine sediments. J. Mar. Res. 42, 709-730.
Fraisse, S., Bormans, M., Lagadeuc, Y., 2013. Morphofunctional traits reflect differences in phytoplankton community between rivers of contrasting flow regime. Aquat. Ecol. 47, 315–327. doi:10.1007/s10452-013-9446-z.
Giblin, A.E., Tobias, C.R., Song, B., Weston, N., Banta, G.T. and Rivera-Monroy, V.H., 2013. The importance of dissimilatory nitrate reduction to ammonium (DNRA) in the nitrogen cycle of coastal ecosystems. Oceanography 26 (3), 124–131.
Gravier, D., Wulff, A. and Torstensson, A., 2012. Monitoring of green tides on the Brittany coasts (France). Primary Producers of the Sea, Bio458, 1-9.
Herbert, R.A., 1999. Nitrogen cycling in coastal marine ecosystems. FEMS Microbiology Reviews 23, 563–590.
Hou, L., Zheng, Y., Liu, M., Li, X., Lin, X., Yin, G., Gao, J., Deng, F., Chen, F. and Jiang, X., 2015. Anaerobic ammonium oxidation and its contribution to nitrogen removal in China’s coastal wetlands. Scientif. Rep. 5, 15621.
Howarth, R., Chan, F., Conley, D.J., Garnier, J., Doney, S.C., Marino, R., Billen, G., 2011. Coupled biogeochemical cycles: eutrophication and hypoxia in temperate estuaries and coastal marine ecosystems. Front. Ecol. Environ. 9, 18-26.
ACCEPTED MANUSCRIPT
Jickells, T.D., Andrews, J.E., Parkes, D.J., Suratman, S., Aziz, A.A., Hee, Y.Y., 2014. Nutrient transport through estuaries: The importance of the estuarine geography. Estuarine, Coastal and Shelf Science 150, 215-229.
Jorgensen, B.B., Sorensen, J., 1985. Seasonal cycles of O2, NO3- and SO4
2-reduction in estuarine sediments - The significance of an NO3- reduction maximum
in spring. Marine Ecology-Progress Series 24 (1-2), 65-74.
Katsev, S., Chaillou, G., Sundby, B., Mucci, A., 2007. Effects of progressive oxygen depletion on sediment diagenesis and fluxes: A model for the lower St. Lawrence River Estuary. Limnology and Oceanography 52 (6), 2555-2568.
Khalil, K., Raimonet, M., Laverman, A.M., Yan, C., Andrieux-Loyer, F., Viollier, E., Deflandre, B., Ragueneau, O., Rabouille, C., 2013. Spatial and temporal variability of sediment organic matter recycling in two temperate eutrophicated estuaries. Aquat. Geochem. 19, 517–542. doi:10.1007/s10498-013-9213-8.
King, D., Nedwell, D.B., 1987. The adaptation of nitrate-reducing bacterial communities in estuarine sediments in response to overlying nitrate load. FEMS Microbiology Ecology 45, 15-20.
Labry, C., Delmas, D., Youenou, A., Quere, J., Leynaert, A., Fraisse, S., Raimonet, M., Ragueneau, O., 2016. High alkaline phosphatase activity in phosphate replete waters: The case of two macrotidal estuaries. Limnol. Oceanogr. 61, 1513–1529. doi:10.1002/lno.10315.
Laruelle, G.G., 2009. Quantifying nutrient cycling and retention in coastal waters at the global scale. GeologicaUltraiectina (312) (Dissertation), University of Utrecht.
Laverman, A.M., Van Cappellen, P., van Rotterdam-Los, D., Pallud, C., Abell, J., 2006. Potential rates and pathways of microbial nitrate reduction in coastal sediments. Fems Microbiology Ecology 58 (2), 179-192.
ACCEPTED MANUSCRIPT
Laverman, A.M., Pallud, C., Abell, J., Van Cappellen, P., 2012. Comparative survey of potential nitrate and sulfate reduction rates in aquatic sediments. Geochimica Et Cosmochimica Acta 77, 474-488.
Li, Y.H., Gregory, S., 1974. Diffusion of ions in sea water and in deep-sea sediments. Geochim. Cosmochim. Acta 38, 703-714.
Lorrain, A., Paulet, Y.M., Chauvaud, L., Savoye, N., Nezan, E., Guerin, L., 2000. Growth anomalies in Pecten maximus from coastal waters (Bay of Brest, France): relationship with diatom blooms. Journal of the Marine Biological Association of the United Kingdom 80 (4), 667-673.
Maerki, M., Mueller, B., Dinkel, C., Wehrli, B., 2009. Mineralization pathways in lake sediments with different oxygen and organic carbon supply. Limnology and Oceanography 54 (2), 428-438.
Meile, C., Koretsky, C., Van Cappellen, P., 2001. Quantifying bioirrigation in aquatic sediments: an inverse modeling approach. Limnology and Oceanography 46, 164– 177.
Naeher, S. et al., 2015. Molecular and geochemical constraints on anaerobic ammonium oxidation (anammox) in a riparian zone of the Seine Estuary (France). Biogeochemistry 123, 237–250.
Nixon, S.W., Ammerman, J.W., Atkinson, L.P., Berounsky, V.M., Billen, G., Boicourt, W.C., Boynton, W.R., Church, T.M., Ditoro, D.M., Elmgren, R., Garber, J.H., Giblin, A.E., Jahnke, R.A., Owens, N.J.P., Pilson, M.E.Q., Seitzinger, S.P., 1996. The fate of nitrogen and phosphorus at the land-sea margin of the North Atlantic Ocean. Biogeochemistry 35, 141–180. doi:10.1007/BF02179826.
Nowicki, B.L., 1994. The Effect of Temperature, Oxygen, Salinity, and Nutrient Enrichment on Estuarine Denitrification Rates Measured with a Modified Nitrogen Gas Flux Technique. Estuarine, Coastal and Shelf Science 38, 137-156.