Design Strategies for Optimizing High Burnup Fuel
in Pressurized Water Reactors
by Zhiwen Xu
B.E., Engineering Physics, Tsinghua University, P.R.China (1998)
B.E., Computer Science,
Tsinghua Univerisity, P.R.China (1998)
Submitted to the Department of Nuclear Engineering in partial fulfillment of the requirements for the degree of
DOCTOR OF PHILOSOPHY at the
MASSACHUSETTS INSTITUTE OF TECHNOLOGY January 2003
Copyright © 2003 Massachusetts Institute of Technology All rights reserved
Signature of Author
Department of Nuclear Engineering
January 10, 2003
Certified by
Michael J. Driscoll (thesis supervisor)
Professor Emeritus of Nuclear Engineering
Mujid S. Kazimi (thesis supervisor)
TEPCO Professor of Nuclear Engineering
Accepted by
Jeffrey A. Coderre Chairman, Department Committee on Graduate Students
Design Strategies for Optimizing High Burnup Fuel
in Pressurized Water Reactors
by Zhiwen Xu
Submitted to the Department of Nuclear Engineering on January 23, 2003, in partial fulfillment of
the requirements for the degree of Doctor of Philosophy
Abstract
This work is focused on the strategy for utilizing high-burnup fuel in pressurized water reactors (PWR) with special emphasis on the full array of neutronic considerations. The historical increase in batch-averaged discharge fuel burnup, from ~30 MWd/kg in the 1970s to ~50 MWd/kg today, was achieved mainly by increasing the reload fuel enrich-ment to allow longer fuel cycles: from an average of 12 months to about 18 months. This also reduced operating costs by improving the plant capacity factor. Recently, because of limited spent fuel storage capacity, increased core power output and the search for in-creased proliferation resistance, achieving burnup in the 70 to 100 MWd/kg range has attracted considerable attention. However the implications of this initiative have not been fully explored; hence this work defines the practical issues for high-burnup PWR fuels based on neutronic, thermal hydraulic and economic considerations as well as spent fuel characteristics.
In order to evaluate the various high burnup fuel design options, an improved MCNP-ORIGEN depletion program called MCODE was developed. A standard burnup predictor-corrector algorithm is implemented, which distinguishes MCODE from other MCNP-ORIGEN linkage codes.
Using MCODE, the effect of lattice design (moderation effect) on core design and spent fuel characteristics is explored. Characterized by the hydrogen-to-heavy-metal ratio (H/HM), the neutron spectrum effect in UO2/H2O lattices is investigated for a wide range
of moderation, from fast spectra to over-thermalized spectra. It is shown that either wetter or very dry lattices are preferable in terms of achievable burnup potential to those having an epithermal spectrum. Wet lattices are the preferred high burnup approach due to im-proved proliferation resistance. The constraint of negative moderator temperature coeffi-cient (MTC) requires that H/HM values (now at 3.4) remain below ~6.0 for PWR lattices.
Alternative fuel choices, including the conventional solid pellets, central-voided annular pellets, Internally- & eXternally-cooled Annular Fuel (IXAF), and different fuel forms are analyzed to achieve a wetter lattice. Although a wetter lattice has higher burnup potential than the reference PWR lattice, the requirement of a fixed target cycle energy production necessitates higher initial fuel enrichments to compensate for the loss of fuel mass in a wetter lattice. Practical issues and constraints for the high burnup fuel include
neutronic reactivity control, heat transfer margin, and fission gas release. Overall the IXAF design appears to be the most promising approach to realization of high burnup fuel.
High-burnup spent fuel characteristics are compared to the reference spent fuel of 33 MWd/kg, representative of most of the spent fuel inventory. Although an increase of decay power and radioactivity per unit mass of initial heavy metal is immediately ob-served, the heat load (integration of decay power over time) per unit electricity generation decreases as the fuel discharge burnup increases. The magnitude of changes depends on the time after discharge. For the same electricity production, not only the mass and vol-ume of the spent fuel are reduced, but also, to a lesser extent, the total heat load of the spent fuel. Since the heat load in the first several hundred years roughly determines the capital cost of the repository, a high burnup strategy coupled with adequate cooling time, may provide a cost-reduction approach to the repository.
High burnup is beneficial to enhancing the proliferation resistance. The plutonium vector in the high-burnup spent fuel is degraded, hence less attractive for weapons. For example, the ratio of Pu-238 to Pu-239 increases with burnup to the 2.5 power. However, the economic benefits are uncertain. Under the current economic conditions, the PWR fuel burnup appears to have a shallow optimum discharge burnup between 50 and 80 MWd/kg. The actual minimum is influenced by the financing costs as well as the cost of refueling shutdowns. Since the fuel cycle back-end benefits will accrue to the federal government, the current economic framework, such as the waste fee based on the elec-tricity produced rather than volume or actinide content, does not create an incentive for utilities to increase burnup.
Different schemes exist for fuel management of high burnup PWR cores. For the conventional core design, a generalized enrichment-burnup correlation (applicable be-tween 3 w/o and 20 w/o) was produced based on CASMO/SIMULATE PWR core calcu-lations. Among retrofit cores, increasing the number of fuel batches is preferred over in-creasing the cycle length due to nuclear fuel cycle economic imperatives. For future core designs, a higher power-density core is a very attractive option to cut down the busbar cost. The IXAF concept possesses key design characteristics that provide the necessary thermal margins at high core power densities. In this regard, the IXAF fuel deserves fur-ther investigation to fully exploit its high burnup capability.
Thesis Supervisor: Michael J. Driscoll
Title: Professor Emeritus of Nuclear Engineering Thesis Supervisor: Mujid S. Kazimi
Title: TEPCO Professor of Nuclear Engineering
Acknowledgements
The keen help, patient guidance and generous support of Professor Michael J. Driscoll and Professor Mujid S. Kazimi, my thesis supervisors, are greatly appreciated. Lots of inspiration throughout this work comes directly from them.
I am grateful to two members of the Advanced Fuel Cycle Group at the MIT Cen-ter for Advanced Nuclear Energy Systems (CANES): Dr. Edward E. Pilat for his contri-bution to conventional PWR core review and invaluable advice on burnable poison us-age, Dr. Pavel Hejzlar for numerous discussions on MCODE development and the inter-nally and exterinter-nally cooled annular fuel concept. Special thanks are due to my colleagues Dr. Xianfeng Zhao, Dr. Yun Long, Mr. Dean Wang, Mr. Eugene Shwageraus, and Mr. Dandong Feng who provided help on various aspects of the work.
In terms of the MCODE benchmark problem (9.75 w/o UO2 with a conventional
PWR lattice under cold conditions), I wish to express my gratitude to Dr. Hyung-Kook Joo from KAERI for providing results of HELIOS and to Dr. Tamer Bahadir from Studs-vik of America, Inc., for providing results of CASMO-4 (internal version). The corrected version of ORIGEN2.1 supplied by Dr. Allan G. Croff from Oak Ridge National Labora-tory is also acknowledged.
This thesis could not have been completed without the endless love and support from my family. I would like to give special thanks to my wife, Kun Yu, for wading through past five years of difficulties and achievements with me at MIT. My dear son, Chen Y. Xu, three years old, is now able to speak words clearly and likes to jump and run. I thank my mother-in-law, Ying Ma, for helping us taking care of my son. The thesis is dedicated to them.
This work has been partially funded by the Idaho National Engineering & Envi-ronmental Laboratory (INEEL) through the Advanced Fuel Project, and by the DOE’s support of the annular fuel project through a NERI grant.
Table of Contents
Abstract... i Acknowledgement... iii Table of Contents ... iv List of Figures...x List of Tables ...xvAbbreviations for Organizations ... xvii
Nomenclature ... xviii
1. Introduction...1
1.1 Background ...1
1.2 High Burnup Review ...3
1.2.1 UO2 Fuel ...3
1.2.2 Literature Review...4
1.3 Motivation...6
1.3.1 Incentives ...6
1.3.2 High Burnup Implementation ...8
1.4 Objectives ...9
1.5 Analysis Tools ...10
1.5.1 Studsvik Core Management System (CMS) Code Package ...10
1.5.2 MCNP-4C ...12 1.5.3 ORIGEN2 ...12 1.5.4 MCODE ...13 1.5.5 VIPRE ...13 1.5.6 FRAPCON-3...14 1.6 Thesis Organization ...14
2. High Burnup Issues of Current PWR Designs...17
2.1 Introduction...17
2.2 Conventional PWR Description...21
2.2.2 Reactivity Control...21
2.3 Licensing/Design/Operating Considerations ...27
2.3.1 Licensing Issues...28
2.3.2 Design Considerations ...28
2.3.3 Operational Issues...34
2.4 High Burnup Core Scoping Analysis...37
2.4.1 Core Modeling ...37
2.4.2 Multi-Batch Burnup ...40
2.4.3 Single-Batch Discharge Burnup (B1) Correlation...41
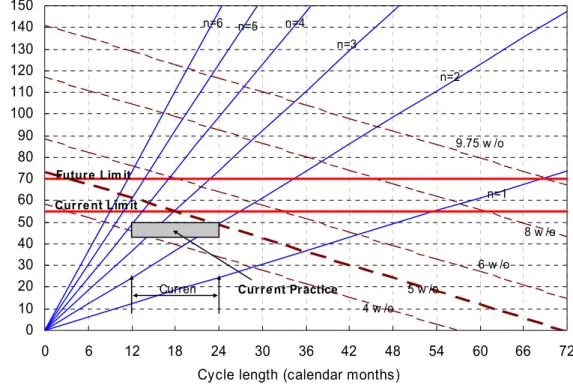
2.4.4 Discharge Burnup vs. Cycle Length ...44
2.4.5 Resource Utilization...46
2.4.6 Haling Power Distributions...50
2.5 Consideration on Retrofit, High Burnup Core Schemes...53
2.5.1 Longer Cycle Length ...53
2.5.2 More Batches ...55 2.5.3 Conclusions...55 2.6 Chapter Summary ...56 3. MCODE Development...58 3.1 Introduction...58 3.2 Methodology ...61 3.2.1 Overview...61
3.2.2 MCNP Tallies and One-Group Cross Section Preparations ...64
3.2.3 Flux Normalization ...67
3.2.4 ORIGEN Depletions ...69
3.2.5 Coupling Between MCNP and ORIGEN ...70
3.3 High Burnup UO2 Lattice Benchmark...73
3.3.1 Pin Cell Model ...73
3.3.2 Code Descriptions...75
3.3.3 Benchmark Results and Analysis...75
3.4 Sensitivity Calculations ...82
3.4.2 Energy Release per Fission...84
3.4.3 ORIGEN Libraries ...86
3.4.4 Statistical Errors...87
3.5 General Remarks on MCNP/ORIGEN Linkage Codes ...87
3.5.1 MCNP Issues ...87
3.5.2 ORIGEN Issues...89
3.5.3 Future Trends ...90
3.6 Chapter Summary ...91
4. Neutron Spectrum Effects...93
4.1 Introduction...93
4.2 Lattice Geometry Effect...97
4.2.1 Unit Cell Model ...97
4.2.2 Results & Discussions...98
4.3 Parametric Study of Moderation Effects...100
4.3.1 Introduction...100
4.3.2 Initial k∞...102
4.3.3 Reactivity-Limited Burnup ...107
4.3.4 Neutron Spectrum ...110
4.3.5 Discussion ...113
4.4 Other Fuel Types...113
4.5 Cycle Length Constraints...115
4.6 Core Size, Power Density, and Neutron Leakage...118
4.6.1 Introduction...118
4.6.2 PWR Core Size and Leakage Reactivity Penalty ...118
4.6.3 Leakage in Highly-Undermoderated Systems ...120
4.6.4 Long-Cycle Cores ...121
4.6.5 Summary ...122
4.7 Chapter Summary ...123
5. Alternative Fuel Choices ...125
5.1 Introduction...125
5.2.1 Introduction...129
5.2.2 Burnup Potential, Cycle Length, and MTC Considerations ...129
5.2.3 Lattice Optimization ...133
5.2.4 Conclusion ...134
5.3 Center-Voided Annular Fuel Pellet ...135
5.3.1 Introduction...135
5.3.2 Void-Filling Materials ...136
5.3.3 Comparison to Solid Fuel Pin...137
5.4 Internally and Externally-Cooled Annular Fuel (IXAF) ...138
5.4.1 Introduction...138
5.4.2 Four-Factor Formula Considerations...140
5.4.3 From Solid to Annular: A Step-by-Step Variation Approach ...141
5.4.4 Results and Discussion ...143
5.4.5 The Eigenvalue Ladder ...148
5.4.6 RIM Effects...149
5.5 Chapter Summary ...154
6. Practical Issues of High Burnup in Wetter Lattices ...155
6.1 Introduction...155
6.2 Neutronic Reactivity Control...157
6.2.1 Introduction...157
6.2.2 Burnable-Poison-Free Core Analysis ...159
6.2.3 Poisoning the Core...163
6.2.4 Design Considerations ...177
6.3 Heat Transfer Considerations ...181
6.3.1 Introduction...181
6.3.2 Hot Channel Analysis ...182
6.3.3 Discussion ...185
6.4 Fuel Performance Considerations...186
6.5 Chapter Summary ...189
7. High Burnup Effects on Spent Fuel Characteristics ...191
7.2 Waste Disposal Characteristics...192
7.2.1 Characteristics of Today’s Discharged Fuel ...192
7.2.2 High Burnup via High-Enriched Uranium...194
7.2.3 Neutron Spectrum Effects (H/HM)...206
7.2.4 Power Density Effect ...207
7.3 Proliferation Resistance ...208
7.3.1 Introduction...208
7.3.2 Higher Discharge Burnup ...211
7.3.3 Neutron Spectrum Effect (H/HM Variation) ...212
7.4 Other Considerations ...214
7.5 Chapter Summary ...214
8. Economics Aspects of High Burnup...215
8.1 Introduction...215
8.2 Nuclear Fuel Cycle Economics...216
8.2.1 Introduction...216
8.2.2 The Fuel Cycle Cost Calculation ...218
8.2.3 High Burnup for Conventional PWRs ...222
8.2.3.1 Enrichment Increase...222
8.2.3.2 Effect of a Wetter Lattice...225
8.2.4 Operational Strategies...228
8.2.5 High Burnup in Different Neutron Spectra...231
8.3 Operation and Maintenance Considerations ...234
8.3.1 Introduction...234
8.3.2 Refueling Outages...234
8.4 Case Study of Power Uprating...237
8.5 Chapter Summary & Recommendations ...238
9. Summary, Conclusions, and Recommendations...240
9.1 Summary of Motivation...240
9.2 MCODE Development...240
9.3 Neutron Spectrum Effect by H/HM Variations ...243
9.5 Practical Issues...246
9.5.1 Reactivity Control...246
9.5.2 Thermal Hydraulics Considerations ...247
9.5.3 Fuel Performance ...249
9.6 High-Burnup Spent Fuel & Proliferation Resistance...250
9.7 Economic Considerations ...251
9.8 Recommendations for Future Work...252
9.8.1 MCODE Development...252
9.8.2 Detailed Core Design...252
9.8.3 High Burnup Fuel Performance Studies ...253
9.8.4 Policy Studies...253
9.8.5 Proliferation Study...253
9.8.6 Recycling Issue ...253
Reference ...254
Appendix A. High Burnup Core Input Files for CMS Code Package ...265
Appendix B. MCODE (Ver. 1.0, February 2002) User’s Manual ...275
Appendix C. Input Files for the High Burnup Benchmark Problem ...296
Appendix D. Input Files for Axial Enrichment Zoning Calculations ...300
List of Figures
Figure 1.1 Atmospheric CO2 concentration over the last millennium...1
Figure 1.2 Historical discharge burnup trend over the 1980-2000 period (PWR)...3
Figure 1.3 Flow of calculations for the CMS code package...11
Figure 2.1 Uranium-235 enrichment over the 1876-2000 time period...20
Figure 2.2 Cross sectional view of control rod locations...23
Figure 2.3 Control bank insertion limits versus percent rated thermal power...24
Figure 2.4 Thermal design margin considerations...29
Figure 2.5 Margins of high burnup cores (right) compared to standard PWR (left) ...35
Figure 2.6 Axial offset anomaly example...36
Figure 2.7 Quarter-core model of 193-assembly conventional PWR core...38
Figure 2.8 Core depletion calculations for various fuel enrichments ...42
Figure 2.9 Burnup-enrichment relations for typical PWRs ...43
Figure 2.10 Discharge burnup versus cycle length map for a typical PWR ...44
Figure 2.11 Natural uranium utilization for typical PWRs...47
Figure 2.12 Separative work utilization for typical PWRs ...47
Figure 2.13 Haling and poison-free BOC assembly power distributions ...51
Figure 2.14 Axial core power distributions ...52
Figure 2.15 Reactivity and critical boron for the single batch core...53
Figure 2.16 Boron worth for the single batch core ...54
Figure 3.1 Illustration of MCODE architecture...60
Figure 3.2 Flow diagram of MCODE ...63
Figure 3.3 Pin cell model (not to scale) ...73
Figure 3.4 Eigenvalue comparison between MCODE, CASMO-4, and HELIOS ...79
Figure 3.5 Eigenvalue difference from CASMO-4 as a function of burnup ...79
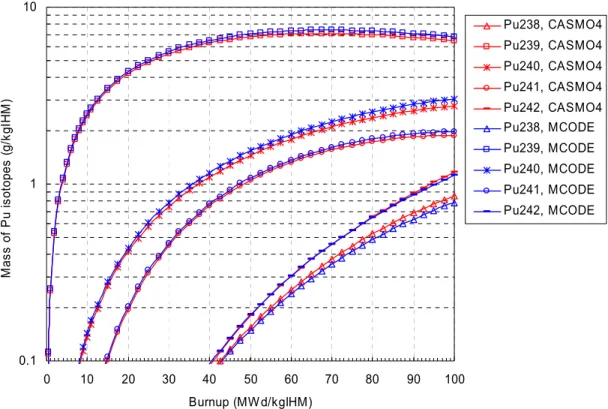
Figure 3.6 Plutonium vector comparison with CASMO-4 as a function of burnup ...82
Figure 3.7 Effect of time step size on the convergence ...83
Figure 3.8 Burnup sensitivity to the macro burnup timestep size...84
Figure 3.10 Burnup calculation sensitivity to ORIGEN libraries...86
Figure 4.1 Lattice unit cells ...97
Figure 4.2 MCODE depletion histories for different lattice unit cells ...99
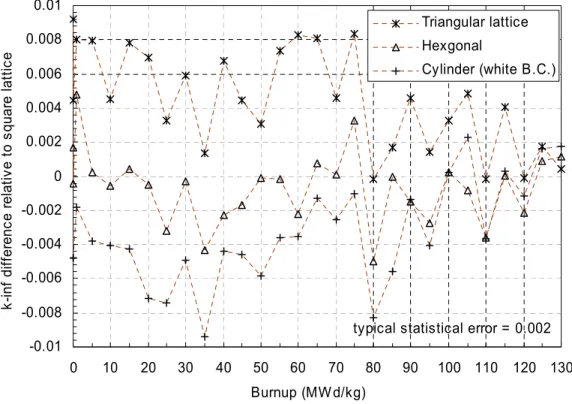
Figure 4.3 Relative eigenvalue differences from the square lattice unit cell...99
Figure 4.4 Water density variation with pressure at 310°C...101
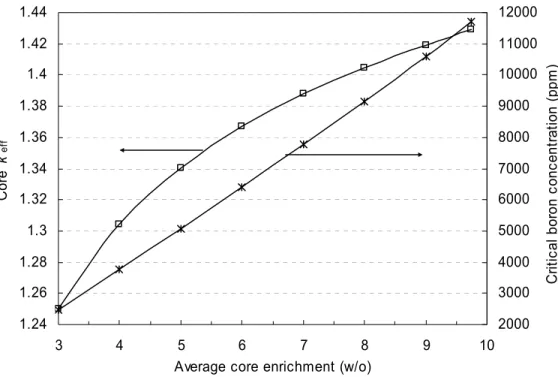
Figure 4.5 Initial k∞ as a function of H/HM ratio ...103
Figure 4.6 Soluble poison effects on 4.5 and 9.75 w/o UO2 fuel ...105
Figure 4.7 CASMO-4 prediction of reactivity-limited, single-batch burnup, B1...108
Figure 4.8 Conversion ratio (initial) for 9.75 w/o U-235 case...109
Figure 4.9 MCODE/CASMO results for 9.75 w/o enrichment ...110
Figure 4.10 Neutron spectrum for different enrichments at H/HM=3.4...111
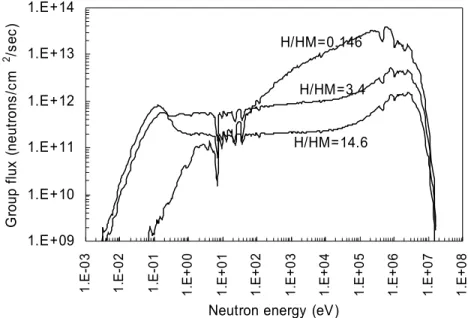
Figure 4.11 Neutron spectrum for 9.75 w/o under different moderation conditions...112
Figure 4.12 Eight combinations of fissile and fertile materials ...114
Figure 4.13 Burnup capability of various combinations of fissile and fertile materials..114
Figure 4.14 Reactivity-limited burnup capability using different methods of varying H/HM...116
Figure 4.15 Single-batch cycle length for different schemes of varying H/HM ...117
Figure 4.16 Sensitivity of migration area and length to moderator-to-fuel ratio...120
Figure 5.1 Schematic showing fuel design options ...128
Figure 5.2 Burnup histories of the IMF and reference cases ...131
Figure 5.3 IMF depletion curves as a function of time (effective full power days) ...131
Figure 5.4 MTC at BOL as a function of boron concentration...132
Figure 5.5 The initial k∞ and burnup potential of CERMET fuel ...133
Figure 5.6 The energy production (EFPD) as a function of H/HM ...134
Figure 5.7 Single-batch burnup capabilities for various filling materials ...136
Figure 5.8 Single-batch cycle length for various filling materials (9.75 w/o)...137
Figure 5.9 Single-batch cycle length comparison between annular fuel and solid fuel ..138
Figure 5.10 Illustration of step-by-step changes (clean case approach) ...145
Figure 5.11 Reactivity change versus burnup for solid and IXAF cases...147
Figure 5.12 Reactivity change versus time for solid and IXAF cases ...147
Figure 5.14 Power distributions in IXAF and solid fuel...150
Figure 5.15 Local burnup distribution in the fuel pellet ...151
Figure 5.16 Local conversion ratio at BOL for the solid and IXAF cases ...152
Figure 5.17 Plutonium distributions ...152
Figure 6.1 Schematic demonstration of various linear power limits ...156
Figure 6.2 Standard Westinghouse 17×17 assembly model ...158
Figure 6.3 Depletion histories of 18-month PWR fuel and high burnup fuel...159
Figure 6.4 BOC reactivity and boron worth as a function of H/HM ...161
Figure 6.5 BOC core critical boron concentration as a function of H/HM...161
Figure 6.6 Range of burnable poison control trajectories using LRM ...164
Figure 6.7 Cross sections of various nuclides in the thermal energy range ...167
Figure 6.8 Depletion curves for HB-REF case with 156 IFBA rods ...169
Figure 6.9 Depletion curves for HB-REF case with all IFBA rods ...169
Figure 6.10 Burnable-poison pin layouts...171
Figure 6.11 ρ(B) histories for burnable poison pins with 6 wt% Gd2O3...172
Figure 6.12 ρ(B) histories for burnable poison pins with 8 wt% Gd2O3...172
Figure 6.13 ρ(B) histories for burnable poison pins with 10 wt% Gd2O3...173
Figure 6.14 ρ(B) histories for all fuel (9.75 w/o UO2) pins poisoned with erbia ...174
Figure 6.15 Comparison of burnable poisons in a conventional PWR assembly ...174
Figure 6.16 Comparison of burnable poisons in a high burnup, conventional PWR assem-bly (9.75 w/o)...175
Figure 6.17 Poisoning the high burnup assembly with a wet lattice ...176
Figure 6.18 Schematic of axial heterogeneous fuel loading ...178
Figure 6.19 The effect of axially heterogeneous fissile distribution on initial neutronic parameters...179
Figure 6.20 Depletion curves for axial zoning cases ...180
Figure 6.21 MDNBR and pressure drop as a function of H/HM for solid fuel pin ...184
Figure 6.22 Maximum fuel temperature as H/HM increases (rod diameter)...184
Figure 6.23 MDNBR comparison in hot channel for the IXAF and reference solid pin.185 Figure 6.24 Fuel temperature distributions at BOC...187
Figure 7.1 In-situ radioactivity for typical PWR spent fuel as a function of time...193
Figure 7.2 Radioactivity per MTIHM versus time after discharge...197
Figure 7.3 Radioactivity per GWyr(e) versus time after discharge ...198
Figure 7.4 Decay power per MTIHM after discharge ...199
Figure 7.5 Decay power per GWyr(e) after discharge...200
Figure 7.6 Accumulated decay heat per MTIHM after discharge ...201
Figure 7.7 Accumulated decay heat per GWyr(e) after discharge...202
Figure 7.8 Correlation between decay power and radioactivity ...203
Figure 7.9 Correlation between decay energy and radioactivity ...203
Figure 7.10 The WDV of nuclides in PWR spent fuel as a function of time ...206
Figure 7.11 Total plutonium and maximum Np-237 for spent fuel with 100 MWd/kg, 12% initial U-235 enrichment ...207
Figure 7.12 Power density effect on spent fuel characteristics...208
Figure 7.13 Pu-238 fraction versus burnup for several initial U-235 enrichments ...211
Figure 7.14 CASMO-4 pin cell predictions of isotopic composition of Pu in spent fuel at 100 MWd/kg for lattices with initial enrichment of 12%...212
Figure 7.15 Spontaneous neutron and heat generation rates vs. H/HM at 100 MWd/kg, 12w/o initial U-235 enrichment...213
Figure 8.1 Nuclear electricity generation cost breakdown ...215
Figure 8.2 Flow chart of current once-through fuel cycle ...218
Figure 8.3 A schematic cash flow diagram for the current once-through fuel cycle...219
Figure 8.4 Fuel cycle cost for 18-month conventional PWRs ...223
Figure 8.5 Sensitivity to SWU costs for 18-month-cycle PWRs...224
Figure 8.6 Reload fuel enrichment requirement with H/HM...226
Figure 8.7 Fuel cycle costs with discharge burnup (same core energy production)...227
Figure 8.8 Fuel cycle decomposition for the central-voided annual fuel ...228
Figure 8.9 Uranium utilization for different neutron spectra...233
Figure 8.10 SWU utilization for different neutron spectra ...233
Figure 8.11 Refueling cost levelization ...235
Figure 8.12 Refueling cost as a function of cycle length...236
Figure 9.2 Plutonium vector comparison with CASMO-4 as a function of burnup ...242 Figure 9.3 MCODE/CASMO results for 9.75 w/o enrichment ...244 Figure 9.4 MDNBR and pressure drop as a function of H/HM for solid fuel pin ...248 Figure 9.5 MDNBR comparison in hot channel for the IXAF and reference solid pin...249 Figure 9.6 Fission gas release calculations for various fuel pins...250 Figure 9.7 Relative decay power after discharge...251
List of Tables
Table 1.1 Evolution of the Westinghouse PWR fuel assembly ...5
Table 1.2 Pros and cons of high burnup fuel ...7
Table 1.3 Conceptual evaluations of four principal high-burnup schemes ...9
Table 2.1 The production cost reduction in going from 12 to 24 month cycles ...18
Table 2.2 Operating parameters for a typical Westinghouse 4-loop PWR...22
Table 2.3 Typical parameters in CASMO-4 runs ...39
Table 2.4 Optimum parameters for uranium utilization at fixed cycle lengths ...49
Table 2.5 Optimum parameters for SWU utilization at fixed cycle lengths...49
Table 3.1 MCNP-tallied one-group cross sections ...65
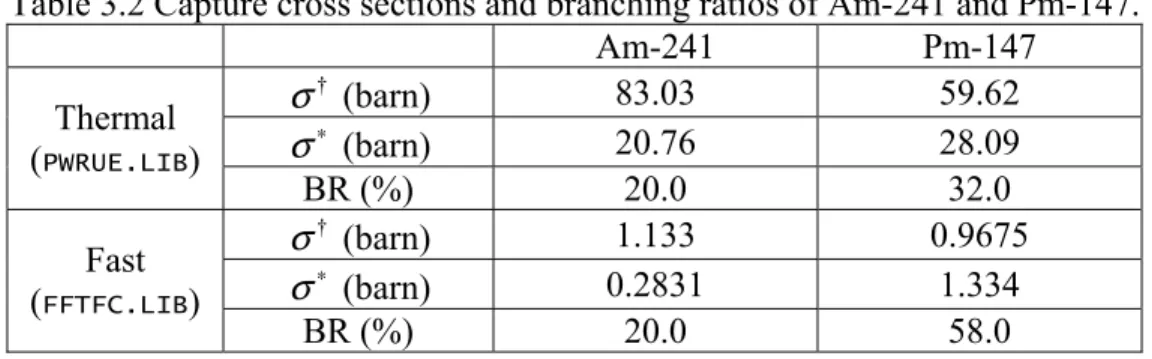
Table 3.2 Capture cross sections and branching ratios of Am-241 and Pm-147...67
Table 3.3 Numerical examples of various coupling schemes...72
Table 3.4 MCODE comparison with MOCUP and MONTEBURNS...73
Table 3.5 Pin cell model parameters (cold condition at 300 K) ...74
Table 3.6 Initial compositions (cold condition at 300 K) ...74
Table 3.7 Summary of benchmark codes...75
Table 3.8 The chosen 39 actinides in MCODE ...76
Table 3.9 The chosen 100 fission products in MCODE ...77
Table 3.10 Fractional differences of nuclide concentration at 100 MWd/kg ...81
Table 3.11 Recoverable energy per fission (MeV/fission) for important nuclides...85
Table 4.1 Comparison of PWR lattices...96
Table 4.2 Pin cell model parameters...98
Table 4.3 Optimum Height-to-Diameter ratios, H/D, for cylindrical reactor cores ...119
Table 4.4 Summary of alternative core design tradeoff scaling ...122
Table 5.1 Material properties of supporting matrices...130
Table 5.2 Neutronic parameter summary of supporting matrices...132
Table 5.3 CASMO-4 and MCNP results for IXAF and reference solid fuel at BOL...139
Table 5.5 Eigenvalues, contributing parameters, and reactivity feedback coefficients at
BOL ...146
Table 6.1 Poison-free, BOC core parameters for various designs (18-month cycle) ...162
Table 6.2 Fuel cycle limiting criteria...163
Table 6.3 Properties of boron, gadolinium, and erbium ...166
Table 6.4 Practically-considered ways of varying H/HM ...181
Table 7.1 High burnup spent fuel under consideration...194
Table 7.2 Comparison of 100 and 50 MWd/kg spent fuel characteristics...204
Table 7.3 Actinide compositions (wt%) in high-burnup spent fuel...205
Table 7.4 Plutonium isotope properties important to proliferation resistance...209
Table 7.5 Plutonium category divisions...210
Table 7.6 Approximate isotopic composition correlations for current PWR lattices with H/HM=3.4...210
Table 8.1 The fuel cycle economics parameters...222
Table 8.2 Fuel cycle cost comparison of different high burnup strategies ...229
Table 8.3 Revised fuel cycle cost comparison of different high burnup strategies ...236
Table 9.1 MCODE comparison with MOCUP and MONTEBURNS...241
Table 9.2 Comparison of strategies to achieve high burnup in PWR cores ...244
Table 9.3 Poison-free, BOC core parameters for various designs (18-month cycle) ...246
Abbreviations for Organizations
AEC Atomic Energy Commission (US) ANL Argonne National Laboratory (US) BNFL British Nuclear Fuels, Ltd. (UK)
CANES Center for Advanced Nuclear Energy Systems (MIT) DOE Department of Energy (US)
EPRI Electric Power Research Institute (US)
ERDA Energy Research and Development Administration (US) IAEA International Atomic Energy Agency
INEEL Idaho National Engineering & Environmental Laboratory (US) INER Institute of Nuclear Energy Research (Taiwan)
INPO Institute of Nuclear Power Operations (US) JAERI Japan Atomic Energy Research Institute (Japan)
KAERI Korea Atomic Energy Research Institute (Republic of Korea) LANL Los Alamos National Laboratory (US)
NEA Nuclear Energy Agency (OECD)
NRC Nuclear Regulatory Commission (US)
OECD Organisation for Economic Co-operation and Development ORNL Oak Ridge National Laboratory (US)
PNNL Pacific Northwest National Laboratory (US) TEPCO Tokyo Electric Power Co., Inc. (Japan)
Nomenclature
ACT actinides
AOA Axial Offset Anomaly
AOO Anticipated Operational Occurrence
AP activation products
at% atom percent
ATWS Anticipated Transients without Scram
BOC Beginning of Cycle
BOL Beginning of Life
BOR boron concentration
BP Burnable Poison
BWR Boiling Water Reactor
CERCER ceramic fuel particle dispersed in a ceramic matrix CERMET ceramic fuel particle dispersed in a metallic matrix
CHF Critical Heat Flux
CMS Core Management System
CR Conversion Ratio
CRD control rod
CZP Cold Zero Power
DNBR Departure from Nucleate Boiling Ratio DUPIC direct use of PWR spent fuel in CANDU EFPD Effective Full Power Day
EFPM Effective Full Power Month EFPY Effective Full Power Year
EOC End of Cycle
EOL End of Life
FBR Fast Breeder Reactor
FP fission product
H/HM Hydrogen to Heavy Metal Atom Ratio
HBWR Heavy Boiling Water Reactor
HFP Hot Full Power
HLW High-Level Waste
HTGR High Temperature Gas-cooled Reactor
HZP Hot Zero Power
IFBA Integrated Fuel Burnable Absorber
IHM Initial Heavy Metal
IMF Inert Matrix Fuel
IXAF Internally and eXternally-cooled Annular Fuel LMFBR Liquid Metal Fast Breeder Reactor
LOCA Loss of Coolant Accident LOFA Loss of Flow Accident LOHA Loss of Heat-sink Accident L3P Low Leakage Loading Pattern LRM Linear Reactivity Model
LWR Light Water Reactor
MCNP Monte Carlo N-Particle Transport Code
MCODE MCNP-ORIGEN DEpletion Program
MDNBR Minimum Departure from Nucleate Boiling Ratio METMET metallic fuel in metallic matrix
MOCUP MCNP-ORIGEN Coupled Utility Program MONTEBURNS Monte Carlo Burnup code
MOX mixed oxide (UO2 and PuO2) fuel
MSLB Main Steam Line Break
MTC Moderator Temperature Coefficient MTIHM Metric Ton Initial Heavy Metal
MWd/kgIHM MWd per kg IHM, equivalent to GWD per MTIHM
NFC Nuclear Fuel Cycle
O&M Operation and Maintenance
PCI Pellet-Cladding Interaction
PCMI Pellet-Cladding Mechanical Interaction
ppm part per million
PWR Pressurized Water Reactor
RCCA Rod Cluster Control Assembly
RGPu Reactor Grade Plutonium
rms Root Mean Square
SCWR Super Critical Water cooled Reactor SSP solid solution pellet (homogeneous)
SWU Separative Work Unit
TFU fuel temperature
TMO moderator temperature
VIPRE Versatile Internals and Component Program for Reactors; EPRI
WGPu Weapon Grade Plutonium
w/o weight percent
1. Introduction
“A journey of a 1000 miles begins with a single step” — Chinese Proverb
1.1 Background
Energy demand in developing nations is increasing to support their growing popu-lations and economies. In addition, as aging power plants in the United States and Europe are replaced, new electrical capacity is needed. Generally speaking the demand will be met by a combination of fossil, renewable, and nuclear energy sources. However, there are specific problems associated with currently existing energy sources.
Fossil-fueled energy leads to accumulation of greenhouse gases (global warming issue). It is shown in Figure 1.1 [1] that atmospheric carbon dioxide (CO2) concentration
has increased more than 30% since industrialization (about 1800) while the CO2 level
before 1800 is almost constant. Fossil resources, such as coal, oil, and natural gas, are also very rare in many areas.
Some renewable energy resources, such as hydro, are in limited supply; and oth-ers, such as wind power, are of intermittent nature, while some are not technologically mature. Most renewable energy options, such as solar and wind power, are by nature very dilute (low power density), which significantly increases the cost. However, although not competitive under current market conditions, those options are well supported by gov-ernments and the public.
Nuclear power, as an economical, safe, and clean energy source, is one promising option (perhaps the only option) capable of large-scale and short-term deployment. In addition, nuclear power can be used for hydrogen production [2], which is able to both decrease the operation & maintenance (O&M) cost by adopting a mode of operations that is not as limited by regional and seasonal electricity requirements and produce a clean energy inventory in the form of hydrogen. By 2050, hydrogen, not electricity, may be the largest long-distance energy carrier [3]. However, there are several challenges facing future possible expansion of nuclear energy:
1. economic viability — Nuclear power has to be economically competitive with other energy sources. In particular, future nuclear power plant development should take into consideration the advances in technology of all other energy sources and the de-regulated electricity market. Better engineering approaches need to be devised so that both the high capital cost and the long construction time can be reduced. This is a fundamental commercial constraint on nuclear energy.
2. spent fuel & proliferation resistance — The spent fuel issue needs to be actively stud-ied and resolved. The cost of storage, handling, and disposition of spent fuel should be better defined and incorporated into current nuclear fuel cycle economics with less uncertainty. More practical guidelines for the back end of the nuclear fuel cycle need to be discussed and finalized. The proliferation potential of both the front end of the fuel cycle and of spent fuel needs to be minimized especially when nuclear power is more widely spread around the world in the future. This unique feature of nuclear power is the main focus of governments.
3. public acceptance — Nuclear power must improve public confidence by continuing to demonstrate a long history of safe operation. Also the safety issue in nuclear power is very closely related to its economic performance since reliability signifies reduced occurrence of precursor events which might lead to more severe consequences.
1.2 High Burnup Review 1.2.1 UO2 Fuel
Almost all LWRs are using uranium dioxide (UO2) as fuel except that some nuclear
power plants are fueled partially with mixed oxide fuel (MOX), i.e., PuO2 mixed with
UO2. Nevertheless, uranium is the major fuel in the form of UO2. Compared to other fuel
forms, such as the metallic U/Zr alloy, there are distinct advantages of UO2 fuel, such as
its high chemical/irradiational stability, high melting temperature, and the ease of fabrica-tion (low cost) [4]. Hence, uranium dioxide fuel is the primary form considered for high burnup fuels.
Figure 1.2 Historical discharge burnup trend over the 1980-2000 period (PWR) [5].
The basic issue of UO2 fuel associated with its high burnup characteristics is its
U-235 enrichment level, which is closely related to the total fuel cost. The historical trend has shown an increase in discharge burnup, e.g., the average increase of discharge burnup in the 1990s is about 1 MWd/kg per year for PWRs as shown in Fig. 1.2 [5]. The high
burnup was a strategy to respond to nuclear energy economics by improving fuel utiliza-tion. This was mainly achieved by increasing the average reload UO2-fuel enrichment
from ~2.5 w/o in the 1970s to ~4 w/o today. The UO2 fuel licensing enrichment limit is,
however, set by the US Nuclear Regulatory Commission (NRC) as 5 w/o for current fuel fabrication plants. Increasing this to enable higher burnup needs to be scrutinized because this will involve significant changes in the supporting front-end infrastructure of the nu-clear fuel cycle. For example, enrichment facility operators need to re-examine their criti-cality precautions and enrichment (separative work unit, SWU) capability. However, this licensing limit is not a technical barrier but an arbitrarily-defined conservative enrich-ment limit for the front end of the LWR fuel cycle from a criticality safety perspective. Another consideration governing the fuel enrichment limit is proliferation resistance. It is obviously easier to divert higher enriched fresh UO2 fuel to weapon usage. The U-235
enrichment deemed to be significant in this regard is 20 w/o, which sets the upper en-richment limit. In addition, the International Atomic Energy Agency (IAEA) has promul-gated another enrichment limit, 10 w/o, as a technical barrier against proliferation poten-tial [6]. Therefore, the typical enrichment level used in the present work is 9.75 w/o unless otherwise specified. This represents a conservative ceiling on the highest desirable enrichment under strict proliferation constraints.
1.2.2 Literature Review
As seen in Fig. 1.2, fuel burnup has been gradually increased over the past twenty years. In fact, this trend of pursuing higher discharge fuel burnup persists ever since the first large scale commercial PWR of Yankee Rowe in 1960. In the early 1970s the average burnup for a PWR in the US was about 20 MWd/kg. In the late 1970s discharge burnups in the 33 MWd/kg range were achieved. Table 1.1 summarizes the Westinghouse PWR fuel assembly evolution before 1985 under the influences of technological progress as well as the economic, political, and regulatory environment [7]. Few global assembly design changes have been made since then.
Table 1.1 Evolution of the Westinghouse PWR fuel assembly [7].
Date Design Feature Primary Impacts Comment
1963 Grid Springs Economics Enable separate rod and assembly fabrication, eliminate brazing, reduce parasitic absorption
1965 Mixing Vanes Licensing Improve DNB margin 1967 Rod Cluster Control Economics
Reliability Minimize water slot peaking; further reduce parasitic material 1967 Improved Grid Licensing
Reliability Further improve DNB margin, provide better rod support; improve control of channel spacing; change to Inconel to improve spring characteristic
1968 Zircaloy Clad Economics Further reduce parasitic material 1968 Helium Prepressurization Reliability Minimize fuel clad interaction
poten-tial; preclude rod flattening 1971 Zircaloy Thimbles Economics Further reduce parasitic material 1975 17×17 Fuel Array Licensing Reduce peak kW/ft; reduce calculated
LOCA temperature; reduce rod duty 1981 Reconstitutable Bottom
Noz-zle Reliability Simply assembly repair or rod re-placement 1982 Optimized Fuel Assembly
(Smaller diameter rods, Zir-caloy grids, increased burnup)
Economics Further reduce parasitic material; improve fuel cycle economics 1984-85 VANTAGE 5
(Axial blankets, IFBA, RTN, IFM, increased burnup)
Margin Flexibility Economics
Improved neutron economy, increased DNB and LOCA margin, facilitate repair/removal
At MIT, there have been efforts to design long operating cycle LWR cores in the 1990s in order to improve the economic performance by increasing the plant capacity factor. Reload core designs for a 38.8-effective-full-power-month (EFPM) PWR cycle and a 45-EFPM BWR cycle were developed by M. V. McMahon to offer nuclear utilities the opportunity for economic benefit by permitting higher plant capacity factors and by reducing the number of costly refueling operations that must be performed [8]. The de-signs use a single-batch loading strategy to stay within current fuel burnup licensing lim-its of 60 MWd/kg and contain fuel enrichment as high as 7.4 w/o. However, an economic analysis of these cores shows that extended-cycle cores do not offer a significant eco-nomic benefit over conventional practice.
In a later detailed economic study [9], it was recognized that the extra fuel costs that would be incurred from implementing an extended cycle would stem from the in-creased enrichment necessary to maintain criticality for the life of the core. Multi-batch refueling is more economical than single-batch fueling for cycle lengths not in the ultra-long range, i.e., 48 calendar months for the PWR. The current 3-batch fuel management, 18-month PWR is about the optimum. Unless quite substantial improvements in
technol-ogy are forthcoming or economic circumstances change significantly, departure from two- to four-batch management or longer than 2- to 3-yr cycles in LWRs is not economi-cally attractive compared to current industry practice [10, 11].
Since parametric studies indicated that the economically optimum length for a PWR, single-batch core is about 36 calendar months, such a PWR core was then designed by L. Garcia-Delgado [12]. Fuel was enriched to 6.5 w/o and gadolinia selected as the burnable poison mixed with UO2. This 36-month core is economically competitive with
an 18-month reference core under certain operational conditions.
Besides the work done at MIT, there has been an EPRI study (so-called robust fuel program) on optimizing LWR cycle length and fuel burnup [13]. It was shown that for the 18-month cycle of a PWR core, fuel costs decline by about 4.2% as the batch av-erage discharge burnup increases from about 49,900 to 53,800 MWD/MT.
In addition, some fuel testing activities on high burnup (> 50 MWd/kg) are in progress in the heavy boiling water reactor (HBWR) at Halden [14]. Both urania and MOX fuels are being studied regarding thermal behavior, conductivity degradation, and aspects of fission gas release. This activity demonstrates continued commercial interest in further improving fuel burnup.
1.3 Motivation 1.3.1 Incentives
After a brief review of the historical trend of increasing discharge burnup for PWRs via an enrichment increase, the motivation for pursuing high burnup and potential barriers to achieve this goal is clear and readily summarized in Table 1.2 (assuming a once-through fuel cycle). In summary high burnup holds the promise of reduced fuel cycle cost, smaller reload core fractions, longer cycle lengths, and decreased spent fuel storage requirements for the once-through fuel cycle [15]. High burnup is now a common design characteristic of Generation-IV reactors [16].
Table 1.2 Pros and cons of high burnup fuel.
UNIVERSAL BENEFITS COMMON CHALLENGES
1. Reduced number or size of assem-blies per MWe⋅yr, hence reduced fuel handling, storage, transporta-tion, and disposal
2. Less Pu in spent fuel per unit energy derived and poorer weapon-usable isotopics
3. Better utilization of resources
1. Reactivity control due to excess fis-sile material in an extended cycle 2. Cladding corrosion for longer cycles 3. Fission gas release
4. Higher dose and heat rate per kg of spent fuel, hence longer on-site stor-age for decay (for current canisters) 5. Higher enrichment requires upgrade
and relicensing of front end facilities The reduction of spent fuel (both volume and mass) is a key advantage for high burnup strategy when considering its broad implications to the back-end fuel cycle, par-ticularly under the once-through fuel cycle constraint. As mentioned in the previous sec-tion, nuclear waste has been one of the major challenges that limit the future potential of nuclear expansion. There is widespread public concern about spent fuel radiological haz-ards and its potential escape to the bio-sphere. In the US, the Yucca Mountain site in Ne-vada was designated by law to be the candidate geologic disposal site. However, the ca-pacity of Yucca Mountain is limited. Therefore, a high burnup strategy is an important approach to effectively increasing the capacity of the repository by reducing the genera-tion of spent nuclear fuel.
From a proliferation point of view, high burnup spent fuel possesses a higher ra-dioactivity inventory and has better proliferation resistance. Generally speaking more fission products are accumulated in the high burnup spent fuel, which act as an additional technical barrier for diverting the spent fuel. The plutonium in the high burnup spent fuel (a sensitive nuclear material) is less desirable in terms of both the radiation barrier and its isotopic composition (more Pu-238 and Pu-240). In fact, if one could achieve full burnup (destroy all the heavy metal), proliferation would not be an issue.
On the other hand, high burnup fuel poses a challenge on the materials side, namely, more cladding corrosion (higher neutron fluence and/or longer in-core time) and increased fission gas release from the fuel pellet [17, 18]. The traditional Zircaloy, the current cladding material, has almost reached its technological limits. New cladding ma-terials, such as the M5 solid-wall alloy developed at Framatome-ANP, have much better corrosion performance [5]. Other fuel vendors and laboratories also have advanced
zirco-nium-based alloys under development. The increased fission gas release also needs to be considered for appropriate fuel pin design. Overall, these material barriers constitute ma-jor technical difficulties in achieving higher burnup.
1.3.2 High-Burnup Implementation
It should also be realized that “high burnup” is not really a rigorous concept but a subjec-tive one. For various groups, at different times, or in different regions, the term high bur-nup might have significantly different values. In particular, countries which reprocess and recycle LWR fuel might come to different conclusions than the US (which currently de-ploys only the once-through fuel cycle). In addition, the word “burnup” is imprecise. For example, in the fuel management field, the burnup usually refers to the batch-averaged discharge burnup. In contrast, the fuel analyst pays more attention to the so-called peak pin, which has the highest burnup among all fuel pins. Fundamentally, the definition of burnup is the energy production associated with a unit mass of initial heavy metal within specific regions. For example, the assembly has its average burnup and each pin in the assembly also has its individual burnup. Since the energy production is directly related to revenue for utilities, the burnup concept is an important measure of the value of the fuel. The essence of high burnup is to extract more energy from the same mass of initial heavy metal, i.e., more efficient usage of nuclear fuel, which results in more consumption of U-235 and better utilization of plutonium produced during operations.
There are four principal specific options, starting from conventional PWRs, by which to exploit high burnup capability (Table 1.3):
I. Increase cycle length at the same linear power, using the current 3-batch fuel man-agement scheme;
II. Keep current cycle length and linear power, increase the number of batches; III. Design a very long life core with single-batch refueling at reduced power density; IV. Increase power density, burn faster, keep the same cycle length and refueling rate. Each has its particular advantages and disadvantages. Options I and II are retrofitable into current LWR cores, and options III and IV are likely to be acceptable for new cores only.
Table 1.3 Conceptual evaluations of four principal high-burnup schemes.
Option UNIQUE BENEFITS SPECIAL CHALLENGES
I.
longer cycle
9 Save on refueling expenses Harder to meet power peak-ing limits
Need more control poison
RETROFIT
CORES II. more batches
9 Reduced ore and SWU per MWe⋅yr (relative to Option I, but not vs. current practice) 9 More fuel shuffling options;
reduced reactivity difference between assemblies and over the core
Fewer than other options
III.
single batch
9 Improved institutional safe-guards
9 Reduced on-site operations and staffing
9 Large refueling saving
More expensive fuel
Need more control poison or higher conversion ratio (lat-ter further increases fuel costs) NEW CORES IV. increase power density
9 Save on carrying charges 9 Possible to reduce core
vol-ume
9 Shorter clad exposure in re-actor compared to I,II,III
Need new fuel pin and as-sembly design
Harder to meet thermal hy-draulic limits (DNBR, LOCA, fuel melt)
1.4 Objectives
The primary objectives of the work reported here are to determine the neutroni-cally-achievable high burnup potential and to identify viable high burnup core designs taking into consideration the operational neutronic parameters (such as reactivity control and feedback), engineering constraints (such as thermal hydraulics and fuel performance) and other important aspects (such as spent fuel characteristics, proliferation resistance, nuclear fuel cycle economics, etc.). For a conventional PWR core and fuel design, i.e., existing plants, there is a very limited design space to increase burnup. The most effective way is to increase the average reload enrichment (higher initial reactivity), which needs detailed analysis/verification in order to satisfy NRC safety regulations. However, when taking a broader view, one should optimize the lattice design to achieve high burnup. In addition, various new fuel options, including annular fuel with or without internal cooling, and new fuel material compositions, such as CERCER, CERMET or METMET, need to be considered. The overall strategies for design and deployment of high burnup cores
need to be addressed and analyzed. The impact of high burnup fuels on the contemporary fuel cycle in a sustainable environment also needs to be assessed.
In summary, the effort is targeted at a full exploration of high burnup fuel charac-teristics and the strategies of developing and utilizing high burnup fuels in PWRs. Note that although various options are investigated, none of them is optimized. Therefore, the present strategic study is not intended to propose a detailed new design, but to identify the directions that have the best potential for providing a satisfactory design.
1.5 Analysis Tools
As a relatively mature subject, there are many modern computer codes available to perform various tasks in reactor design calculations. Although a purely analytic solu-tion to the fundamental full-scope neutron transport equasolu-tion with generalized boundary conditions is still unknown, computer simulation codes can provide sufficiently accurate numerical solutions for a given problem when measured against real plant operating data. For example, the maximum error of SIMULATE-3 predictions of a typical LWR core power distribution is within 5% of a nuclear power plant’s measured data through the entire cycle [19]. Therefore, with these advanced tools, reactor core design and evalua-tion are feasible and conclusions/insights/findings can be based on those calculaevalua-tions reliably. In reality, nuclear utilities usually perform calculations beforehand and use the resulting output as guidance in operating reactors.
In the following, several state-of-the-art codes, which are utilized in the present work, are introduced:
1.5.1 Studsvik Core Management System (CMS) Code Package
The Studsvik (now called Studsvik Scandpower Inc. after merging with another reactor physics code developer) Core Management System (CMS) code package consists of CASMO-4 [20], TABLES-3 [21], and SIMULATE-3 [22]. Combined together, these licensing-level, commercial codes are capable of performing LWR core reload analysis and are being widely used by utilities to do routine fuel management calculations. Figure 1.3 shows the tandem way of running the CMS code package, i.e., CASMO-4 (lattice
code) generates two-group cross sections and other parameters (such as discontinuity factors) for each type of assembly, TABLES-3 then reads CASMO-4’s card image files (.cax) and transfers them into a binary-format library; then SIMULATE-3 (advanced
nodal code) can perform core reload analysis (different core loading patterns) based on the generated library. Each of the CMS codes is described in the following paragraphs.
CASMO-4 .inp
.cax TABLES-3 .lib SIMULATE-3
.inp .inp
.out
Figure 1.3 Flow of calculations for the CMS code package.
CASMO-4 is a multi-group two-dimensional transport code entirely written in FORTRAN 77. As a deterministic lattice physics code, it is used for burnup calculations of LWR assemblies or pin cells. The code can represent geometries consisting of cylin-drical fuel rods of varying compositions in a square/hexagonal lattice. Version 4 of CASMO uses the iterative, 2-dimensional characteristic solution KRAM [23], which solves the 2-dimensional Boltzmann transport equation in the fully heterogeneous lattice to give the flux distribution. This represents a significant improvement from previous versions of CASMO, which are all based on entirely traditional collision probability methods.
TABLES-3 is a data processing code which links CASMO to SIMULATE. The code processes the following types of data from CASMO output card image files to gen-erate a binary SIMULATE-readable library: two-group cross sections, discontinuity fac-tors, fission product data, detector data, pin power reconstruction data, kinetic data, and isotopics data.
SIMULATE-3 is a two-group, three-dimensional (steady-state) modern nodal code, which can be used to perform in-core fuel management studies, core design
calcu-lations, and calculation of safety parameters. The code itself is an example of the success of advanced modern nodal methods, which are formulated consistently and without any adjustable parameters to match reference solutions. Detailed comparisons with critical assembly measurements have demonstrated that PWR pin-by-pin power distributions have root mean square (rms) differences of about 1.0% relative to measured data. Peak pin powers were predicted with rms differences of less than 0.5% relative to measured data [19].
1.5.2 MCNP-4C
MCNP [24] is a general purpose, generalized-geometry, continuous-energy, coupled neu-tron/photon/electron Monte Carlo N-Particle transport code developed at the Los Alamos National Laboratory (LANL). The stochastic model is pre-eminently realistic (a theoreti-cal experiment) where the spatial and energy treatments are in principle exact. Therefore, given sufficient neutron histories and appropriate cross section libraries, MCNP solves the neutron transport equation exactly for any type of reactor. Unlike deterministic codes, such as CASMO-4, MCNP is, in principle, universally applicable to any transport calcu-lation (for example not limited to LWRs). In this sense, it is the best transport code avail-able today.
The only disadvantage of MCNP compared to deterministic codes is its demand-ing CPU requirements. For example, in order to obtain acceptable statistical variations, hours of MCNP calculations are usually needed whereas CASMO-4 takes only seconds.
1.5.3 ORIGEN2
ORIGEN2.1 [25] is a one-group, point depletion and radioactive decay code developed at the Oak Ridge National Laboratory (ORNL). Instead of solving the complicated neutron transport equation like CASMO-4 and MCNP, ORIGEN2.1 uses a relatively unsophisti-cated one-group neutronics calculation focusing on the detailed isotopic composition calculations. Typically a total of 1700 nuclides are considered including 130 actinides, 850 fission products, and 720 activation products. Therefore, in terms of isotopic repre-sentation, ORIGEN2.1 is complete. The code is ideal for calculating spent fuel character-istics (composition, thermal power, radioactivity, toxicity, etc.). However, for burnup
calculations, an advanced physics code is needed to adjust the effective one-group cross section library to represent correct neutron spectrum.
1.5.4 MCODE
The MCNP-ORIGEN DEpletion program (MCODE) is an MCNP-ORIGEN linkage code developed by the author, which combines the continuous-energy Monte Carlo code, MCNP-4C, and the one-group depletion code, ORIGEN2.1, to perform burnup calcula-tions. MCNP is capable of providing the neutron flux and effective one-group cross sec-tions for different MCNP-defined regions. ORIGEN, in turn, carries out multi-nuclide depletion calculations for each region and provides material compositions to update be-ginning-of-timestep MCNP input. This console program is entirely written in ANSI C. Chapter 3 will present in detail the development as well as the verification of the code.
1.5.5 VIPRE
VIPRE (Versatile Internals and Component Program for Reactors; EPRI) [26] was devel-oped for nuclear power utility thermal-hydraulic analysis. The code was designed to help evaluate LWR core safety limits including minimum departure from nucleate boiling ratio (MDNBR), critical power ratio (CPR), fuel and clad temperatures, and coolant state in normal operation and assumed transient conditions by solving the set of finite-difference conservation equations for mass, energy and momentum of the coolant in in-terconnected subchannels, assuming incompressible thermally expandable homogeneous flow. Although the formulation is based on a homogeneous coolant for each finite vol-ume, non-mechanistic models are included for sub-cooled boiling and vapor/liquid slip in two-phase flow.
VIPRE modeling structure is based on subchannel analysis. The core, fuel bundle or any other section of symmetry is defined as an array of parallel flow channels with lateral connections between adjacent channels. A channel may represent a small area be-tween fuel rods or a larger area representing several assemblies. The shapes and sizes of these subchannels are arbitrary, depending on the expected level of detail in the analysis. In areas where the fuel design is expected to be critical, the fuel is analyzed in detail, while in the rest of the core average values are good enough. The code is tailored to the utilities’ analytical requirements in fuel reload analysis, allowing for example the use of
several critical heat flux (CHF) correlations, and having the capability to iterate operating conditions to attain a given MDNBR (safety requirement), and to include thermal trans-port within fuel rods including a gap conductance model.
1.5.6 FRAPCON-3
FRAPCON-3 [27] is a fuel performance code for calculating steady-state fuel behavior at high burnup (up to 65 MWd/kg) developed jointly by Pacific Northwest National Labora-tory (PNNL) and Idaho National Engineering & Environmental LaboraLabora-tory (INEEL). Based on a single channel coolant enthalpy rise model, the code iteratively calculates the interrelated effects of fuel and cladding temperature, rod internal gas pressure, fuel and cladding deformation, fission gas release, fuel swelling and densification, cladding ther-mal expansion and irradiation-induced dimensional changes, cladding corrosion, and crud deposition as functions of time and fuel rod power.
1.6 Thesis Organization
This report is structured in nine chapters. This chapter (Chapter 1) begins with a rudimentary introduction of the background, high burnup review, motivation, objectives, and analysis tools used. The central idea in this effort is to investigate the strategy of high burnup fuels using a PWR as an example.
Chapter 2 then looks at current existing standard Westinghouse PWRs and inves-tigates operational limitations, material challenges, and economic implications of the high burnup approach. This serves as a basic review of where PWR core features stand today and some practical limits that need to be considered. Conventional core neutronic calcu-lations are also performed to scope out the operating regimes of various approaches. It is concluded that within the retrofit cores the high burnup approach of more batches is pre-ferred.
Chapter 3 presents the development of MCODE in order to perform high burnup neutronic calculations for a wide range of options. High burnup, itself, is a challenge for the neutronic calculations due in part to the more complex fuel compositions at higher burnup. State-of-the-art reactor physics codes have been tuned to deal with conventional
burnups. It is thus necessary to have at least one or two reference calculations to verify results. Detailed benchmark calculations against CASMO-4 and HELIOS have been done, which show satisfactory agreement, i.e., when predicting the full-power operating time of the 18-month cycle the difference is only about 3 days.
Chapter 4 discusses the major parameter, moderator-to-fuel ratio, in UO2/H2O
lattices. Since light water is used as both a coolant and a moderator, a useful parameter is the hydrogen-to-heavy-metal (H/HM) ratio. A virtual experiment, varying water density from its value in a standard Westinghouse PWR lattice, is performed and promising H/HM ranges are identified for high burnup applications. In addition to conventional ura-nium fuel, various fissile/fertile combinations, such as U-235/Th-232 and Pu-239/U-238, are briefly examined.
Chapter 5 turns to alternative advanced fuel options to achieve a wetter lattice, including annular fuel with or without internal cooling, CERCER, CERMET, and METMET fuel compositions. Although the wetter lattice has an increased burnup, a re-duction of the energy prore-duction is observed for all these cases due to smaller core heavy metal loadings. Again the examination is still focused on neutronic characteristics.
Chapter 6 considers practical issues & constraints including the reactivity control and engineering constraints in lattice optimization. The reactivity control of high-burnup wetter cores poses a challenging problem. Burnable poison and soluble poison are inves-tigated. Design changes, including axial heterogeneity and annular fuel, are discussed as a possible way to reduce the reactivity swing. Thermal margins and fuel aspects are ad-dressed in engineering considerations for various approaches tried to effectively vary H/HM, such as internally cooled annular fuel and thinner rods.
Chapter 7 is devoted to the spent fuel issue for various H/HM lattices. The waste disposal characteristics are compared for various burnups. The effect of power uprate is discussed from the spent fuel perspective. The technical proliferation resistance barrier is also addressed in terms of plutonium vector. Finally wetter lattices are recommended for high burnup applications.
Chapter 8 is an overall assessment of the impact of high burnup on the contempo-rary nuclear fuel cycle. Various parts of the fuel cycle are discussed in regard to their response to higher fuel burnup, and an economics assessment is included.
Chapter 9 summarizes the work done, provides concluding remarks and makes recommendations for future work.
2. High Burnup Issues of Current PWR Designs
“Much effort, much prosperity” — Euripides (485BC-406BC)
2.1 Introduction
The current fleet of commercial PWRs (69 operating reactors as of 2002 in the US, 212 units worldwide as of 2002 [28]), mostly built in the 1970s, has demonstrated excel-lent safety features and economic performance as large centralized power suppliers in today’s electricity market. In the US, there has been only one major reactor accident lead-ing to severe core damage: at Three Mile Island in 1979, which had essentially no envi-ronmental impact and no public injuries because of the preservation of the high-integrity reactor containment. Since then, a series of advanced reactors, such as the Westinghouse AP600/AP1000, have been designed and evaluated with emphasis on: (1) passive or in-herent safety, (2) short construction time with simplified design, (3) one-step licensing, and (4) standardization. However, no advanced reactors have been built in the US to date and it is expected that many current PWRs can successfully extend their operating li-censes from their original 40 years to 60 years or more. For instance, recently the operat-ing licenses of Turkey Point-3 and -4 (two PWRs, each rated at 693 MWe), located in Florida City, FL, were renewed for an additional 20 years by the NRC [29]. Therefore, in this Chapter, the discussion of high burnup issues is focused on these conventional PWRs, which represent substantial assets and extensive industry practices.
Economic competitiveness is naturally of primary interest to utilities. Generally speaking the busbar electricity cost in the OECD countries can be decomposed into three components: capital cost (57%), operation & maintenance (O&M) cost excluding fuel (23%), and nuclear fuel cycle (NFC) cost (20%) [30]. Note that the given nuclear elec-tricity cost breakdown is typical for current PWRs and will be different for a new plant. The capital cost accounts for more than half of the busbar cost, but it is a fixed sunk cost. The sum of the O&M cost and the nuclear fuel cycle cost is also called the production
cost, which is affected by fuel management strategy. The O&M cost, in principle, should increase with time due to plant aging. Meanwhile, there are other factors, such as accu-mulation of operating experience, advancing technological innovations, increasing oper-ating cycle lengths, etc., which should more or less compensate for any increasing trend. The fuel cycle cost is primarily determined by the details of fuel management. In turn, there are many choices available to improve the production cost, which takes into account the lost revenue due to refueling downtime and the purchase of replacement energy∗. High burnup, as a common factor, provides necessary operational flexibilities. Three ma-jor high burnup strategies have been realized in industry:
1. Increasing the cycle length by loading more fresh fuel and/or the same amount at higher enrichment, which leads to fewer refueling outages and gives rise to higher ca-pacity factors. Historically the cycle length has increased from 12 months to nowa-days 18 months or even 24 months. In fact, the longer cycle length increases the fuel cycle cost [31]. For example, the fuel cycle cost of an 18-month cycle is about 10% more expensive than a 12-month cycle. However, this can be compensated by the savings in O&M cost due to improved capacity factor (as shown in Table 2.1 [32]). In addition, the less frequent refueling outages also decrease the radiation exposure to workers, production of low-level waste and potential radiation release to the envi-ronment.
Table 2.1 The production cost reduction in going from 12 to 24 month cycles [32].
Dollars Per Year
Increased fuel cycle costs: $ 4.7 million
Savings due to:
Replacement power $ 8.5 million
Refueling labor $ 1.5 million
Cycle design/licensing $ 0.2 million $ 10.2 million
Net gain $ 5.5 million
aFor a 950 MWe PWR plant.
2. Increasing the discharge burnup by increasing reload fuel enrichment for fixed cycle length (say 18 months). This strategy implies constant O&M cost. The savings come from the nuclear fuel cycle cost due to the reduction in fuel assemblies required and
∗ Under a deregulated electricity market, there is generally no obligation for nuclear utilities to purchase
more efficient fuel utilization (more batches). It is shown later in this chapter that there is an optimum reload fuel enrichment (around 5 w/o) with minimum fuel cycle cost (actually best utilization of uranium resources) under the once-through fuel cycle constraint. The industry practice is now close to the optimum point. As pointed out in Chapter 1, this approach is the main way of achieving high burnup when limited by the 5 w/o enrichment limit. In this way, spent fuel storage requirements are also alle-viated due to the reduction in the number of discharged assemblies.
3. Increasing the rated power to sell more electricity (hence accrue more revenue) with acceptable costs, i.e., affordable changes to the plant itself. For the same cycle length and number of reload assemblies, a power upgrade can also save carrying charges by burning fuel faster (again higher fuel enrichment is needed). Uprating is currently an attractive approach with utilities, particularly under the current deregulated electricity market environment. Nuclear plant upratings result in plant power increases of up to 10 to 20 percent, which reinforces the economic viability of nuclear power (the mar-ket value of added energy) [33].
In reality, all three options can be adopted simultaneously in the same reactor. A common feature is that the increased fuel enrichment is the driving engine to achieve a higher bur-nup by increasing the initial reactivity. In responding to these strategies, new fuel assem-bly designs have been introduced by increasing the number of fuel rods in an assemassem-bly. The PWR fuel assembly lattice has increased from 14×14/15×15 to 16×16/17×17 and even 18×18/19×19 in European countries. The larger number of fuel rods increases the total heat transfer area although fuel rod diameters are slightly reduced, which results in a lower linear heat rate (lower fuel temperature) and a lower surface heat flux (more mar-gin to DNBR) for a fixed core power output. The low fuel temperature is beneficial in reducing both the stored energy in fuel pellets (lower clad temperature following a LOCA accident) and the thermal expansion of pellets (less pellet-cladding interaction, PCI) [34].
In a core reload analysis, an important focus is the minimization of power peaking. In this regard, loading more fresh fuel assemblies with lower fuel enrichment is helpful although it will increase the fuel cycle cost. There is a trade-off between managing core power peaking and choosing the number of reload assemblies. Typically for each reload, several types of fuel assemblies are used (so-called split batches) while the maximum uranium enrichment is limited by 5 w/o. The split batch technique can both alleviate the
core peaking control and accommodate different core residence time within the same re-load fuel assemblies. Hence, there is not much option space under the current enrichment limit (5 w/o) as shown in Fig. 2.1 [5] since the maximum U-235 enrichment is already very close to 5 w/o. The discussions in this chapter, therefore, will not be restricted by the NRC limit but will stay within the 20 w/o proliferation limit.
Figure 2.1 Uranium-235 enrichment over the 1976-2000 time period [5].
In this Chapter, a typical Westinghouse 4-loop PWR (the dominant type in the PWR category) will be taken as the reference case. A full range of scoping calculations for fuel between 3 and 20 w/o enrichments are performed for this reference case. The op-erating/design/licensing limits and safety features related to high burnup are then dis-cussed. Various challenges and opportunities, such as materials limitations, economic penalties/gains, are addressed as high burnup issues for conventional PWRs.
![Figure 2.3 Control bank insertion limits versus percent rated thermal power [36].](https://thumb-eu.123doks.com/thumbv2/123doknet/14722369.570714/45.918.142.784.210.820/figure-control-insertion-limits-versus-percent-rated-thermal.webp)
![Figure 2.5 Margins of high burnup cores (right) compared to standard PWR (left) [45].](https://thumb-eu.123doks.com/thumbv2/123doknet/14722369.570714/56.918.215.702.86.331/figure-margins-high-burnup-cores-right-compared-standard.webp)