HAL Id: inserm-02879963
https://www.hal.inserm.fr/inserm-02879963
Submitted on 24 Jun 2020
HAL is a multi-disciplinary open access
archive for the deposit and dissemination of
sci-entific research documents, whether they are
pub-lished or not. The documents may come from
teaching and research institutions in France or
abroad, or from public or private research centers.
L’archive ouverte pluridisciplinaire HAL, est
destinée au dépôt et à la diffusion de documents
scientifiques de niveau recherche, publiés ou non,
émanant des établissements d’enseignement et de
recherche français ou étrangers, des laboratoires
publics ou privés.
CDKN2C as a HBV host factor
Carla Eller, Laura Heydmann, Che Colpitts, Houssein El Saghire, Federica
Piccioni, Frank Jühling, Karim Majzoub, Caroline Pons, Charlotte Bach, Julie
Lucifora, et al.
To cite this version:
Carla Eller, Laura Heydmann, Che Colpitts, Houssein El Saghire, Federica Piccioni, et al.. A
genome-wide gain-of-function screen identifies CDKN2C as a HBV host factor. Nature Communications,
Nature Publishing Group, 2020, 11 (1), pp.2707. �10.1038/s41467-020-16517-w�. �inserm-02879963�
A genome-wide gain-of-function screen identi
fies
CDKN2C as a HBV host factor
Carla Eller
1,11
, Laura Heydmann
1,11
, Che C. Colpitts
1,2
, Houssein El Saghire
1
, Federica Piccioni
3
,
Frank Jühling
1
, Karim Majzoub
1
, Caroline Pons
4
, Charlotte Bach
1
, Julie Lucifora
4
, Joachim Lupberger
1
,
Michael Nassal
5
, Glenn S. Cowley
3
, Naoto Fujiwara
6
, Sen-Yung Hsieh
7
, Yujin Hoshida
6
,
Emanuele Felli
1,8
, Patrick Pessaux
1,8
, Camille Sureau
9
, Catherine Schuster
1
, David E. Root
3
,
Eloi R. Verrier
1,12
✉
& Thomas F. Baumert
1,8,10,12
✉
Chronic HBV infection is a major cause of liver disease and cancer worldwide. Approaches for
cure are lacking, and the knowledge of virus-host interactions is still limited. Here, we
per-form a genome-wide gain-of-function screen using a poorly permissive hepatoma cell line to
uncover host factors enhancing HBV infection. Validation studies in primary human
hepa-tocytes identi
fied CDKN2C as an important host factor for HBV replication. CDKN2C is
overexpressed in highly permissive cells and HBV-infected patients. Mechanistic studies
show a role for
CDKN2C in inducing cell cycle G1 arrest through inhibition of CDK4/6
associated with the upregulation of HBV transcription enhancers. A correlation between
CDKN2C expression and disease progression in HBV-infected patients suggests a role in
HBV-induced liver disease. Taken together, we identify a previously undiscovered clinically
relevant HBV host factor, allowing the development of improved infectious model systems for
drug discovery and the study of the HBV life cycle.
https://doi.org/10.1038/s41467-020-16517-w
OPEN
1Université de Strasbourg, Inserm, Institut de Recherche sur les Maladies Virales et Hépatiques UMR_S1110, F-67000, Strasbourg, France.2Department of Biomedical and Molecular Sciences, Queen’s University, Kingston, ON, Canada.3Broad Institute of Massachusetts Institute of Technology and Harvard, Cambridge, MA, USA.4Inserm, U1052, Cancer Research Center of Lyon (CRCL), Université de Lyon (UCBL1), CNRS UMR_5286, Centre Léon Bérard, Lyon, France.5Department of Internal Medicine II/Molecular Biology, University Hospital Freiburg, Freiburg, Germany.6Liver Tumor Translational Research Program, Simmons Comprehensive Cancer Center, Division of Digestive and Liver Diseases, Department of Internal Medicine, University of Texas Southwestern Medical Center, Dallas, TX, USA.7Department of Gastroenterology and Hepatology, Chang Gung Memorial Hospital, Taipei, Taiwan.8Institut Hospitalo-Universitaire, Pôle Hépato-digestif, Nouvel Hôpital Civil, 67000 Strasbourg, France.9Laboratoire de Virologie Moléculaire, INTS, Paris, France. 10Institut Universitaire de France (IUF), Paris, France.11These authors contributed equally: Carla Eller, Laura Heydmann.12These authors jointly supervised
this work: Eloi R. Verrier, Thomas F. Baumert. ✉email:[email protected];[email protected]
123456789
C
hronic infection by hepatitis B virus (HBV) is a major health
problem and the leading cause of hepatocellular carcinoma
(HCC) worldwide
1. The global HBV burden persists despite
the availability of an effective preventative vaccine, and it is
esti-mated that HBV chronically infects 250 million people. While
current therapies based on nucleot(s)ide analogs (NUCs) suppress
viral replication and reduce progression of liver disease, treatment is
lifelong and viral cure is extremely rare
2. Different curative
strate-gies are urgently needed to address this global medical burden.
HBV is a small enveloped DNA virus in the Hepadnaviridae
family
3. The HBV surface antigen (HBsAg) mediates entry of the
virus into hepatocytes via primary low-affinity interactions with
heparan sulfate proteoglycans
4–6and secondary specific binding to
the sodium taurocholate cotransporting polypeptide (NTCP)
7,8,
ultimately leading to fusion and release of the viral capsid into the
cytoplasm. The capsid delivers the viral genome to the nucleus, where
HBV relaxed circular DNA (rcDNA) is converted into episomal
covalently closed circular DNA (cccDNA), in a process thought to be
mediated by host DNA repair enzymes, such as
tyrosyl-DNA-phosphodiesterase 2
9and DNA Polymerase kappa
10. The cccDNA is
the reservoir for viral persistence and serves as a template for all viral
transcripts. cccDNA levels are not affected by the NUC-based
treatments targeting the viral reverse transcriptase, which converts
viral pregenomic RNA (pgRNA) into de novo genomic DNA, within
newly formed nucleocapsids prior to virion budding
11.
Currently available drugs for the treatment of chronic HBV
infection, such as NUCs, are direct-acting antivirals and allow the
suppression of viral replication, but viral cure is rarely achieved.
Innovative therapeutic strategies, such as host-targeting agents
(HTAs), have emerged as novel candidates for the treatment of
viral infections, including hepatotropic viruses
12–15. However,
this strategy requires a comprehensive understanding of
virus–host interactions at the molecular level. In the context of
HBV infection, the limited access to robust infection models has
restrained for a long time the characterization of host factors
involved in the viral entry process. The discovery of NTCP as a
receptor for HBV has allowed the development of cell culture
models suitable for the study of the full life cycle
7,16. Indeed,
exogenous expression of NTCP in human hepatoma cell lines
(such as HepG2 and Huh7) confers susceptibility to HBV
infec-tion. However, NTCP-overexpressing Huh7 cells remain poorly
permissive to HBV infection but support infection by hepatitis D
virus (HDV), an HBV-satellite virus carrying HBV envelope
proteins
16. This suggests that after HBV entry, additional key
factors are still limiting in these cells. Therefore, we hypothesized
that characterization of differences between the two cell lines
should allow the identification of previously undiscovered HBV
host factors. Discovery of such host factors in human hepatoma
cells would open avenues to develop new infection models, such
as immunocompetent transgenic animal models that are fully
susceptible to HBV. Indeed, a previous study suggests that the
limited ability of HBV to replicate in mouse cells is caused by the
lack of a host cell-dependency factor
17. Here we perform a
genome-wide gain-of-function screen using a weakly permissive
NTCP-overexpressing Huh7-derived cell line termed Huh-106
cells
5and a genome-scale lentiviral open reading frame (ORF)
library
18, aiming to uncover HBV-related host-dependency
fac-tors. We expect that the identification of these previously
undiscovered HBV factors will facilitate the development of
improved infectious cell culture systems for the identification of
innovative antiviral molecules.
Results
A high-throughput screening strategy for HBV host factors. To
characterize HBV infection in different hepatoma cell lines, we
compared the susceptibility of two NTCP-overexpressing cell
lines (Huh7-derived Huh-106
5and HepG2-NTCP) to HBV and
HDV infection. Both cell lines were similarly susceptible to HDV
infection, suggesting equivalent virus entry in both cell lines
(Fig.
1
a). However, in contrast to HepG2-NTCP cells, Huh-106
cells appear poorly permissive to HBV infection (Fig.
1
a), despite
their ability to bind HBV particles (Fig.
1
b). Furthermore,
Huh-106 cells support the conversion of incoming HBV rcDNA to
cccDNA, although to a much lesser extent than HepG2-NTCP
cells (Fig.
1
c, d). Interestingly, the kinetics of cccDNA formation
are similar in both cell lines (Fig.
1
e). Moreover, quantification
of intracellular pgRNA and secreted antigens (HBsAg and
hepatitis B e antigen (HBeAg)) during the course of infection
revealed a severe restriction of the HBV life cycle in Huh-106
cells at different steps (Fig.
1
f–h). Taken together, these findings
suggest that HBV infection is constrained in Huh-106 cells in a
step between NTCP-mediated entry and cccDNA-mediated
transcription.
Assuming that this restriction is due to the lack of key host
factor(s) for HBV infection, we pursued a functional genomics
approach to screen for factors that increase the susceptibility of
Huh-106 cells to HBV infection. To this end, we performed a
gain-of-function screen for HBV infection using Huh-106 cells
and a genome-scale lentiviral expression library of >16,000
human ORFs
18. Huh-106 cells were
first transduced with the
lentiviral hORFeome V8.1
18and then inoculated with HBV
(Fig.
2
a). Sorting for HBsAg-positive cells by
fluorescence-activated cell sorting (FACS) 10 days postinfection (dpi) allowed
the collection of HBV-infected cells only (HBV sorted) for
subsequent analysis to identify factors conferring susceptibility to
HBV infection. Using Illumina next-generation sequencing and
deconvolution using PoolQ, we compared the infected pool of
cells (HBV sorted, Fig.
2
a, b) to the control population (HBV
pre-sort, Fig.
2
a, b) to determine which ORFs were enriched in
HBsAg-positive cells. Candidate HBV host factors were identified
based on an enrichment threshold of log2 fold change (Log2FC)
>1.5 (Fig.
2
c, d). Following an algorithm based on liver expression
and the number of sequences per candidate to further
filter the
list (see
“Methods”), 47 candidate genes were selected for
validation (Supplementary Table 1). Among them was HNF4A,
a gene encoding a transcription factor previously known to
enhance HBV replication
19, supporting the ability of our screen
to identify HBV host factors. Interestingly, another transcription
factor stimulating HBV replication, HLF
20, scored a Log2FC
=
1.49 just below the selection threshold. The remaining candidates
therefore represent a list of putative new factors for HBV
infection for further validation and study.
Cyclin-dependent kinase inhibitor 2C (CDKN2C) is a HBV
host factor highly expressed in HepG2 cells. To validate the
candidate host factors identified above, we individually
over-expressed the candidate ORFs in Huh-106 cells before infection
with HBV for 10 days. Of the 47 identified ORFs, 35 were
eval-uated (see
“Methods”), along with lentiviruses encoding GFP,
KRT80, and CPA1 as negative controls (Supplementary Table 1).
HBV infection was assessed by quantification of secreted HBV
antigens in the cell culture supernatant of infected cells,
indicat-ing increased HBV infection versus controls for a majority of the
candidates. Several had large effects on both secreted HBeAg and
HBsAg, including the top scorers ESRP1, SPATA24, U2AF1,
CDKN2C, and GPR27 (Fig.
3
a, Supplementary Fig. 1).
Impor-tantly, the top candidate ESRP1 was not detected at the protein
level in our systems (data not shown), suggesting a
non-physiological effect on HBV infection. However, this construct
was used as a technical positive control in further experiments. To
systematically identify genes that are differentially expressed in
the studied cell lines, we performed transcriptomic analyses using
microarrays for gene expression profiling in HepG2-NTCP and
Huh-106 cells. Pathway enrichment analysis identified a small
number of signaling pathways that exhibited significantly
differ-ent expression patterns between the two cell lines, although the
vast majority of pathways were similarly expressed (Fig.
3
b).
Notably, interferon-α response gene expression was higher in
HepG2 cells, consistent with previous observations that HepG2
cells are more competent for mounting an efficient innate
immune response following viral infection compared to
Huh7-derived cells
21,22.
Comparing the expression of primary screen candidate genes
from the microarray data, we identified CDKN2C and SPATA24
as highly expressed genes in HepG2-NTCP versus Huh-106 cells
(Fig.
3
c). Given the specific previously annotated function of
SPATA24/T6441 in spermiogenesis
23, we focused instead on
CDKN2C for further characterization. The higher expression of
CDKN2C in HepG2-NTCP versus Huh-106 cells was confirmed
by quantitative PCR (qPCR) and western blot (Fig.
3
d, e). The
a
c
f
g
h
HepG2-NTCP Huh-106
Intracellular pgRNA HBsAg in culture medium HBeAg in culture medium
Huh-106 1.5 10 20 15 10 5 0 5 0 1.0 0.5 Relativ e pgRNA e x pression IU/mL HBsAg
PEI U/mL HBeAg
0.0 Moc k D1 D4 D7 D10 Moc k D1 D4 D7 D10 Moc k D1 D4 D7 D10 HepG2-NTCP MM 4.3 kb 2.5 2.0 1.5 1.0 0.5 0.0
cccDNA band intensity (×10
6) DL Moc k HBV pf-rcDNA dsIDNA cccDNA cccDNA HepG2-NTCP HepG2-NTCP MM 4.3 kb 2.3 kb Huh-106 pf-rcDNA dslDNA cccDNA Huh-106 Moc k Moc k D2 D4 D9 D2 D4 D9 2.3 kb HBV + – – +
d
e
HDV infection HepG2-NTCPDAPI HDAg DAPI HBsAg
HepG2-NTCP Huh-106 Huh-106 200 Mock Heparin
b
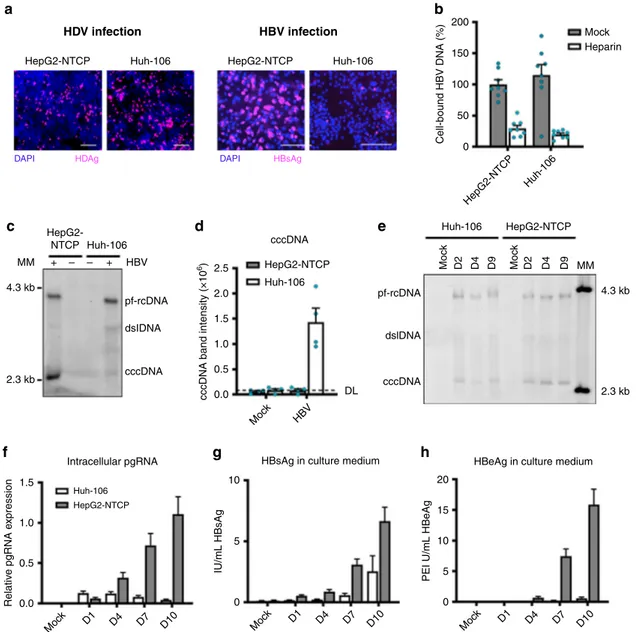
150 50 0 HepG2-NTCP Huh-106 Cell-bound HBV DNA (%) 100 HBV infectionFig. 1 Huh-106 are less permissive to HBV infection than HepG2-NTCP. a HBV and HDV infection of HepG2-NTCP and Huh-106 cells and detection of HBsAg and HDAg by IF after 10 dpi. One representative experiment is shown. Scale bars: 100µm. b Binding of HBV particles to HepG2-NTCP and Huh-106 cells. Results are expressed as means+/− SEM bound HBV genome copies (%) from three independent experiments (n = 8). c Comparison of HBV cccDNA levels in HepG2-NTCP and Huh-106 cells detected by Southern blot. Protein-free relaxed circular DNA (pf-rcDNA), double stranded linear DNA (dsl DNA), and covalently closed circular DNA (cccDNA) are indicated. One representative experiment is shown.d Quantification of cccDNA band intensity. Dashed line indicates the detection limit (DL). Results are expressed as means+/− SEM 106band intensity (arbitrary units) from 4 independent experiments.e Time course experiment of HBV infection in Huh-106 and HepG2-NTCP. DNA was extracted from cells 2 (D2), 4 (D4), or 9 (Mock, D9) days post HBV infection and detected by Southern blot. Bands of pf-rcDNA, dsl DNA, and cccDNA were identified using a molecular marker (MM). One experiment is out of three shown. Quantification of cccDNA band intensities in Fig. S5a. f–h Quantification of intracellular pgRNA by qRT-PCR (f) and secreted HBsAg (g) and HBeAg (h) by CLIA in Huh-106 and HepG2-NTCP cells 1 (D1), 4 (D4), 7 (D7), or 10 (Mock, D10) days post HBV infection. f Results are expressed as means+/− SEM relative pgRNA expression from four experiments (n = 13). g Results are expressed as means +/− SEM IU/mL HBsAg from 4 experiments (n = 12). h Results are expressed as means +/− SEM PEI U/mL HBeAg from 4 experiments (n = 12). MM molecular marker. Source data are provided as a Source Datafile.
involvement of CDKN2C in HBV infection in Huh-106 cells was
confirmed by a sixfold increase in viral pgRNA levels following
overexpression of CDKN2C when compared to the empty control
vector (Fig.
4
a).
Taking advantage of high infection levels in HepG2-NTCP cells,
we aimed to confirm the phenotypic effect of CDKN2C on HBV
infection by a loss-of-function approach, using small interfering
RNA (siRNA) specifically targeting CDKN2C or SLC10A1 (the gene
encoding the HBV receptor NTCP) in susceptible HepG2-NTCP
cells, as shown in Fig.
4
b, c. We observed a marked decrease in
HBV infection in cells with silenced CDKN2C or SLC10A1
expression. To rule out off-target effects, we used CRISPR-Cas9
to generate and clonally select four independent HepG2-NTCP
CDKN2C knockout (KO) cell lines (Fig.
4
d). Functional analysis
confirmed a marked decrease in both HBV pgRNA and secreted
HBe antigen levels in HepG2-NTCP KO-CDKN2C cells compared
to naive HepG2-NTCP cells (Fig.
4
e). Finally, to validate the
relevance of CDKN2C in a physiological model, we investigated
CDKN2C–HBV interactions in primary human hepatocytes
(PHHs), the natural target cells for HBV infection, which express
the protein at varying levels comparable to HepG2-NTCP cells
(Fig.
4
f). Consistent with our previous observations, the
over-expression of HNF4A and CDKN2C in PHHs resulted in a
significant and marked increase in HBV infection (Fig.
4
g).
Moreover, the silencing of CDKN2C expression using
target-specific short hairpin RNA (shRNA) induced a significant and
robust decrease in HBV infection (Fig.
4
h). Taken together, our
data support a role for CDKN2C in HBV infection. Therefore, the
differential expression of this gene between the two cell lines
suggests that a lack of CDKN2C expression may contribute to the
limited susceptibility of Huh-106 cells to HBV infection.
CDKN2C stimulates HBV cccDNA-mediated transcription. To
address the mechanism by which CDKN2C contributes to HBV
infection, we performed additional experiments using alternative
read-outs to identify the steps of the viral life cycle that may be
affected by CDKN2C expression. Transduction efficacy was
assessed by quantification of green fluorescent protein (GFP)
expression in HBV-infected GFP-transduced cells after 10 days
selectiona
b
c
d
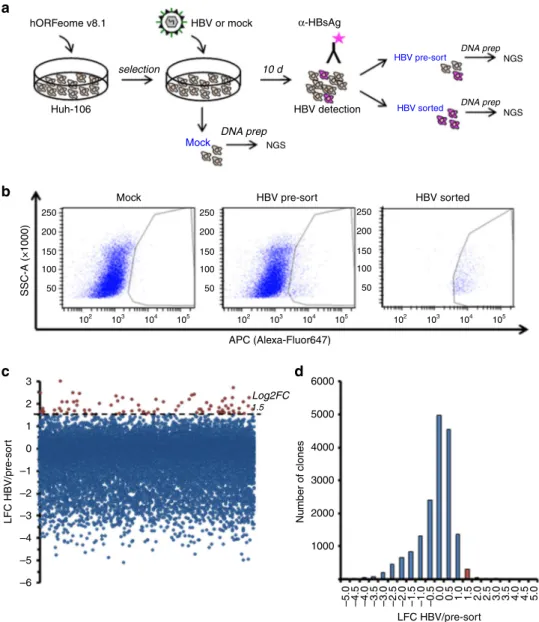
hORFeome v8.1 10 d DNA prep Mock HBV pre-sort HBV sorted HBV detection Huh-106 Mock SSC-A (×1000) HBV pre-sort APC (Alexa-Fluor647) HBV sorted 250 200 150 100 50 3 6000 5000 4000 3000 2000 1000 –5.0 –4.5 –4.0 –3.5 –3.0 –2.5 –2.0 –1.5 –1.0 –0.5 0.0 0.5 1.0 1.5 2.0 2.5 3.0 3.5 4.0 4.5 5.0 Log2FC 1.5 2 1 0 –1 –2 –3 –4 –5 –6 LFC HBV/pre-sor t Number of clones LFC HBV/pre-sort 250 200 150 100 50 250 200 150 100 50 102 103 104 105 102 103 104 105 102 103 104 105 HBV or mock α-HBsAg DNA prep NGS NGS NGS DNA prepFig. 2 Gain-of-function (GOF) screen in Huh-106 cells for the identification of HBV host factors. a Schematic workflow of GOF screen. b FACS for HBsAg-positive cells in Huh-106 transduced with an ORF library (hORFeome v8.1) 10 days after HBV infection (HBV pre-sort). Flow cytometric analysis of uninfected cells as gating control (Mock) and of the HBsAg-positive sorted population as sorting control (HBV sorted).c, d Primary screen candidates. ORFs with Log2FC > 1.5 were selected for validation. Source data are provided as a Source Datafile.
(Supplementary Fig. 2). Detection of intracellular HBsAg by
immunofluorescence (IF; Fig.
5
a) and its quantification by flow
cytometric analysis (Fig.
5
b) revealed a significant increase in
HBV infection levels in Huh-106 cells overexpressing HNF4A,
ESRP1, and CDKN2C. Notably, co-overexpression of CDKN2C
and ESRP1 leads to an even higher percentage of HBsAg-positive
cells (Fig.
5
b), suggesting that the two factors affect HBV
infec-tion through independent pathways. Interestingly, overexpression
of both factors in Huh-106 cells markedly increased HBV
infec-tion but failed to reach levels observed in HepG2-NTCP cells
(Fig.
5
b, c), suggesting the existence of additional differentially
expressed factors in the two cell lines. To determine the step of
the HBV life cycle affected by CDKN2C expression, we detected
HBV DNA genome intermediates by Southern blot and HBV
RNA levels by northern blot. As shown in Fig.
5
d, e, no marked
change in HBV cccDNA levels was observed when CDKN2C was
overexpressed, suggesting no effect on HBV replication before
cccDNA formation. Detection of viral RNAs by Northern blot
revealed increased HBV RNA levels in cells overexpressing
HNF4A and CDKN2C compared to GFP-overexpressing cells
(Fig.
5
f, g). To determine whether CDKN2C has a direct effect on
HBV RNA formation, we quantified nascent HBV RNAs using
labeled uridine. Huh-106 cells overexpressing CDKN2C displayed
a threefold increased level of newly synthesized HBV RNA
a
HBeAg ESRP1 SPATA24 U2AF1 CDKN2C GPR27 NGEF HNF4A GPR123 ASMTL TRIM24 ARPP21 LIPE LAMC1 DEK ABHD8 TOB1 ZNF326 VPS45 ENTPD4 TMEM38B USO1 CLEC1B SEMA4A ASGR1 FGFR1OP HBV Ctrl GFP PRKD2 RUFY2 HLA-DRB3 GRK5 KLHL15 SDC1 KDF1 HCCS HIST1H4B Low High Mock#1 Mock#2 CPA1 PPP2R5D KRT 80 HBsAg Enriched in Huh-106 –2.0 HepG2-NTCP #1 DEK TRIM24 PPP2R5D KDF1 CDKN2C ASGR1 LAMC1 RUFY2 SDC1 SPATA24 U2AF1 NGEF KLHL15 ARPP21 ABHD8 PRKD2 ASMTL HCCS Z score –1.9 1.2 β-tubulin CDKN2C HepG2-NTCP Huh-106 kDa 50 20 15 Relativ e mRNA e xpression 1.0 0.8 0.6 0.4 0.2 0.0 HepG2-NTCP Huh-106 1.9 0 TMEM38B HepG2-NTCP #2HepG2-NTCP #3 Huh-106 #1 Huh-106 #2 Huh-106 #3 p value <0.0001 <0.0001 0.0002 0.0003 0.0009 0.001 0.001 0.0032 0.0047 0.0074 0.0078 0.0075 0.0057 0.0036 0.0003 0.0018 0.0016 0.0001 <0.0001 –1.5 –1.0 –0.5 0.0 NES 0.5 1.0 1.5 2.0 KRAS signaling IFNα response Peroxisome P53 pathway IFNγ response UV response Coagulation Enriched in HepG2-NTCP
b
c
d
e
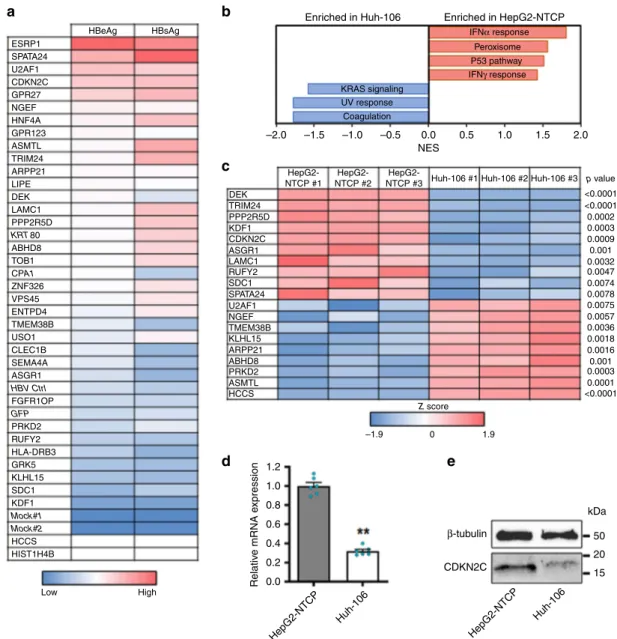
Fig. 3 CDKN2C is differentially expressed in HepG2-NTCP and Huh-106 cells. a Heatmap of candidate validation. Huh-106 cells were transduced with the indicated ORF and infected with HBV. HBV infection was assessed at 10 dpi by CLIA quantification of secreted HBeAg and HBsAg. Results are expressed as means concentration of secreted HBeAg or HBsAg from 1 experiment (n = 2). Genes in italic (KRT80 and CPA1) correspond to negative controls, which were not identified as candidates from the primary screen. Mock#1 and Mock#2: uninfected HepG2-NTCP cells. HBV ctrl: non-transduced HBV-infected HepG2-cells. GFP: GFP-transduced HBV-infected HepG2-NTCP cells.b, c Microarray for comparison of gene expression in HepG2-NTCP and Huh-106 cells. Analysis of differentially expressed pathways (b) and candidate host factors from the primary screen throughZ score transformation (c) are presented.d, e CDKN2C is upregulated in HepG2-NTCP compared to Huh-106 cells. dCDKN2C mRNA expression in HepG2-NTCP and Huh-106 cells quantified by qRT-PCR. Results are expressed as means +/− SEM CDKN2C relative expression compared to HepG2-NTCP (set to 1) from 3 independent experiments (n = 6). e Endogenous CDKN2C protein expression in HepG2-NTCP and Huh-106 cells detected by western blot. One representative experiment is shown. **p < 0.01 (two-tailed Mann–Whitney U test). Source data are provided as a Source Data file.
(Fig.
5
h). This suggests a role for CDKN2C in cccDNA-mediated
transcription of HBV RNAs. To investigate whether the role of
CDKN2C in transcription of HBV RNAs is linked to previously
described HBV host factors, we quantified the expression
of HNF4A, HLF, and PPARA, known to enhance HBV
transcription
19,20. Interestingly, CDKN2C overexpression in
Huh-106 resulted in upregulation of the expression of three HBV
transcription factors (Fig.
5
i). Taken together, our results suggest
that CDKN2C expression enhances transcription of HBV RNAs
through the upregulation of HBV-related transcription factors.
Enhanced supernatant infectivity of transduced HepAD38
cells. Since a recent study suggested that HBV virion production
was more efficient in quiescent cells
24, we then investigated
whether modification of CDKN2C expression modulates the
production of virus particles in HBV-expressing cells, and we
overexpressed CDKN2C and HNF4A in HepAD38 donor cells.
Ten days after ORF lentivirus transduction, we harvested
super-natants and infected HepG2-NTCP acceptor cells with an
adjusted multiplicity of infection (MOI) from supernatant from
HepAD38 donor cells containing HBV particles (Fig.
6
a). While
a
Huh-106 HepG2-NTCP PHH PHH 120 150 100 50 0 60 40 0 PHH 1 Donor GAPDH CDKN2C 3 2 4 5 6 7 kDa 350 22002000 1800 1600 1400 1200 1000 800 600 400 200 0 300 250 200 150 100 50 0 37 20 15 kDa β-tubulin CDKN2C 50 120 80 40 0 120 80 40 0 PHH 20 15 Clone #9 Ctr Clone #10 Clone #12 Clone #14l Ctr l HepG2-NTCP HepG2-NTCP KO-CDKN2C clones pgRNA HBeAg pgRNA HBeAg Moc k NT NT GFP+ si ctr l Moc k Moc k shCtr l shCTRL NI HepG2-NTCP
Clone #9 Clone #10 Clone #12 Clone #14 Huh-106 si NTCP si CDKN2C shCDKN2C shCDKN2C Ctrl+ HNF4A+ HNF4A+ ESRP1+ CDKN2C+ CDKN2C+ 800 1.2 Mock si CDKN2C DAPI HBsAg si ctrl si NTCP 0.8 0.4 0.0 Relativ e pgRNA e xpression (%) Relativ e mRNA e xpression Relativ e pgRNA e xpression (%) Relativ e pgRNA e xpression (%) Relativ e CDKN2C e xpression (%) Relativ e pgRNA e xpression (%) Relativ e HBeAg (%) Relativ e HBeAg (%) 600 400 200 ns 0
d
f
h
e
g
b
c
we observed a modest increase in the secretion of HBsAg and
HBeAg, CDKN2C overexpression in HepAD38 donor cells did
not affect the levels of HBV DNA in the cell culture supernatant
(Fig.
6
b, c). Interestingly, overexpression of CDKN2C in
HepAD38 increased infection of HepG2-NTCP acceptor cells by
about threefold suggesting that the supernatant of
CDKN2C-transduced HepAD38 cells has a higher infectivity (Fig.
6
d, e).
CDK4/6 inhibitors enhance HBV infection. CDKN2C encodes
the CDKN2C, a regulator of G1 cell cycle progression through
interaction with cyclin-dependent kinases 4 and 6 (CDK4/6). In
fact, overexpression of CDKN2C induces G1 cell cycle arrest in
Huh-106 cells (Supplementary Fig. 3). To determine whether
this known function of CDKN2C is responsible for enhancing
HBV infection, we performed functional studies using two
clinically studied CDK4/6-specific small molecule inhibitors,
Palbociclib
25and LEE011
26. Drug treatment of Huh-7 and
Huh-106 cells induced a dose-dependent G1 cell cycle arrest
associated with a decrease in cell proliferation (Supplementary
Fig. 4a–d), most likely due to drug-induced cytostatic effect
associated with the accumulation of cells in G1 phase. At the
reference concentration of 100 nM, Palbociclib and LEE011 did
not induce major cytotoxic effects as shown by the LDH-Glo
cytotoxicity assay (Supplementary Fig. 4b). We then
deter-mined HBV infection levels in Huh-106 cells treated with either
of the inhibitors before and after HBV infection (Fig.
7
a, e).
Visualization of intracellular HBsAg revealed a marked increase
in HBV infection levels after treatment with Palbociclib or
LEE011 (Fig.
7
b). Furthermore, quantification of HBV pgRNA
and HBsAg-positive cells revealed a significant increase in HBV
infection upon both Palbociclib and LEE011 treatment
(Fig.
7
c). Similar results were obtained in PHHs treated with
CDK4/6 inhibitors at different concentrations (1, 10, 100, and
1000 nM) confirming the proviral effect of Palbociclib and
LEE011 (Fig.
7
d). To investigate whether Palbociclib-mediated
enhancement of infection is dependent on HBV entry, we
treated HBV infected Huh-106 cells with 100 nM Palbociclib
following removal of the HBV inoculum (Fig.
7
e). As shown in
Fig.
7
f and Supplementary Fig. 5, Palbociclib treatment did not
affect HBV cccDNA levels, suggesting no effect on the viral
entry steps including cccDNA formation. However, pgRNA
and secreted HBeAg levels were significantly increased in
Palbociclib-treated cells, indicating that CDKs are important
for post-entry steps of the viral life cycle (Fig.
7
g). Collectively,
our data identify CDKN2C as a previously undiscovered HBV
host factor, most likely acting through inhibition of CDK4/6,
triggering a cell cycle G1 arrest and enhancing HBV
tran-scription (Fig.
8
).
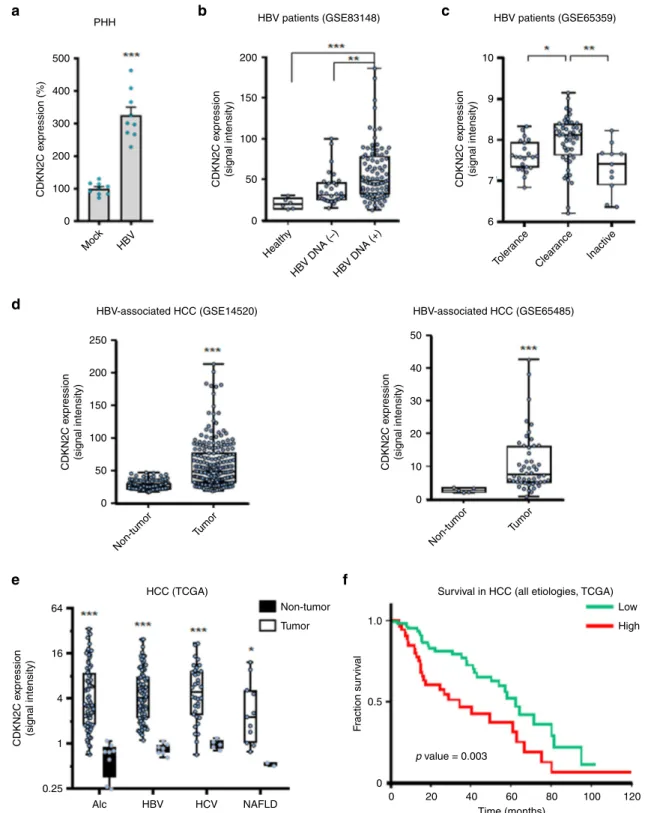
CDKN2C expression is associated with chronic liver disease. To
assess whether HBV infection directly affects CDKN2C
expres-sion, we infected PHHs with HBV and evaluated CDKN2C gene
expression. Interestingly, CDKN2C expression was upregulated
upon HBV infection (Fig.
9
a). In line with this observation, the
analysis of CDKN2C expression from patient liver tissues
retrieved from the Gene Expression Omnibus database revealed
an upregulation of CDKN2C in patients with active replication
compared to patients with undetectable viral load and healthy
patients (Fig.
9
b). Moreover, a correlation was observed between
HBV viral load and CDKN2C expression in liver tissues from nine
HBV-infected patients (Supplementary Fig. 6a). Finally, CDKN2C
expression appeared to be modulated in different stages of HBV
infection (Fig.
9
c). Taken together, these data suggest that HBV
infection modulates CDKN2C expression in chronically infected
patients. To evaluate whether CDKN2C expression is associated
with the development of virus-induced liver disease, we analyzed
CDKN2C expression in HBV patients with advanced liver disease
and HCC. We
first observed that patients with advanced fibrosis
(F3) exhibit higher CDKN2C mRNA levels compared to patients
with F1 or F2
fibrosis CDKNC2 expression (Supplementary
Fig. 6b). Moreover, CDKN2C expression was significantly higher
in tumor tissues from HBV-derived HCC compared to adjacent
tissue (Fig.
9
d). To assess the specificity of this correlation, we
analyzed CDKN2C expression in HCC patients regardless the
etiology. CDKN2C levels were markedly elevated in the tumor
liver tissue of patients chronically infected with hepatitis C virus
(HCV) or HBV and patients with alcoholic liver disease (ALD) or
alcoholic fatty liver disease (NAFLD) as compared with
non-tumor tissue (Fig.
9
e), suggesting that CDKN2C expression is
upregulated in HCC in an etiology-independent manner. Finally,
higher expression of CDKN2C in HCC patients was associated
with significantly lower long-term overall survival (Fig.
9
f).
Taken together, our data suggest that HBV infection modulates
CDKN2C expression and that CDKN2C expression is associated
with liver disease progression and poor survival.
Discussion
Chronic hepatitis B is the most common form of severe viral
hepatitis worldwide and a leading cause of HCC. To date,
molecular details of HBV–host interactions are not fully
under-stood. Using a functional genomics approach, we identified
CDKN2C as a previously undiscovered host factor for HBV
infection. The functional impact of this
finding is confirmed by:
(1) a marked increase or decrease in HBV infection after
CDKN2C overexpression or KO, respectively; (2) an increase in
HBV markers following CDKN2C overexpression; and (3) a
sig-nificant proviral effect of CDK4/6 inhibitors correlated with cell
Fig. 4 CDKN2C is a HBV host factor. a Individual ORF overexpression in Huh-106 and HBV infection 3 days after transduction. Detection of HBV pgRNA by qRT-PCR 10 dpi. Results are expressed as means+/− SEM relative pgRNA expression (%) compared to ctrl (set as 100%) from 8 independent experiments (n = 21). b, c siRNA transfection of HepG2-NTCP cells. b mRNA. Results are expressed as means +/− SEM relative expression compared to si ctrl (set to 1) from 4 independent experiments (n = 8). c HBV infection after silencing was detected by IF 10 dpi. Scale bars: 100 µm. d Production of CDKN2C knockout cell lines. CDKN2C expression was controlled by western blot for in HepG2-NTCP (ctrl) and KO-CDKN2C clones. e HBV infection of HepG2-NTCP, KO-CDKN2C clones, and Huh-106. HBV infection was assessed at 10 dpi by pgRNA qRT-PCR (black) and quantification of secreted HBeAg (white). Results are expressed as means+/− SEM % HBV infection compared to HepG2-NTCP (set as 100%) from 3 independent experiments (n = 9 for pgRNA andn = 12 for HBe CLIA). f Detection of endogenous CDKN2C expression in PHH from 7 donors. One experiment is shown. g Validation studies in PHH from 3 different donors transduced with ORF lentivirus for 3 days and infected with HBV. HBV markers (pgRNA, black; HBeAg, white) were detected 10 dpi. Results are expressed as means+/− SEM % HBV infection compared to ctrl (GFP) (set to 100%) from 3 independent experiments (n = 12 for pgRNA;n = 6 for HBeAg). h PHH from 3 donors were transduced with lentiviruses containing CDKN2C-targeting shRNA or non-targeting shRNA control (sh ctrl). Silencing efficacy was assessed by qRT-PCR. Results are expressed as means +/− SEM % gene expression compared to sh ctrl (set to 100%) from 3 independent experiments (n = 9). PHH were then infected with HBV and HBV infection was assessed by pgRNA qRT-PCR 8 dpi. Results are expressed as means+/− SEM relative pgRNA expression compared to sh ctrl (set to 100%) from 3 independent experiments (n = 9). **p < 0.01; ***p < 0.001 (two-tailed Mann–Whitney U test). Source data are provided as a Source Data file.cycle G1 arrest. The role of CDKN2C as an HBV host factor was
identified in a gain-of-function approach combining a cell-based
model system
5with a genome-scale ORF library
18. The ability of
our screen to discover HBV host factors promoting different
steps of the HBV life cycle is supported by the identification of
HNF4A in the primary screen. HNF4A encodes a liver-specific
transcription factor, hepatocyte nuclear factor 4 (HNF4), that has
been shown to be important for HBV replication by enhancing
transcription from the promoters of HBV core
27, major surface
antigen and large surface antigen
19. Hence, HNF4A is likely to be
a key transcription factor that regulates the HBV replication cycle
and contributes to hepatotropism
28,29. Notably, the hepatic
a
d
g
i
MM 4.3 kb pf-rcDNA dsl DNA cccDNA 2.3 kb 2 kbb
e
h
f
c
GFP ESRP1 DAPI HBsAg % HBs positiv e cells Band intensity (%) % HBs positiv e cells HNF4A Huh-106 HBV RNABand intensity (%) Relativ
e HBV RNAs Relativ e e x pression (%) 600 700 600 500 400 300 200 100 0 HNF4A HLF PPARα NT GFP CDKN2C NT GFP CDKN2C NT GFP CDKN2C 6 5 4 3 2 1 0 GFP+ CDKN2C+ HBV Ctr l HBV Ctr l
ActD EU(–) ActD EU(–) 400 200 0 Huh-106 Huh-106 Huh-106 Total RNA Nascent RNA <DL <DL <DL <DL cccDNA Huh-106 HepG2-NTCP 50 80 40 30 20 10 0 150 3.5 kb 2.1 kb 100 50 0 0 20 40 60 CDKN2C GFP+ GFP+ HBV Moc k Moc k HNF4A+ HNF4A+ ESRP1+ ESRP1+ CDKN2C+ CDKN2C+ GFP+ HNF4A+ ESRP1+CDKN2C+ CDKN2C+/ESRP1+ GFP+ Moc k HNF4A+ESRP1+ CDKN2C+ GFP+ Moc k HNF4A+ CDKN2C+ESRP1+
leukemia factor (HLF), another transcription factor playing a role
in the regulation of the HBV core promoter via interaction with
sites other than HNF4
20, scored with a Log2FC value of 1.49 just
below our threshold for selection of candidate host factors. This
supports the ability of our screening strategy to detect HBV host
factors. Notably, the screen and validation experiments identified
ESRP1 as the top candidate HBV host factor. ESRP1 encodes a
splicing regulator especially involved in a large splicing program
critical for the development in mammals
30. Importantly, ESRP1
protein expression was not detected in our systems, suggesting no
or weak expression in hepatocytes. It is, however, likely that the
splicing regulation of hepatocyte factors or the virus transcripts
themselves (as it has been described, see ref.
31) explain the
observed effect, even if not physiologically relevant.
While some proviral and antiviral host factors have been
described, many aspects of virus–host interactions remain poorly
understood. Importantly, the correlation between HBV
replica-tion and cell cycle progression has long been a topic of
investi-gation. For instance, in 1979, Aden et al.
32demonstrated
increased HBV antigen production in non-dividing
tumor-derived cells with integrated HBV DNA sequences. Similar
observations were made in an HBV-transfected
hepatoma-derived cell line
33. Later, HBV replication was found to be
inversely correlated to cellular DNA synthesis and to be enhanced
in quiescent hepatocytes
34. In fact, effective in vitro infection with
HBV requires the presence of dimethyl sulfoxide (DMSO),
known to enhance and prolong HBV infection by several
mechanisms
16,35and to decrease cell proliferation
36. It has been
previously described that HBV preferentially infects resting cells
and that the virus is able to deregulate the infected cell cycle to
favor its replication
37,38. However, it remains unclear which host
factors are involved in that process and whether cells arrested in
G0/G1 or G2/M phase are more prone to HBV infection. Our
data support the hypothesis that G1 cell cycle arrest is favorable
for HBV replication and that CDKN2C is a key host factor
mediating this virus–host interaction. A comparison of the
pro-liferative ability of HepG2 cells with that of HepG2.2.15
(con-stitutively expressing HBV from integrated viral DNA) indicated
that HBV induces a G1 phase arrest
37. It has also been shown in
PHH that HBV arrests infected cells in the G2/M phase and
replicates more favorably during this cell cycle phase
38. In
eukaryotic cells, CDKs are key components of cell cycle
regula-tion machinery. They form complexes with cyclins to control the
transition through cell cycle phases and therefore allow cell
division of healthy cells
39. Interactions of HBV with certain CDKs
have been shown. For example, CDK2 is involved in the
phos-phorylation of HBcAg and might be incorporated into viral
capsids
40. Moreover, inhibitors of CDKs have been shown to
modulate HBV infection with different outcomes. On the one
hand, KO or inhibition of CDK2 enhances HBV replication by
phosphorylation and deactivation of the host restriction factor
SAMHD1
41. On the other hand, the CDK9 inhibitor FIT039
prevents replication of HBV and other DNA viruses and is under
consideration as an antiviral candidate against HBV
42,43. These
data suggest a link between the CDK–cyclin pathway and the
HBV life cycle. However, the key components and mechanisms
remain unclear.
Here we identify CDK4/6 as additional players in the
regula-tion of HBV infecregula-tion and show that CDK4/6 inhibitors are
beneficial for the viral life cycle. CDK4/6 promote the cell cycle
G1/S transition by phosphorylating the retinoblastoma (Rb)
protein, the gene product of a tumor-suppressor gene, and a
central regulator of cell cycle progression
44. CDKN2C interacts
with CDK4/6 to block cell cycle G1 progression via Rb protein
phosphorylation
45. Here we
find that CDKN2C overexpression in
HBV-infected hepatocytes enhances replication in both
NTCP-overexpressing hepatoma-derived cell line and in PHHs. Our
results suggest an effect of CDKN2C on host cellular factors that
are instrumental in HBV transcription. Indeed, CDKN2C
over-expression is associated with an upregulation of transcription
factors important for the HBV life cycle, such as HNF4A, HLF,
and PPARA (Fig.
5
i). Furthermore, we observed that
over-expression of CDKN2C in HBV-producer cells resulted in a
supernatant containing HBV particles that appeared to be
con-sistently more efficient in infecting naive recipient cells (Fig.
6
). It
is conceivable that CDKN2C overexpression and the subsequent
modulation of expression of HBV host-dependency factors
(Fig.
5
i) results in differences in virion assembly, which could
explain this observation. Further experiments are needed to
understand the functional role of CDKN2C for the formation of
infectious particles. Overall, we identify CDKN2C as HBV host
factor, acting through inhibition of CDK4/6 and prevention of G1
cell cycle progression.
The identification of CDKN2C as a host factor for HBV
infection not only improves our understanding of the virus–host
interactions but also contributes to the explanation of the poor
permissivity of NTCP-overexpressing Huh7 cells to this virus
(Fig.
1
a). A detailed understanding of the molecular mechanisms
underlying the varying susceptibility of currently available HBV
infection models to HBV infection is crucial for the development
of improved infectious cell culture models. The weak permissivity
of Huh7-NTCP compared to HepG2-NTCP cells to HBV
infec-tion could be partially explained by lower CDKN2C expression
levels (Fig.
3
d, e). However, the lower cccDNA levels in
Huh7-NTCP compared to HepG2-Huh7-NTCP are not caused by the lack of
CDKN2C as its overexpression does not affect cccDNA formation
Fig. 5 CDKN2C stimulates HBV cccDNA-mediated transcription. a, b, d–g Validation studies in Huh-106 overexpressing individual ORFs and infected with HBV for 10 days.a Detection of HBsAg by IF. Scale bars: 100µm. b Flow cytometric analysis for quantification of HBsAg-positive cells. Results are expressed as means+/− SEM % HBsAg-positive cells compared to GFP from 5 independent experiments (n = 13, n = 11 for HNF4A) and 3 independent experiments (n = 8) for CDKN2C + ESRP1 c Flow cytometric analysis for quantification of HBsAg-positive cells in HBV-infected HepG2-NTCP cells. Results are expressed as means+/− SEM % HBsAg-positive cells from 4 independent experiments (n = 4). d, e Detection of HBV DNAs by Southern blot in transduced and HBV-infected Huh-106 4 dpi.d Southern blot with the indicated bands of HBV pf-rcDNA, dsl HBV DNA, and HBV cccDNA. One representative experiment is shown.e Quantification of cccDNA. Results are expressed as means +/− SEM % band intensity compared to GFP (set to 100%) from 3 independent experiments (n = 2). f Detection of HBV RNAs by northern blot. The pgRNA (3.5 kb) and surface mRNAs of 2.1 to 2.4 kb (2.1 kb) are detected. One representative experiment is shown.g Quantification of HBV RNA band intensity. Results are expressed as means +/− SEM % band intensity compared to GFP (set to 100%) from 4 independent experiments.h Analysis of nascent HBV RNA synthesis. Quantification of total HBV RNAs (4 dpi) and nascent HBV RNAs (d4pi, 120 min) in Huh-106 cells overexpressing CDKN2C using labeled uridine (EU). Actinomycin D (ActD) was used as negative control. Results are expressed as means+/− SEM % relative HBV RNAs compared to HBV Ctrl (Huh-106 GFP+ set to 1) from 2 independent experiments (n = 6). i HNF4a, HLF and PPARα mRNA expression in CDKN2C-overexpressing Huh-106 quantified by qRT-PCR. Results are expressed as means+/− SEM % relative HNF4a or HLF or PPARα expression compared to Mock (set to 100%) from 3 independent experiments (n = 9) *p < 0.05; **p < 0.01; ***p < 0.001 (two-tailed Mann–Whitney U test). MM molecular marker. Source data are provided as a Source Data file.(Fig.
5
d, e). Huh7-NTCP cells might therefore be useful to
identify additional missing proviral host factors or restriction
factors involved in cccDNA formation. Overall, a better
under-standing of virus–host interactions will facilitate the development
of improved infectious model systems for drug discovery.
In patients, CDKN2C expression is accompanied with
pro-gression of HBV-associated
fibrosis and is higher in
HBV-associated cirrhotic and HCC tissues compared to tumor-adjacent
tissues. In fact, CDKN2C is an etiology-independent marker of
liver disease (Fig.
9
) and part of a regulatory signature involved in
liver regeneration
46. This might explain the association of higher
CDKN2C expression in HCC patients with lower long-term
survival (Fig.
9
). While the upregulation of CDK inhibitors in
cancer cells may appear counterintuitive, our consistent
obser-vations of an association between CDKN2C expression and
pro-gressive liver disease and hepatocarcinogenesis in several
independent cohorts (Fig.
9
) are in line with a recent observation
that the expression of the tumor-suppressor and CDKN2C
effector Rb, which is regularly inactivated in human cancer, was
inversely correlated with CDKN2A, another CDK4/6 inhibitor
47.
Given the positive correlation of CDKN2C expression and
sur-vival, it is likely that CDKN2C rather has procarcinogenic
properties than a tumor-suppressive function in HCC (Fig.
9
).
It is also of interest to note that a recent study showed that
a
ORF LV HepAD38 donor cells 400 800 2500 2000 1500 1000 500 0 HepG2-NTCP acceptor cellsHBV pgRNA
HepG2-NTCP acceptor cells HBeAg 600 400 200 0 HepAD38 SN HepAD38 SN NT GFP HNF4A CDKN2C NT GFP HNF4A CDKN2C HBeAg HBsAg 300 200 100 0 GFP + HNF4A + CDKN2C + GFP + HNF4A + CDKN2C + 400 1.5 ns ns 1.0 0.5 0.0 300 200 100 0 Relativ e HBeAg (%) Relativ e pgRNA e xpression (%) Relativ e HBeAg (%) HBV DNA gEq (10 5 copies/ μ L) Relativ e HBsAg (%) HepAD38 donor cells HepAD38 donor cells 10 d 10 d Quantification HBV markers from HepAD38 donor cells Quantify HBV DNA HepG2-NTCP acceptor cells
SN
Adjust MOI
SN from HepAD38 donor cells
HepAD38 + LV donor cells HepG2-NTCP acceptor cells
b
c
d
e
Fig. 6CDKN2C overexpression results in enhanced infectivity of supernatants of transduced HepAD38 cells. a Schematic workflow of experiments. HepAD38 cells in production medium (Donor cells) were non-transduced (NT) or transduced with ORF lentivirus for 10 days.b, c Supernatant (SN) from HepAD38 donor cells was harvested and HBV markers were quantified from SN. b HBeAg and HBsAg secretion was quantified by CLIA. Results are expressed as means+/− SEM % secreted HBeAg or % secreted HBsAg compared to NT (set to 100%) from 3 independent experiments (n = 6). c HBV DNA level in the supernatant was determined by qPCR. Results are expressed as means+/− SEM HBV DNA genome equivalents from 3 independent experiments (n = 6). d, e HepG2-NTCP (Acceptor cells) were infected with adjusted MOI from supernatant from HepAD38 donor cells. d HBV pgRNA expression was quantified by qRT-PCR 10 dpi. Results are expressed as means +/− SEM % relative pgRNA expression compared to NT (set at 100%) from 3 independent experiments (n = 6). e HBeAg secretion was quantified by CLIA 10 dpi. Results are expressed as means +/− SEM % relative secreted HBeAg compared to NT (set at 100%) from 3 independent experiments (n = 6). **p < 0.01 (two-tailed Mann–Whitney U test). Source data are provided as a Source Datafile.
pgRNA-positive HCCs were characterized by low levels of cell
cycle and DNA repair markers and that pgRNA and cccDNA in
tumors was correlated to the absence of tumorous microvascular
invasion and to better patient survival
48. However, while HBV
viral load and CDK2NC expression showed a positive correlation
trend in a well-defined small cohort shown in Supplementary
Fig. 6, additional correlation analyses in other cohorts are needed
to corroborate this
finding. Collectively, it is likely that CDKNC2
expression is regulated by multiple and possibly different
mechanisms in the different phases of HBV infection and disease
and even more so in the context of HCCs.
Interestingly, chemotherapeutic agents for cancer treatment
cause immunosuppression and can lead to HBV reactivation in
asymptomatic HBV carriers or patients with resolved HBV
a
b
c
e
f
g
Huh-106 PHH pgRNA HBV/mock D0 D1 D4 D10 1.5 40PEI U/mL HBeAg
Relativ e pgRNA e xpression 30 20 10 0 1.0 0.5 0.0 Huh-106 D4 MM pf-rcDNA 4.3 kb 2.3 kb dsl DNA cccDNA Moc k
DMSOPalbo Moc
k
DMSO Palbo
Palbo Detection of HBV DNA Detection of HBV markers
1000 1500 1000 500 0 500 0 Moc k
DMSO Palbo LEE DMSO LEE Palbo
1000 500 0 % pgRNA e xpression % pgRNA e xpression % HBsAg positiv e cells % HBs pos pgRNA HBeAg
d
Palbo/LEE LEE Palbo D-1 Mock DMSO D0 D1 D10Palbo/LEE Detection of HBV markers
HBV/mock
DAPI HBsAg
Fig. 7 CDKN2C-mediated stimulation of HBV transcription is correlated with a cell cycle arrest. Effect of treatment with CDK4/6 inhibitors Palbociclib (Palbo) and LEE011 (LEE) on HBV infection.a Schematic workflow of experiments. b–d Detection of HBV markers in mock/HBV infected Huh-106 cells or PHHs treated with DMSO or Palbo/LEE before (D−1 to D0) and after (D1 to D10) HBV infection 10 dpi. b, c Detection of HBV markers 10 dpi in mock-treated of HBV-infected Huh-106 cells mock-treated with DMSO or 100 nM Palbo/LEE.b Detection of HBsAg by IF 10 dpi. Scale bars: 100µm. c Quantification of HBV pgRNA by qRT-PCR (black). Quantification of HBsAg-positive cells by flow cytometric analysis (white). Results are expressed as means +/− SEM % HBV infection compared to DMSO (set to 100%) from 3 independent experiments (n = 5) for pgRNA and from 4 independent experiments (n = 12) for % HBsAg positive.d Quantification of HBV pgRNA10 dpi in mock-treated of HBV-infected PHHs treated with DMSO or 1–1000 nM Palbo/LEE. Results are expressed as means+/− SEM % relative pgRNA expression compared to DMSO (set to 100%) from 3 independent donors (n = 9). e Schematic workflow of experiments. f–h Treatment of mock/HBV-infected Huh-106 or HepG2-NTCP cells with 0 nM (DMSO) or 100 nM Palbociclib (Palbo) after HBV infection.f Detection of HBV DNA by Southern blot in Huh-106 cells 4 dpi. HBV pf-rcDNA and dsl DNA cccDNA bands are indicated. One representative experiment is shown. Quantification of cccDNA bands in Fig. S5b. g Detection of HBV markers in Huh-106 10 dpi. Quantification of HBV pgRNA by qRT-PCR (black) and of secreted HBeAg by CLIA (white). Results are expressed as means+/− SEM relative pgRNA expression (pgRNA) or as means+/− SEM PEI U/mL HBeAg from 3 independent experiments (n = 9) for pgRNA and from 3 independent experiments (n = 12) for HBeAg. *p < 0.05; **p < 0.01; ***p < 0.001 (two-tailed Mann–Whitney U test). MM molecular marker. Source data are provided as a Source Data file.
infection
49,50. The list of chemotherapeutic agents associated with
HBV reactivation is growing and includes anthracyclines,
corti-costeroids, platinum, vinca alkaloid, other small molecule agents,
monoclonal antibodies, and immune modulators
49. Therefore,
several professional societies, including American Association for
the Study of Liver Diseases and European Association for the
Study of the Liver, recommend HBV screening in all cancer
patients undergoing chemotherapy and immunization with HBV
vaccine or prophylactic antiviral therapy
49. However, awareness
of this serious clinical problem is limited
49and needs to be
considered in clinical trials for new treatments. CDK-inhibiting
drugs are a novel class of cancer therapeutics and three CDK4/6
inhibitors, palbociclib, ribociclib (LEE011), and abemaciclib,
are Food and Drug Administration and European Medicines
Agency approved for the treatment of advanced hormone
receptor-positive breast cancer and in clinical trials for other
non-breast malignancies
51. Palbociclib (PD-0332991) is now under
evaluation for the treatment of different Rb protein-positive
cancers
52–54and most importantly in clinical trials for the
treatment of HCC
55,56. Chronic HBV infection accounts for
approximately 50% of cases of HCC worldwide
1. In this study, we
show that CDK4/6 inhibition by palbociclib enhances HBV
replication by arresting cells in the G0/G1 phase of the cell cycle.
Therefore, caution is warranted in the use of such agents for HCC
treatment. Our
findings have important clinical implications as
they indicate that there might be a potential risk of HBV
reac-tivation during therapy with a CDK4/6 inhibitor, such as
pal-bociclib, currently evaluated for HCC treatment.
Taken together, our gain-of-function screening approach
allowed the identification of key HBV host factors, such as
CDKN2C, with clinical implications in patients. Our data pave
the way for the development of more permissive infection
sys-tems for the study of virus–host interactions and the
identifica-tion of previously undiscovered antiviral targets urgently needed
for viral cure.
Methods
Human subjects. Human serum from patients with chronic HBV/HDV infection followed at the Strasbourg University Hospitals, Strasbourg, France was obtained with informed consent. PHHs were obtained from liver tissue from patients undergoing liver resection for liver metastasis at the Strasbourg University Hos-pitals with informed consent. Protocols were approved by the local Ethics Com-mittee of the Strasbourg University Hospitals (CPP) and the Ministry of Higher Education and Research of France (DC-2016-2616). Human samples from HBV-infected patients followed at the Chang Gung Memorial Hospital (Taipei, Taiwan)
were obtained with informed consent. Protocols were approved by the local Ethics Committee (Institutional Review Board 102-3825C).
Cell lines and viruses. NTCP-overexpressing Huh-106 and HepG2-NTCP cell lines5,57as well as human embryonic kidney 293T (HEK 293T)58cell line have
been described. PHHs were isolated and cultured as described58. Recombinant
HDV production5,57as well as purification of infectious HBV particles from the
inducible human hepatoblastoma HepAD38 has been described5,59,60.
Reagents and plasmids. DMSO, polybrene, and PEG 8000 (polyethylene glycol) were obtained from Sigma-Aldrich (Merck). DNA and RNA transfection at the indicated concentrations was performed using the CalPhos Mammalian Trans-fection Kit (Clonetech) and Lipofectamine RNAiMAX (Thermo Scientific) according to the manufacturers’ instructions, respectively. The ORF-encoding lentivirus constructs for validations were obtained from the RNAi Platform, Broad Institute of MIT and Harvard (Cambridge, MA, USA). Cell viability/proliferation was assessed using PrestoBlue Cell Viability Reagent (Invitrogen) according to the manufacturer’s instructions. Cell toxicity was assessed using LDH-Glo cytotoxicity assay (Promega) in the supernatant according to the manufacturer’s instructions. Palbociclib and LEE011 (Ribociclib) were obtained from Synkinase and Sell-ekchem, respectively.
HBV binding. The binding of HBV virions at the cell surface was assessed as described5. In brief, cells were incubated with pretreated HBV in the presence of
4% PEG for 24 h at 16 °C. Unbound virions were removed by three washes with phosphate-buffered saline (PBS), and cells and bound virions were lysed. HBV total DNA was quantified by qPCR using a standard curve generated from known HBV genome copies.
HBV and HDV infections. For HBV infection, NTCP-overexpressing cell lines and PHHs were infected by recombinant HBV in the presence of 4% of PEG-8000 (GEq 500 or 1000 per cell)5,60. After infection, Huh7-106 and HepG2-NTCP cells were
washed and culture in PMM medium with 2% or 3.5% of DMSO, respectively for 10 days. HBV infection was assessed 10 dpi by IF using a mouse monoclonal antibody (Ab) targeting HBsAg (Bio-Techne, clone 1044/329, 1:100) and Alexa Fluor 647-labeled secondary Ab targeting mouse immunoglobulin G (IgG; Jackson Research, 1:200). Cell nuclei were stained with 4,6-diamidino-2-phenylindole. Fluorescent imaging was performed using an Axio Observer Z1 microscope (Carl Zeiss, Germany). Alternatively, cells were lysed and total RNA was extracted using the ReliaPrep RNA Miniprep Systems (Promega) and quantitative reverse tran-scriptase PCR (qRT-PCR) quantification of HBV pgRNA was assessed as described5,60,61. HBsAg and HBeAg secretion were quantified by
chemilumines-cence immunoassay (Autobio) following the manufacturer’s instructions. Southern blot detection of HBV cccDNA was performed using digoxigenin (DIG)-labeled (Roche) specific probes as described62. Total DNA from HBV-infected cells was
extracted using the Hirt method as described63. Specific DIG-labeled probes for the
detection of HBV and mitochondrial probes for the detection of HBV and mito-chondrial DNAs were synthetized using the PCR DIG Probe Synthesis Kit (Roche) and the primers as described60. HBV total RNAs were detected by northern blot.
Total RNA was purified using ReliaPrep RNA Miniprep Systems (Promega). Five µg of total RNA was subjected to electrophoresis through 2.2 M formaldehyde and 1% agarose gel and transferred to a nylon membrane positively charged (Roche). CDKN2C Rb protein G1 G1 S DAPI HBsAg DAPI HBsAg S Rb protein P CDK4/6 Cyclin D Palbo
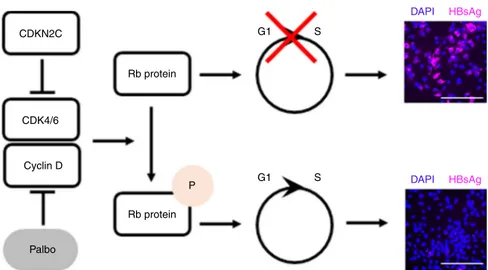
Fig. 8 Schematic model of the effect of CDKN2C expression and Palbociclib (Palbo) treatment on HBV infection. CDKN2C and Palbociclib inhibit the CDK4/6 and Cyclin D-mediated phosphorylation of Rb protein, leading to an accumulation of Rb protein in its unphosphorylated state. Unphosphorylated Rb protein induces a cell cycle G1 arrest resulting in increased HBV infection rates. Illustrative HBV infection pictures come from Fig.6. Scale bars: 100µm.
a
d
e
f
PHH 500 400 300 200 CDKN2C e xpression (%) CDKN2C e xpression (signal intensity) CDKN2C e xpression (signal intensity) CDKN2C e xpression (signal intensity) CDKN2C e xpression (signal intensity) CDKN2C e xpression (signal intensity) 100 0 Moc k HBV Non-tumor Tumor Non-tumor Tumor Health y HBV DNA (–)HBV DNA (+) Toler ance Clear ance Inactiv eb
HBV patients (GSE83148)c
HBV-associated HCC (GSE14520) HBV-associated HCC (GSE65485)
250 64 16 4 1 0.25 Alc HBV HCV NAFLD 50 40 30 20 10 0 200 150 100 50 0
HCC (TCGA) Survival in HCC (all etiologies, TCGA)
Non-tumor Low High 1.0 0.5 F raction sur viv al 0 0 20 40 60 Time (months) 80 100 120 p value = 0.003 Tumor HBV patients (GSE65359) 200 10 9 8 7 6 150 100 50 0
Fig. 9 CDKN2C expression is associated with HBV infection, liver disease, and survival in patients. aCDKN2C mRNA expression in HBV-infected PHH from 3 different donors quantified by qRT-PCR. Results are expressed as means +/− SEM % relative CDKN2C expression compared to Mock (set to 100%) from 3 independent experiments (n = 9). b CDKN2C expression in HBV-infected patients with undetectable (HBV DNA(−), n = 32) or detectable (HBV DNA(+), n = 90) HBV DNA compared to healthy patients (n = 6) (cohorts described in “Methods”). c CDKN2C expression in HBV-infected patients depending on the stage of virus infection (cohorts described in“Methods”). Tolerance: n = 22; Clearance: n = 50; Inactive: n = 11. d CDKN2C expression in tumor and adjacent tissues in HCC patients from two independent cohorts (see“Methods”). Non-tumor: n = 198; Tumor: n = 98 (left panel). Non-tumor: n = 5; Tumor: n = 50 (right panel). e CDKN2C expression in tumor and non-tumor (normal) liver tissue from patients with alcoholic liver disease (Alc, Tumor:n = 70; Non-tumor: n = 8), HBV-infected patients (Tumor: n = 76; Non-tumor: n = 7), HCV-infected patients (Tumor: n = 34; Non-tumor: n = 5), and patients with non-alcoholic fatty liver disease (NAFLD, Tumor: n = 11; Non-tumor: n = 2) extracted from TCGA database as described in “Methods.” f Survival analysis for HCC patients with low or high CDKN2C expression (for cohort, see “Methods”). *p < 0.05; **p < 0.01; ***p < 0.001 (b, c: Kruskal–Wallis H test adjusted for multiple comparisons; d, e: two-tailed Mann–Whitney U test). The details of the plots are presented in Supplementary Tables 2 and 3. Source data are provided as a Source Datafile.