Development of an Enzyme-Linked Immunosorbent
Assay (ELISA) with Enhanced Sensitivity in a
Nanofluidic System
MASSACHUSETTS 'Ns
OF TECHNOLOGY
by
SEP 3
0
2009
Lih Feng Cheow
LIBRARIES
B.S. Electrical and Computer Engineering, 2005
Cornell University
Submitted to the Department of Electrical Engineering and Computer
Science in partial fulfillment of the requirements for the degree of
Masters of Science in Electrical Engineering and Computer Science
at the
MASSACHUSETTS INSTITUTE OF TECHNOLOGY
September 2009
ARCHIVES
© Massachusetts Institute of Technology 2009. All rights reserved.
Signature of Author:
Department of Electrical Engineering and Computer Science
June 19, 2009
Certified by:
Jongyoon Han
..
Associate Professor of Electrical Engineering and Computer Science
Thesis Supervisor
Accepted by:
Terry P. Orlando
Professor of Electrical Engineering and Computer Science
Chairman, Committee for Graduate Students
Development of an Enzyme-Linked Immunosorbent Assay
(ELISA) with Enhanced Sensitivity in a Nanofluidic
System
by
Lih Feng Cheow
Submitted to the Department of Electrical Engineering and Computer Science on
June 19, 2009, in partial fulfillment of the
requirements for the degree of
Masters of Science in Electrical Engineering and Computer Science
Abstract
Experimental studies were performed to evaluate the kinetics and
equilibrium binding constants of biomolecules in nanofluidic channels.
Binding events in the nanochannel were detected using electrical and
fluorescence methods. We concluded that antibody-antigen binding
constants in nanochannels were similar to experiments performed in
microtiter plates at low antigen concentrations; however the bound fraction
in nanochannels at high antigen concentration decreased due to steric
hindrance. Binding kinetics in nanochannels was limited by convective
transport of analytes, instead of diffusion or reaction.
We also found that enzymatic reactions in nanochannels were very
effective due to short diffusion length and high surface area to volume ratio.
A bead based ELISA was developed to exploit the rapid binding reactions in
the bulk and efficient enzymatic conversion in the nanochannels.
Additionally, electrokinetic concentrators were integrated with multiplexed
bead based ELISA to further improve the detection sensitivity of a sandwich
immunoassay.
Thesis Supervisor: Jongyoon Han
Acknowledgements
First, I would first like to thank Professor Han for his guidance, support and encouragement throughout the entire thesis process. He is a great advisor and I learnt from him how to do good research.
I would like to thank Reto Schoch for guiding me in the initial phases of my graduate work. Current and past lab members of the Han Lab have been very supportive with my research, and we became good friends. They include Yong-Ak Song, Sung Jae Kim, Pan Mao, Hansen Bow, Aniruddh Sarkar, Leon Li and Vincent Liu. I also enjoyed the company of many exchange students who spent time in our lab. Special thanks to Sung Hee Ko and the staff members at MTL for their help in device fabrication.
Last but not least, I will be forever grateful to my friends and family who supported me all these years. They helped me become what I am today..
This work is possible with the funding support of Agency of Science, Technology and Research (A*STAR) Singapore.
Contents
1.
Introduction
9
2.
Background
11
Equilibrium Binding of Biomolecules in Nanospace
11
Binding Kinetics of Biomolecules in Nanospace
13
Enzymatic Reactions in Nanospace
14
3.
Device Fabrication
15
Glass Device Fabrication
15
Remark: Microchannel Etching
17
Hybrid PDMS-Glass Device Fabrication
17
4.
Electrical Detection of Biomolecule Binding
in Nanochannels
19
Experimental Setup
19
5.
Equilibrium Binding of Biomolecules in
Nanochannels
22
Biomolecule Immobilization in Glass Nanochannel
22
Equilibrium Analysis of Biomolecular Interactions in Glass
Nanochannels
28
Discussion
30
6.
Binding Kinetics of Biomolecules in Nanochannels
32
Microscale Reaction Kinetics in Nanochannel
32
Macroscale Convection-Reaction in Nanochannel
40
Experimental Observation of Binding Kinetics in
Nanochannels
44
7.
Enzymatic Reactions in Nanochannels
47
Trypsin Bioreactor in Nanochannel
47
Horseradish Peroxidase (HRP) in Nanochannel
48
Enzyme Reaction in Microchannel
50
Difficulty of Extracting Enzyme Kinetics in Nanochannel
53
Enzyme Kinetics in Nanochannels Formed by
Self-Assembled Beads
54
8.
Enhancing microELISA Sensitivity by
Electrokinetic Accumulation
56
Bead Based ELISA in Microchannel
57
Nanofluidic Electrokinetic Preconcentration Phenomena 58
Integration of Electrokinetic Concentrator with microELISA 59
Multiplex Microbead ELISA with Integrated Electrokinetic
Concentrator 61
9.
Conclusion
64
Chapter 1
Introduction
Human homeostasis is the body's amazing ability to regulate its inner environment in response to external perturbations. When a person contracts certain diseases, the delicate equilibrium is disturbed, and the body responds by upregulating or downregulating certain proteins to correct the imbalance. Clinically, changes in the concentration of these proteins serve as a marker of disease progression. Hence, the ability to reliably detect minute fluctuations in these biomarker concentrations is extremely important for early diagnosis and treatment of many diseases.
Immunoassay is the most widely used analytical method of measuring the concentration of a substance in a biological liquid. By using the reaction of an antibody to its antigen, it has an extremely high specificity. The basis of Enzyme-Linked ImmunoSorbent Assay (ELISA) is to link the detection antibody to an enzyme, which would convert a colorless substrate into a chromogenic or fluorogenic product over time, hence amplifying the signal. The conventional Sandwich ELISA, as its name suggests, consists of 1) immobilizing capture antibodies on a polystyrene plate, 2) allowing antigens in the sample to bind to the capture antibodies, 3) adding the enzyme conjugated detection antibodies to react with the captured antigens, and 4) adding the substrate and monitoring the product formation over time. Due to the reliability and sensitivity of ELISA, it has been widely used for various disease diagnoses including HIV.
Despite the popularity of ELISA, there are several problems and constraints related to its usage. Firstly, the sample volume requirement is rather large. Each ELISA test in a 96 well plate requires approximately 100L of sample and detection antibodies. In addition, approximately 1mL of reagent is needed to obtain the standard calibration curve for a batch of ELISA test. This is a problem when sample volume is limited and reagents are expensive. Secondly, the time-to-results of ELISA is typically long, ranging from hours to days. This is due to the ineffective mass transfer of reactions on a planar surface. Thirdly, ELISA involves troublesome liquid handling procedures, and skills are required to obtain repeatable results. Automated assay systems used for clinical diagnoses still require large and expensive equipment. Lastly, the sensitivity of ELISA is insufficient to detect certain low abundance biomarkers. The lack of high affinity antibodies for certain biomolecules compromises the sensitivity of ELISA. Improving the binding capacity and efficiency of the ELISA system is one definite way towards better detection.
In this thesis, we propose using a micro/nanofluidic system to perform Sandwich ELISA with the aim of reducing sample consumption, shortening assay time, and most importantly enhancing reaction efficiency and detection sensitivity. While integration of ELISA with microfluidics is not new[7, 8], and has been shown to deliver many of the
above advantages, there are several phenomena unique to nanofluidics that could be exploited.
To identify these phenomena, a thorough investigation of biomolecule interactions in nanochannel is needed. This thesis aims to address the following three objectives. First in the list is to compare biomolecular equilibrium binding constants in nanochannels and in open surface. Second, is to study binding kinetics of biomolecules in nanochannels, and evaluate the roles of convection, diffusion and reaction in determining the binding rates. Third, we want to investigate the efficiency of enzymatic reactions in nanochannels with a constant substrate flow rate. Experimental studies of these three
aspects will form the basis of developing a better nanofluidic ELISA.
This thesis will be organized in the following manner. In Chapter 2, we first provide a concise background of the three objectives and review relevant literature. In Chapter 3, we discuss the device fabrication method used in our experiments. In Chapter 4, we briefly describe the experiments and devices used to electrically detect biomolecule binding in nanochannel. Results from these earlier experiments prompted us to study the binding equilibrium and kinetics binding of biomolecules in nanochannels using fluorescence microscopy, as detailed in Chapter 5 and 6. The optical experiment results were confirmed with computer simulations and used to address Objective 1 and 2. Chapter 7 describes experiments to extract enzyme kinetics in nanochannels and to investigate Objective 3. Finally, in Chapter 8, we report on the integration of electrokinetic concentrator with microELISA to enhance immunoassay sensitivity, using concepts gleaned from experimental studies in the previous chapters. We conclude by summarizing our results and suggest future research directions.
Chapter 2
Background
With the advent of advanced nanofabrication techniques and high resolution detection schemes, it is now possible to directly observe biomolecular interactions in nanospace. These interactions in confined regions are very interesting from both the scientific and engineering points of view. Biologists have come to realize that in vitro experiments were often very different from in vivo reactions, largely due to the crowded microenvironments in cell cytoplasm. Studies of cell-cell interactions also presented some interesting dynamics of nanoscale biomolecular interactions, since the ligands and receptors of neighboring cells associate within the nanogap formed between cell membranes. From an engineering perspective, the remarkable efficiency of nanoscale catalysts such as zeolites has captured much attention. Recently it has been demonstrated that enzymes immobilized on nanoporous material have increased activity and stability.
A systematic characterization of biomolecular interactions in well-defined nanochannels
is valuable for understanding these findings.
Equilibrium Binding of Biomolecules in Nanospace
Recently there has been renewed interest in studying biological reactions in nanospace. This is motivated by the discovery that the cell cytoplasm is a very crowded microenvironment due to the presence of many proteins, biopolymers and structural material such as actin, microtubules and intermediate filament, as shown in Figure 1. The crowding effect resulted in various nanospaces in which protein-protein interaction occurs. Surprisingly, the binding affinity of various proteins and their partners was observed to increase in nanospace compared to a bulk dilute solution. A proposed explanation for this behavior is that biomolecules prefer the bound state to maximize the entropy of the overall system[9].
Figure 1. The crowded state
of the cytoplasm in a
Eukaryotic cell. The square illustrates the face of a cube of
cytoplasm with an edge
Ribosome 100nm in length. The sizes,
Protein
shapes and numbers of
macromolecules are
i t
approximately correct.Microtuate Adapted from DS Goodsell.
itamaent The Machinery of Life,
s Actin Springer-Verlag, New York
fiament (1992)(1992)
Another possibility is due to excluded volume effect, proposed by Ogston in 1970[10]. Biopolymers are sterically hindered from approaching a distance from rigid walls comparable to their own sizes, as shown in Figure 2. In a nanochannel where gap size is comparable to the size of these biomolecules, the effective volume of which the molecule can occupy is significantly reduced. This reduction of available volume has an effect of increasing the apparent concentration/activity of these molecules, leading to higher percentage of binding.
Figure 2. Mutual exclusion of spherical particles and
R. rigid walls. Each dashed
curve indicates the volume within which the center of a sphere may not be placed.
In a microfluidic system setting, David Beebe's group has shown that the binding affinity between Protein A and IgG increase in a nanoporous hydrogel environment[4]. In addition to the entropic contributions in reduced space which favors complex formation over dissociation, they argued that frequency of collision is inversely proportional to the cube of the container size in which the molecules were confined. Therefore the proteins in nanometer sized pores of the hydrogel collide a billion times more often than in a micrometer sized channel, leading to higher equilibrium binding constant. This is illustrated in Figure 3.
Figure 3. The size of the containers reduces as the
L pores become smaller. For
L the same number of
Smolecules, there are more
L2\ collisions as 'L' decreases.
On the other hand, it has been observed that ligand receptor binding between neighboring cells are much stronger than the three dimensional case. This phenomenon has a very strong biological relevance as it is implicated in the identification of self vs. non-self in T cells[l , 12]. A reduction of dimensionality is believed to occur in the nanogap formed between cell-cell adhesions. The initial reaction between the tethered molecules fixed them in the contact area and reduces their diffusivity within the nanogap[13]. Concentration gradient causes the laterally mobile free receptors/ligands to diffuse into the contact area. This clustering effect is responsible for high avidity multiple bindings within the contact area that is responsible for downstream signal amplification. The effective dissociation rate in such two dimensional binding reactions is very low because of the high rebinding probability within the nanogap. Cells have thus evolved to
utilize the high binding affinity in nanogaps to realize exquisite sensitivity and specificity in molecular recognition.
We hypothesize that similar phenomena could occur in a microfabricated nanofluidic channel. Our group has developed the technology to fabricate nanofluidic and microfluidic channels in glass[14]. Briefly, conventional photolithography is used to define an amorphous silicon mask on a Pyrex wafer. By controlling the etch time in a Buffered Oxide Etch, nanochannels and microchannels can be fabricated and sealed via fusion bonding to another piece of pre-drilled Pyrex wafer. This technique allows us to define nanogaps in a rigid, transparent and nonconductive material where optical and electrical measurements of binding events can be made reliable. Compared to gel-like material of random pore sizes in previous studies, nanofabrication gives us precise control over the gap size, channel design, and flow properties for a systematic study of equilibrium binding in nanochannels.
Binding Kinetics of Biomolecules in Nanospace
The study of mass transfer and binding to solid surfaces is a crucial part of development of sensitive on chip protein sensors such as protein arrays, surface plasmon resonance (SPR) or evanescent wave sensors. It has been shown that the commonly used mass transfer models developed for SPR, which assume transport from the bulk through a mass transfer boundary layer at the surface, break down when the channel thickness decreases to the micron size level. In these cases, surface transport of biomolecules becomes limited by the influx of analytes (convection-limited) in the device instead of either by diffusion or reaction rates. In thinner channels, the amount of available surface binding sites per analyte molecule in the bulk becomes larger and incoming sample will be depleted due to the surface binding. As more sample flows over the binding surface, binding sites will saturate, thus allowing the free analytes to propagate further down the channel. Thus the analyte transport occurs from the inlet to the outlet in a wave like fashion[15].
If the same volume of sample is flown through a microchannel and a nanochannel separately, most of the analyte will go through unreacted in the former whereas most analyte will be captured in the latter. However, sample throughput is likely to be much lower in the nanochannel. Taking into account the inherent tradeoff between sample consumption and throughput, device design can be optimized for a particular application.
Besides mass transfer restrictions, other more subtle phenomena could occur in the reduced dimensions of nanogaps. Hydrodynamic interactions between macromolecules and nanochannel walls were known to result in hindered diffusion[16]. It has also been postulated that the low dimensionality in a nanogap could lead to non-fickian diffusion, resulting instead in fractal diffusion relationship[17]. Brownian dynamics simulations have shown that confinement reduces first collision rate but increase recollision rate[ 18]. This would increase reaction with high activation energy but decrease reaction with low activation energy.
Computer simulations can be used to supplement experiments in studying binding reactions in nanochannel. One interesting situation to simulate is the condition of extremely dilute solution in a nanochannel. Extremely dilute solutions may contain too few target molecules to resemble an ensemble average at any given time. For example, a femtomolar solution contains about one target molecule per nanoliter, the average number of target molecule in the nanochannel is less than one. For a fraction of the time, when the target molecule enters the nanochannel, its effective concentration is very high, whereas for the other times, the effective concentration is zero. Such situation violates the conventional view of concentration as an ensemble average. Monte-Carlo and a stochastic matrix based Markov chain will be used to simulate these situations.
Enzymatic Reactions in Nanospace
Enzymes are biomolecules that catalyze chemical reactions by lowering their activation energy. They serve a variety of important functions inside living organisms, including signal transduction, motion generation, active transport, and metabolism. The study of enzyme is fascinating in its own right to elucidate the mechanism of cell regulation. In biotechnology, enzymes are indispensable. They are used everywhere from Polymerase Chain Reaction (PCR), immunoassay, to fermentation.
It has been hypothesized that confining an enzyme molecule into a space of comparable size could limit the surrounding three-dimensional environment available for the enzyme to undergo unfolding, thus provide a mechanism of enzyme stabilization. Covalently bound enzyme in nanoporous silica gel glass showed a half-life 1000 times higher than that of a native enzyme[19]. It has been shown that functionalized mesoporous silica offer potential electrostatic, H bond and hydrophilic interactions with the charged amino acid residues of protein molecules[19]. Appropriately functionalized mesoporous silica provided a much more favorable environment for the enzyme, and exhibit high affinity to sequester proteins from solution[20].
In the field of bioreactors (e.g. for fermentation), immobilized enzyme reactors have gradually replaced the traditional continuous stirred tank reactor. An immobilized enzyme reactor usually consists of a solid phase column on which enzymes are attached. Substrate is passed through one end of the column and enzymatic products are eluted from the other end. The high enzyme binding capacity of these solid phases leads to very efficient substrate conversion. Furthermore, enzymatic products are only present downstream of the reactor and do not suffer dilution from the upstream volume.
These features are very attractive to implement in a nanofluidic ELISA. The extremely short diffusion length and high surface area to volume ratios in nanochannels can rapidly convert a significant percentage of substrate into products to be detected downstream.
Chapter 3
Device Fabrication
In this thesis, devices containing both microchannels and nanochannels are fabricated either in all glass substrate or in hybrid PDMS-Glass substrate. Both glass and PDMS substrates are optically transparent and electrically insulating to enable optical and electrical interrogation. The all glass devices are rigid and can be reused after chemical cleaning (Nanostrip) or thermal regeneration (500'C for 5 hours). PDMS microchannels are fabricated using micromolding technique. Polymeric nanochannels are integrated by injecting Nafion into a groove in the PDMS substrate. Due to the fast turnaround time for PDMS device fabrication, they are suitable for rapid prototyping; however the PDMS devices are one-time-use only.
To study reaction equilibrium and kinetics in nanospaces, the all glass devices are used because of their well-defined nanochannels. Hybrid PDMS-glass devices are used in experiments that require electrokinetic concentration polarization phenomena as Nafion nanojunctions are capable of producing higher ion permselectivity.
Glass Device Fabrication
Glass devices are fabricated at the Microsystems Technology Laboratories (MTL) with the help of its staff members. The fabrication of these devices is modified from those reported in [5]. The table below describes the process flow to fabricate these glass devices.
Starting material: 6" Pyrex wafers, Red process in TRL Step Action Machine Parameters
Pattern nanochannels
1_1 Piranha cleaning Acid-hood 5 min; hydrogen peroxide:sulfuric acid = 1:3
1_2 HMDS coating HMDS 30 min; Prog. 5
1_3 Resist coating Coater OCG 825-34cs; 8 s, 0 krpm; 8 s, 0.75 krpm; 30
s, 2 krpm
1 4 Prebake Prebakeoven 900C, 30 min
1 5 Exposure EV1 Top side alignment, 30 pm proximity, hard
contact, Exposure: 3.5 s
Mask / Substrate thickness: 2.3 mm / 0.5 mm
1_6 Development Photo- 90 s, OCG 934 developer
wet Au
1 7 Postbake Postbakeove 1200C, 30 min
n
1 8 Wet etching Acid-hood BOE (7:1); 24 nm/min
- 75 s: 30 nm; 125 s: 50 nm; 175 s: 70 nm - 100 s: 40 nm; 150 s: 60 nm; 200 s: 80 nm
Pattern
microchannels
2_1 Piranha cleaning Acid-hood 5 min; hydrogen peroxide:sulfuric acid = 1:3
2_2 Dehydration UV-ozone 60 min
2_3 Mask deposition STS-CVD Chamber: oxygen clean CF4 + 02 with
oxystrip.dot, argon clean with arclean.dot Predeposition: asilicon.dot for 15 s
Wafer: asilicon.dot for 1 min 40 s (50 nm)
(deposition rate 5 A/s)
2_4 HMDS coating HMDS 30 min; Prog. 5
2_5 Resist coating Coater OCG 825-34cs; 16 s, 0 krpm; 8 s, 0.75 krpm; 30 s, 2 krpm
2 6 Prebake Prebakeoven 900C, 30 min
2_7 Exposure EV1 Top side alignment, 30 pm proximity, hard
contact, Exposure: 3.5 s
Mask / Substrate thickness: 2.3 mm / 0.5 mm
2_8 Development Photowet Au 75 s, OCG 934 developer
2 9 Postbake Postbake 1200C, 30 min
oven
2_10 Mask etching STS1 SF6_14; RF power (coil) 300; RF power (platen)
120; 10 s
2_11 Pyrex etching Acid-hood Water:hydrofluoric acid:ammonium hydroxide =
650:200:150; 0.8 pm/min; -15 min. Check with
profiler to obtain etch depth of 10 pm
2 12 Resist removal, Acid-hood 10 min; hydrogen peroxide:sulfuric acid = 1:3 Piranha
2_13 Mask stripping STS1 SF6_14; RF power (coil) 300; RF power (platen)
120; 15 s
Bonding
3 1 Drill Wafers CNC Mill Manually drill 500pm thick cover glass wafer to (Sherline make fluidic connections. Instructions in Model 2000) http://www.openwetware.orq/wiki/Modrilla
3_2 Surface cleaning, Acid-hood 10 min; hydrogen peroxide:sulfuric acid = 1:3 Piranha
3 3 Surface activation Acid-hood 30 min, heated ammonium hydroxide
3_4 Glass-glass fusion Box Furnace 550C, overnight
bonding EML
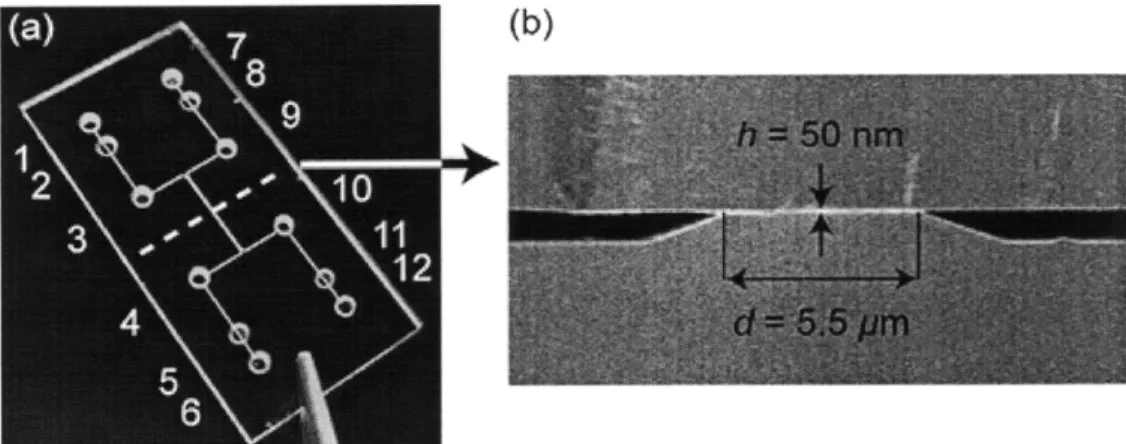
An example of the all-glass device is shown in the Figure 4. Microchannel depth was 850nm and platinum electrodes were integrated into the microchannels to perform electrical interrogation of biomolecule binding in the nanochannel. Holes 1, 6, 7 and 12 provided electrical connections to external measurement units while outlets 3, 4, 9 and 10
provided fluidic access. A drop of epoxy was placed in outlets 2, 5, 8 and 11 to prevent
fluid from entering the electrical connection pads.
Devices used for optical detection of binding events have microchannel depth of
10 Lm to increase sample throughput and facilitate fluid replacement during washing
steps in the experiments. Apart from not having integrated electrodes, the device design was essentially the same as previously described.
(b)
Figure 4. Design of the device, consisting of two microchannels joined by nanochannels. Adapted with permission from [5]. Copyright 2007 American Chemical Society.
Remark: Microchannel Etching
Deep wet etching (-10 pm) of microchannels presented some difficulty initially. The poor adhesion of amorphous silicon mask on the Pyrex substrate resulted in serious undercutting during HF etching, and sometimes led to the amorphous silicon mask lifting off from the Pyrex surface. We found that extensive cleaning of the wafer (using Piranha) and the mask deposition chamber (Argon cleaning) is needed to alleviate this problem. In addition, >1 hour of UV ozone treatment immediately before mask deposition step significantly improved the adhesion strength between the amorphous silicon mask and Pyrex wafer.
DRIE etching of Pyrex was investigated as an alternative to wet etching. We tried several glass etching recipes using the STS etcher in MTL. Unfortunately, the etch rate was too low to be useful due to insufficient RF power. We note that a better process flow can be realized if Pyrex dry etching capabilities are available in future since is more resistant to mask undercutting and produces vertical sidewalls instead of isotropic etch profile seen in wet etching.
Finally, we observed a lateral: vertical etch ratio of -1-1.2 during isotropic deep wet etching of glass. This should be taken into account during the mask design by allowing room for channel expansion due to undercutting.
Hybrid PDMS-Glass Device Fabrication
The fabrication details of these devices are detailed elsewhere[21]. Briefly, silicon masters are dry etched to form molds for PDMS molding process. The following is a process flow for fabrication of the silicon masters.
Process Step Machine
1 Piranha clean Wet hood
3 Exposure EVI
4 Develop PhotoWet Au
5 DRIE etch STS 2
6 Strip photoresist Asher
The silicon master is silanized for 1 hour under vacuum to facilitate mold detachment. PDMS is prepared by mixing 10:1 w/w base to curing agent and degassing under vacuum for at least 1 hour. The degassed mixture is poured onto the silicon master and cured in a 65'C over overnight. Cured PDMS is peeled from the master and holes are punched using 1.5mm round Biopsy to form fluidic connection.
A self sealing vertical Nafion junction is formed in the PDMS device using a previously reported method[3]. In this method, a thin cut is made into the PDMS piece using a razor blade. The PDMS piece is prebaked at 95oC for 5 minutes followed by injection of 1 p.L 5% Nafion into the groove using a pipette. After another 5 minutes prebake step at 95C on a hotplate, excess cured Nafion is removed from the PDMS surface using Scotch Tape. This method is illustrated in Figure 5.
To bond PDMS to glass slide, they are both treated in oxygen plasma for 1 minute and placed together[21]. A strong bond forms instantaneously. Annealing on a hotplate at 95°C for >1 hour significantly increase the bond strength. Before performing experiments on hybrid PDMS-glass devices, the dry microchannels are hydrophilized by passing corona discharge through wires inserted into the reservoirs[22]. This step is necessary to ease channel filling, reduce bubble formation, and increase electroosmotic flow in the device.
(a) (b)
PDMS mcrochannels Mechanical cutting
across mnrcchannes
Send and drop a nanoporous
material soluhon on the dge
Plasma bonding Cure at 95C and remove
resdual on PDMS suface
Figure 5. Schematic of fabrication process of self-sealing vertical Nafion junction in PDMS. Adapted with permission from [3]. Copyright 2008 American Chemical Society.
Chapter 4
Electrical Detection of Biomolecule Binding in
Nanochannels
In this chapter we will briefly discuss describe the experiments and devices used to electrically detect biomolecule binding in nanochannel. Further details of the experiments and results are described in [5]. We have observed some interesting phenomena from these earlier experiments prompted us to study the kinetics and equilibrium binding of biomolecules in nanochannels using fluorescence microscopy.
Experimental Setup
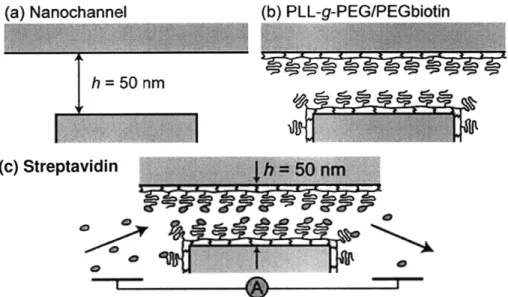
The Pyrex device described in chapter 3 is used to perform these experiments. For electrical detection of immobilized proteins in nanochannels, streptavidin-biotin was chosen as the model ligand-receptor pair. To perform such bindings in nanochannels, surfaces were precoated with commercially available PLL-g-PEG-biotin[23]. After flushing out the excess polymer, streptavidin is injected into the nanochannel for binding. Impedance spectroscopy is performed across the nanochannel to detect the change in conductance during the experiment.
(a) Nanochannel (b) PLL-g-PEGIPEGbiotin
h 50 nm
(c) Streptavidin . ..
50
Figure 6. Sequential surface modifications for streptavidin sensing. Impedance
spectroscopy is performed across the nanochannel. Adapted with permission from [5]. Copyright 2007 American Chemical Society.
Streptavidin has a net charge of -2e at pH 7.4, therefore streptavidin binding in a nanochannel results in more negative surface charge. At low ionic strength (10mM HEPES buffer), the nanochannel conductance is dominated by surface charge density. Thus one would expect higher nanochannel conductance after streptavidin binding.
~i--Indeed, experimental results have shown that nanochannel conductance increased when it is incubated with streptavidin solution. The response time decreased when the flow velocity through the nanochannel increase. Without convection, streptavidin concentrations below 0.4jiM cannot be measured because binding equilibrium has not been reached after 1 hour of incubation. However, at high flow velocities InM of streptavidin achieved binding equilibrium in the nanochannel and can be detected electrically after 1 hour.
--- 22.9 ms pressure.drivenR flow
. 3.1 rmwns, presw e-driven fow
-+- 04 mnVs. pressre-en flow
- 0.4 O mm/s. eleto-r noc flow
-0... Control (resure). 3.1 mms 0, 5 0.12 c 0,25 0.20-0. - 0.08-0.10 11 1E-10 -6 1E-5 0 2 4 6 10 12
o.oo Figure 8. Reaction kinetics i0.02
IE-11 IE-10 IE-9 1E-8 IE-7 15 1E-5 0 2 4 5 a 10 12
Streptpvidln concentration (M) i nM streptavidn flow time (h)
Figure 7. a) Normalized conductance change in the nanochannel as a function of
streptavidin concentration after 1 hour of incubation, b) Normalized conductance change in nanochannel as a function of flow time at InM streptavidin concentration. Control
measurement was made with InM streptavidin solution and a protein resistant nanochannel coating. Adapted with permission from [5]. Copyright 2007 American Chemical Society.
M 0.20 1 Figure 8. Reaction kinetics in
0.15Streptavidin flow time (h)flow, measured by normalized Several interesting features are worth noticing in these results. First, it is obviousthat binding kinetics is enhanced when convection is iconductance change versus
reaction fronstreptavidin concentrations. The
0.05--- I iPM flow velocity of 3.1mm/s is equal
(9 / - InM for all measurements. Adapted
0_ _ _ _ _ with permission from [5].
0
2 4 16 a 10 12 Copyright 2007 AmericanStreptavidin flow time (h) Chemical Society.
Several interesting features are worth noticing in these results. First, it is obvious that binding kinetics is enhanced when convection is introduced across the nanochannel. Theoretical studies have predicted that binding kinetics is convection limited[15] and the reaction front proceeds as a linear wave-like propagation. However, the electrical measurement cannot tell us the spatial binding pattern within the nanochannel. Fluorescence detection of labeled streptavidin binding in the nanochannel can give us detailed information about the position and the intensity of the binding front, thus allowing us to better understand the binding kinetics in nanochannel with an induced flow.
Secondly, experimental results showed that the saturation signal changes with analyte concentration and equilibrium is reached after equal times of -2 hours. This is unexpected from a kinetics point of view: saturation should have occurred much faster at higher analyte concentration. Furthermore, the final amount of streptavidin bound at equilibrium should be very similar, since the concentrations used are much higher than the dissociation constant of biotin-streptavidin bonds (40fM). We have previously attributed this to shear induced bond cleavage under strong flow[5]. A detailed investigation fluorescence measurement should provide us with a better understanding of binding equilibrium in the nanochannel.
Chapter
5
Equilibrium
Binding
of
Biomolecules
in
Nanochannels
Results from the Chapter 4 have shown that binding events in the nanochannel can be measured electrically, and that convective flow significantly alters the binding kinetics of biomolecules in the nanochannel. Despite the advantage of being label free, there are several shortcomings in using electrical methods to measure binding equilibrium and kinetics in nanochannel. First is the lack of calibration and linearity. The change in nanochannel conductance is due to the increase in surface charge density as the negatively charged streptavidin binds. However, the percentage conductance change is very sensitive to the initial native surface charge density and the ionic environment in the nanochannel, and these factors are very difficult to measure and control during an experiment. The conductance change in nanochannel can be used as a qualitative measure of biomolecular binding, but a quantitative relationship has not been established. Secondly, electrical measurement cannot provide any spatial resolution of biomolecular binding in the nanochannel. We do not know whether binding events happen at the nanochannel entrance, or uniformly within the entire nanochannel. Finally, electrical measurements have limited sensitivity. The limit of electrical detection of streptavidin-biotin binding is InM, almost 5 orders of magnitude above the dissociation constant of this complex. Furthermore, electrical measurement cannot distinguish between
streptavidin binding and nonspecific binding of other molecules in the nanochannel. These problems can be solved by adopting an optical measurement scheme. The transparent glass devices allow measurement of fluorescent biomolecules in the nanochannel. Fluorescence intensity is linear with respect to the amount of tagged biomolecules. The intensity distribution of fluorescence signal indicates the spatial binding patterns in the device. As we will show later, sensitive optical detection allow us to detect equilibrium binding at concentrations lower than the dissociation constants of antibody-antigen complex. This is essential in order to obtain an equilibrium binding curve within the nanochannel.
Biomolecule Immobilization in Glass Nanochannel
In order to study binding reactions in nanochannel, the capture molecules must first be immobilized in the glass nanochannel. In this section, we describe several immobilization schemes that we developed to achieve this purpose.
The starting point is using electrostatic adsorption of PLL-g-PEG-Biotin to immobilize biotin in the nanochannels, as described in the previous chapter. We first deposited PLL-g-PEG-Biotin throughout the device, rinse with buffer solution, and then
flowed in AlexaFluor 488 tagged streptavidin molecules from one side of the microchannel, similar to the procedure described in the Chapter 4. In this experiment, we observed significant fluorescence intensity in the inlet microchannel, much more than the nanochannel. Based on this observation, we realized that many streptavidin molecules bind to biotin in the microchannel, even before they reach the nanochannel. At low concentrations of target molecules, they could be significantly depleted in the microchannel, leading to the low detection sensitivity shown in the Chapter 4.
We developed an immobilization scheme to saturate the nanochannel with capture molecules but eliminate them in the inlet microchannel. This scheme utilizes a flow patterning method as shown in Figure 9. We flow the capture molecules into the top microchannel at 3g±L/min and flow a passivation molecules into the bottom microchannel at 2L/min. Due to the higher flow rate at the top compared to the bottom microchannel, capture molecules flow through the nanochannel and is electrostatically adsorbed. Only a very small amount of the capture molecules enters the bottom microchannel from the nanochannel, but they are prevented from adsorption to the surface by the passivation molecules. Moreover, the tiny amount of capture molecules quickly diffuses into a large volume in the bottom channel, further reducing their ability to adsorb to glass surface. After rinsing both channels with buffer solution, the target molecule is introduced from the bottom channel. Since capture molecules were only deposited in the nanochannel and top channel, target molecules were not depleted in the bottom channel and only bind in the nanochannel. 3 ul/min (b) Capture molecule Nanochannel Binint Passivation molecule molecule
Figure 9. Flow patterning scheme to prevent target molecule depletion in inlet microchannel. a) Capture molecule is immobilized in nanochannel and top microchannel, b) target molecules bind to capture molecules in nanochannel.
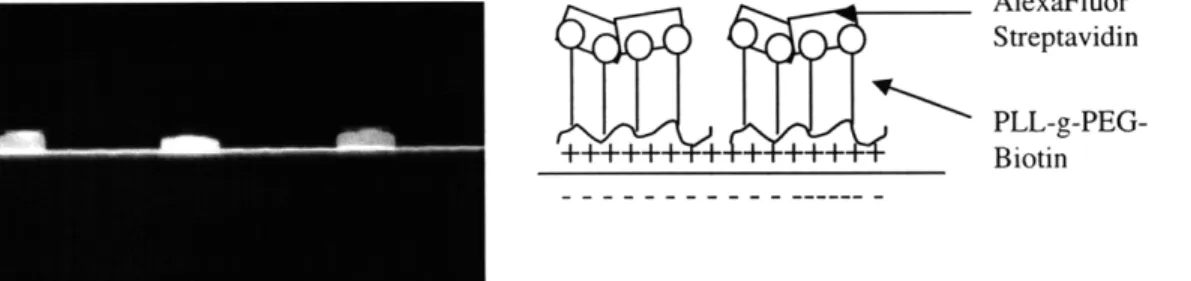
We tested this approach using PEG-biotin as the capture molecule,
PLL-g-PEG as the passivation molecule, and AlexaFluor 488 labeled streptavidin as the target
molecule. Figure 10 shows that the target molecules only bind in the nanochannel.
AlexaFluor Streptavidin
PLL-g-PEG-++++++ + + +++ Biotin
Figure 10. a) Fluorescent streptavidin binding to PLL-g-PEG-biotin in nanochannel, b) schematic of immobilization scheme
Although this scheme works, it is not ideal for studying binding kinetics and equilibrium for the following reasons: First, the dissociation constant for biotin-streptavidin binding is in the femtomolar regime. If we want to study binding reaction for target concentration below the dissociation constant, it will take excessively long time for sufficient amount of target molecules to be transported across the nanochannel. Secondly, streptavidin is a tetramer with four binding sites for biotin. It can be captured by multiple biotin molecules leading to high avidity and masking the intrinsic binding constants. Lastly, this scheme lacks generality because it only works for biotin-streptavidin binding and cannot be extended to other molecules that we might be interested to study.
In order to extend this system to study antibody-antigen binding, we tried out the following system in the nanochannel. PLL-g-PEG-Biotin is first electrostatically adsorbed in the nanochannel, and is used to capture streptavidin molecules. Following that, the streptavidin molecules are used to capture biotinylated anti-R-Phycoerythrin (RPE). Using this scheme, we hoped to study the binding reaction between RPE and its antibody in the nanochannel. Figure 11 below illustrates this concept.
RPE
iotin-antiRPE Figure 11. Schematic of the first
.trep immobilization scheme used to
jtptLL-g-PEG study antibody-antigen binding in
Biotin nanochannel.
+++++++++++++
When we performed the actual experiments, we did not observe binding of any fluorescent RPE molecules in the nanochannel. This could be due to two reasons: First, the biotinylated anti-RPE did not bind to streptavidin. Second, anti-RPE bound to streptavidin but RPE did not bind to anti-RPE in the nanochannel. To investigate the first possibility we captured FITC-biotin molecules using the (PLL-g-PEG-biotin)-(TRITC avidin) stack in a 96 well plate. The result of this experiment is illustrated in Figure 12.
800(b)
(a) (b)
700
600 TRITC avidin FITC biotin
500-STRITC Filter m FITC Filter 300 200 100 +++++++++++++ nonspecific PEG PPB10 PPB50 m TRITC Filter 246 112 334 662 m FITC Filter 189 165 480 676
Figure 12. a) Comparison of binding efficiency with different immobilization scheme in a 96 well plate. Blue and red bars indicate binding efficiency of TRITC-avidin FITC-biotin respectively, b) Schematic of immobilization scheme.
We tried two formulations of 50% PEG-biotin (PPB50) and 10% PLL-g-PEG-biotin (PPB10) in this experiment. Results indicate that both PPB10 and PPB50 showed stronger specific binding than the control experiment. On the other hand, PLL-g-PEG effectively prevents nonspecific binding. PPB50 has a higher biotin density than PPB10, thus it is able to capture more avidin molecules creating more binding sites for FITC-biotin. By monitoring the relative density of TRITC-Avidin and FITC-Biotin molecules in the nanochannel, we observed that less FITC-Biotin molecule binds per avidin molecule when PPB50 was used. This is attributed to the biotin in PPB50 competing with FITC-Biotin for the same binding avidin binding sites. The reason for no RPE binding in the nanochannel is probably due to steric hindrance. A simple calculation revealed that the combined size of the complex in the nanochannel is -58nm, which exceeded the nanochannel height of 50nm.
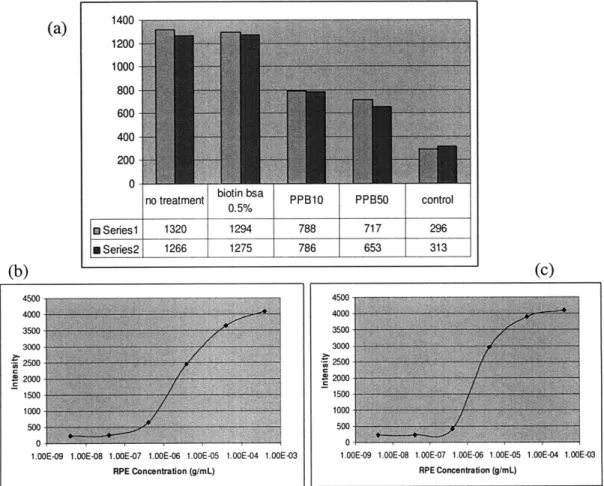
To reduce steric hindrance and eliminate competition effects of long-armed biotin linkers in PLL-g-PEG-Biotin, we replaced the first layer with the smaller biotinylated-BSA, as shown in Figure 13.
1400-(a) 00 1200 1000 -800 600 400 200 -
0-no treatment biotin bsa PPB10 PPB50 control
0.5% t Series 1 1320 1294 788 717 296 a Series2 1266 1275 786 653 313 (b) (c) 4500 4500 4000 4000 3500 3500 3000 3000-2500 2so S2000 2000-1500 1500 1000 1000 5Wo 500. 0 0i
1.00E-09 1.00E-08 1.00E-07 1.00E-06 1.00E-05 1,00E-04 1.00E-03 1.00E-09 1.00E-08 1.00E-07 1.00E-06 1.00E-05 1.00E-04 1.00E-03
RPE Concentration (g/mL) RPE Concentration (g/mL)
Figure 13. a) Comparison of binding efficiency using different molecules as the first layer in a 96 well plate, no treatment means neutravidin is directly adsorbed as the first layer, b) dose response curve of RPE binding using biotin-BSA as the first
layer, c) dose response curve of RPE binding using neutravidin as the first layer
--The (biotin-BSA)-(neutravidin)-(biotin-antiRPE) stack is able to capture more RPE molecules compared to PPB10 an PPB50, probably because the biotin on spherical BSA lack flexibility and cannot compete with biotin-antiRPE for binding sites on neutravidin. Surprisingly, good RPE binding can be obtained when neutravidin is directly adsorbed onto 96 well plate surfaces. The dose response curve for RPE binding equilibrium in 96 well plates is similar whether or not biotin-BSA is immobilized as the first layer.
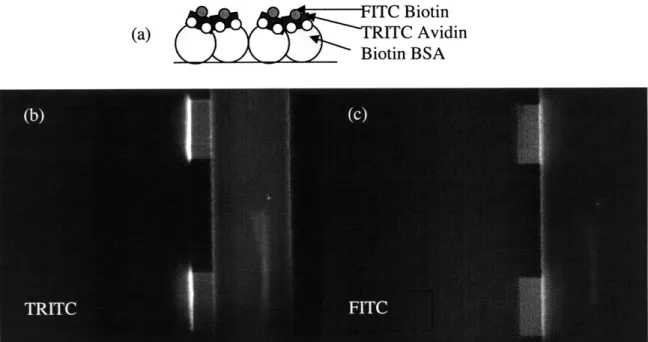
When we used (biotin-BSA)-(Neutravidin)-(biotin-antiRPE) to capture RPE in the nanochannels, we again observed no binding reaction. Binding reaction was observed when (biotin-BSA)-(TRITC-Avidin) is used to capture FITC-Biotin, as shown in the figure below. This observation led us to conclude that despite replacing PLL-g-PEG-Biotin with BSA, steric hindrance is still preventing the binding of the large biotin-antiRPE and RPE molecules in the nanochannel.
ITC Biotin
(a) RITC Avidin
Biotin BSA
Figure 14. a) Immobilization scheme in the nanochannel, b) binding of TRITC-avidin
in nanochannel, c) subsequent binding of FITC-biotin in nanochannel.
In the previous experiment, we have observed that a (neutravidin)-(antiRPE) stack can effectively capture RPE molecules in a 96 well plate. When we tried this system in the nanochannel, we still did not observe any RPE binding although the complex size is -40nm, less than the nanochannel height. RPE was observed to pass through the nanochannel into the opposite microchannel without binding. Our conclusion for this series of experiments is that binding events require extra space to maneuver in the nanochannel, and steric hindrance presented a major difficulty in studying binding events in confined spaces.
The other alternative to study antibody-antigen binding in nanochannel is to directly immobilize antibodies on glass. This method has not been considered as a first
Q-choice as direct immobilization often reduces the activity of antibody. Furthermore, a high concentration of antibody is needed for direct immobilization, resulting in high reagent cost. Four protein pairs with high dissociation constants were investigated. They are illustrated in Figure 15 below.
++++++-Cy2-antiBiotin FITC-Biotin FITC-IgG RPE
PLL-PEG-Biotin Captavidin Protein A Anti-RPE
A B C D
Figure 15. Four model protein pairs to study direct immobilization of capture molecule on glass nanochannel and subsequent binding of target molecules.
A. Cy2-antiBiotin binding to PLL-g-PEG-Biotin
antiBiotin has a much higher
dissociation constant (nM) compared to Streptavidin or Avidin (fM). Therefore, it is possible to study binding equilibrium in nanochannel within a reasonable amount of time.
However, antiBiotin is bivalent. Each antiBiotin molecule can bind two biotin molecules, and the antigen-antibody bonds can be broken only if both binding regions dissociate. This avidity effect could mask the true binding constants.
B. FITC-Biotin binding to Captavidin
Captavidin is modified Avidin that has lower binding at higher pH. However, FITC-Biotin fluorescent signal is quenched significantly when it binds to Captavidin. Furthermore, increasing the dissociation constant by increasing pH lowers the FITC fluorescence dramatically.
C. FITC-IgG binding to Protein A
Protein A is a bacterial surface protein that binds the Fc region of immunoglobulin to help the bacteria evade immune system detection. This is an example of receptor-ligand interaction. Experiments in the nanochannel yielded good results.
D. RPE binding to physically adsorbed antiRPE
RPE is a natural red fluorescent protein that can be detected without any labeling steps. Anti-RPE is physically adsorbed
onto glass nanochannel at high
concentrations. Direct adsorption can cause antibodies to loose some activity because they are not oriented properly. Nevertheless, detection sensitivity is sufficient to obtain an equilibrium binding curve of this antibody-antigen reaction in the nanochannel.
Equilibrium
Nanochannel
Analysis of Biomolecular Interactions in Glass
Based on our previous findings, we decided to study the interaction pairs in the nanochannel. The first pair is FITC-IgG binding to Protein A, of receptor ligand interactions. The second pair is RPE binding representative of antibody-antigen interactions.
of two protein representative to anti-RPE,
Equilibrium Analysis of FITC-IgG binding to Protein A in Nanochannel
We directly adsorbed Protein A in the nanochannel using the method described in the Biomolecule Immobilization section. lmg/mL Protein A coating solution was applied for 30 minutes, followed by flushing with lxPBS to remove excess Protein A. FITC-IgG
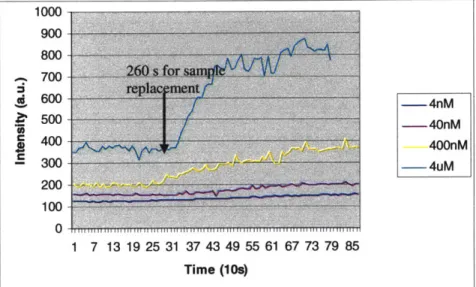
was applied from the other inlet channel at a flow rate of 5gL/min. This corresponds to approximately 10flJs flow rate in the nanochannel. Figure 16 shows the intensity versus time plot as different concentrations of FITC-IgG were injected into the channel. One advantage of optical detection in nanochannel is that fluorescence of surface bound molecules overwhelms fluorescence in the bulk solution, due to the high surface to volume ratio. We confirmed this by observing that fluorescence intensity in the nanochannel changed very little before and after washing with buffer solution. For all intents and purposes, fluorescence intensity in the nanochannel represents real time binding reaction. 1000 900 800 - -A 700 S600 -4nM S500 40nM S400 400nM - 300 -4uM 200 100 1 7 13 19 25 31 37 43 49 55 61 67 73 79 85 Time (10s)
Figure 16. Intensity versus time plot when different concentrations of FITC-IgG were
injected into the Protein A functionalized nanochannels.
Figure 17 shows a plot of the dose response curve for FITC-IgG binding to Protein A in nanochannels. Data is normalized and fitted to a Hill Equation which describes equilibrium binding. From the best fit curve, we calculated an equilibrium binding constant of -200nM. This is consistent with values published in other literature. Unlike antibodies which can have different affinity from lot to lot, we expect the affinity of Protein A to the Fc (constant region) of IgG (receptor-ligand pair) to be comparable across experiments. This justifies the comparison with reported binding constants.
Figure 17. Dose , response curve of FITC-IgG binding to Protein A in nanochannels. Data is fitted to a Hill Equation. The calculated binding
Qi 1 10 100 1000 10000 100000 constant is 200nM
mRA;lgG
cncereation
(nEquilibrium Analysis of RPE binding to anti-RPE in Nanochannel
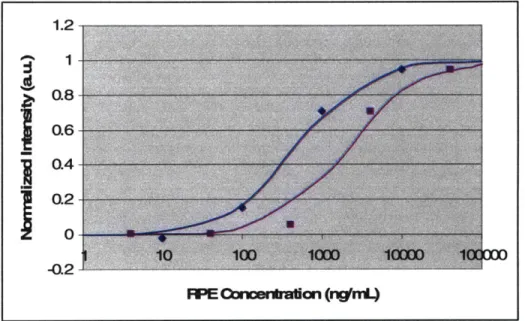
To study antibody-antigen binding interaction in nanochannel, we immobilized anti-RPE in nanochannel through physical adsorption. Fluorescent RPE molecules were then injected into the channel to monitor binding reactions. We experimentally found that RPE is prone to photobleaching even when illuminated for short intervals using an electronic shutter. This prevents us from continuously monitoring the binding process. Instead, we measured the fluorescence intensity in the nanochannel at a fixed time, after equilibrium has been achieved. Due to lot-to-lot variation in antibody affinity, we compared the normalized dose response curve for RPE binding in nanochannel with results in 96 well plates using the same antibody reagent. The results are shown in Figure
18. 1.2 1 O.6 O.2 0 -Q2
FME cron eataon (ngfml)
Figure 18. Dose response curve of RPE binding to anti-RPE in nanochannel (blue
curve) and in 96 well plates (red curve). The binding curves are fitted to Hill Equation to yield dissociation constant value of 500ng/mL for reaction in nanochannel and 2ug/mL for reaction in 96 well plates.
The dose response curves are fitted using the Hill Equation assuming no cooperativity. From the curve fitting parameters, we obtained a KD value of 500ng/mL for reaction in nanochannels and 2ug/mL for reaction in 96 well plates.
Discussion
Experimental results showed that dissociation constant values for antiRPE-RPE binding are lowered by a factor of 4 in the nanochannels compared to open surface. However, there is no measurable change in dissociation constant value for Protein A-IgG binding under similar experimental conditions.
One possible explanation for this observation is that Protein A + IgG complex (-50kDa + 150kDa) is much smaller than the antiRPE + RPE complex (-160kDa + 240kDa). Therefore, crowding effect in the first case is less significant. The phenomena of lowered dissociation constant in confined environment have been observed in polymer solution and hydrogel. This is the first time such phenomenon is directly observed in well-defined nanochannels.
We considered an alternative hypothesis to explain the observed decrease in dissociation constant. As we have described earlier, steric hindrance prevents biomolecular binding interactions when the complex size approaches the nanochannel height. It might be possible that large complex formation in nanochannels is prevented when RPE concentration is high, thus lowering the maximum fluorescence signals intensity in the nanochannel. This would artificially lower the dissociation constant, defined as the concentration where total binding is at half the maximum. Another possibility is shear forces in the nanochannel at high flow rates might induce bond breaking, leading to inaccurate determination of the intrinsic binding constant[24, 25]. Currently, we still have not been able to determine whether the dissociation constant of RPE in nanochannel is decreased due to crowding effects or steric hindrance/shear effects.
Finally, we consider the possibility of an increase in effective concentration due to excluded volume effect. Anti-RPE is a -150kDa molecule with dimensions of -15nm
while RPE has dimensions of -10nm. Due to steric hindrance the effective volume that the target molecule can occupy is decreased, leading to an increase in apparent concentration as shown in Figure 19. The effective volume decreased 5-folds in a 50nm
nanochannel, which implies a 5-folds increase in effective RPE concentration in the nanochannel. This is consistent with the experimental observation that the dissociation constant decreased 4 times in a nanochannel compared with bulk measurement.
Figure 19. Schematic showing excluded
151un'
7
volume effect on immunobinding inA
\ nanochannel. Due to the large size of the ,5un .. ... antigens, they are excluded from a 20nm 50lun RPE 0 I u Sllspace adjacent to nanochannel walls. RPE Solvent molecules, on the other hand, can occupy the entire volume in theAi -Rnanochannel. Theoretical calculations
-ti-RPE _show that the effective RPE
concentration is 5 times higher in the
nanochannel.
-Chapter 6
Binding Kinetics of Biomolecules in Nanochannels
In this chapter we will study the kinetics of biomolecule interaction in nanochannels. Kinetics study of low concentration biomolecular interactions in nanochannel is interesting because there are only a few reactants present in the nanochannel at any time. For example, at InM concentration, only 1 molecule is present in a 1 tm x 1ltm x 1ilm volume. Under these circumstances, the ensemble average assumption breaks down. To study reaction kinetics under confinement, we need to study discrete and stochastic molecular events.
We investigate two hypotheses about microscale reaction kinetics in nanochannels. First, reaction rate in nanochannel is higher because there the free ligands make more collisions with the wall bound receptors. More collisions may lead to higher association rate, but have no effect on the dissociation rate. The first hypothesis is similar to that proposed in [4] where they claimed that number of collisions increases as the 'container' size decreases. Second, we will investigate the feasibility of 'Coulter Counting' mode in the nanochannel. In the Coulter Counting mode, the average number of molecules within the nanochannel is less than one at any one time. However, the instantaneous concentration within the nanochannel is very high during the brief duration that a molecule passes through the nanochannel, due to the small volume. We are interested in investigating whether such discrete events can modify reaction kinetics. Monte-Carlo and stochastic Markov chain matrix simulations were performed to verify the above hypotheses.
Next, we will proceed to study how macroscale mass transport affects the spatial distribution of binding reactions within a nanochannel. Recently it has been proposed that bulk concentration front propagates in a wave-like fashion throughout a thin microfluidic channel [15]. Numerical analysis and experiments will be performed to investigate the effect of convective transport on kinetics of surface reactions in nanochannel.
Microscale Reaction Kinetics in Nanochannel
Hypothesis 1: Reaction Rate in nanochannel is higher due to more
frequent collisions between free ligands and surface bound receptors
A. Monte Carlo Simulation
In the collision theory of reaction rates, two particles must collide for a reaction to occur. Therefore, reaction rate is proportional to collision frequency. As device dimensions shrinks, there are more collision between a free ligand molecule and the wall-bound receptor. This high collision frequency may lead to higher association rate but
have no effect on the dissociation rate. Therefore, both reaction rate and equilibrium binding constant could increase in the nanochannel.
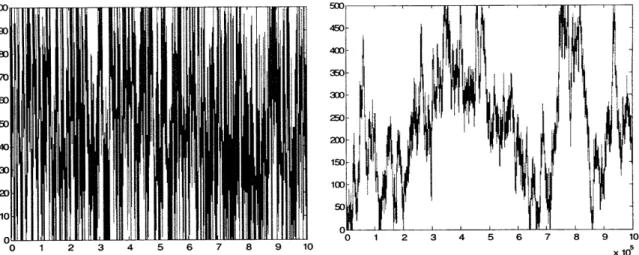
We performed Monte-Carlo simulation to obtain the number of times that a molecule entering a nanochannel collides with the wall. Figure 20 provides an example of one such instance. It is clear that a ligand in a nanochannel collides with receptors on the walls much more frequently than a ligand in a microchannel.
30 50,
90
300
-0 0 1 2 3 4 5 6 7 8 9 10
0 1 2 3 4 5 6 7 8 9 10 x 105
Figure 20. Monte Carlo simulation of the trajectory of a target molecule going through a) a nanochannel, b) a microchannel. The target molecule collides with receptors on the walls much more frequently in the nanochannel than in the microchannel.
However, the above simulation does not take into account there are more ligand molecules in the microchannel for the same concentration. To compare the total number of collisions in both cases for the same concentration, we simulate the following conditions:
Case 1: Nanochannel Height = 100 unit
Number of ligands = 1 Ligand initial position = 50 Time step = 107
Total number of collisions = 51662 Case 2: Nanochannel Height = 1000 unit
Number of ligands = 10
Time step = 107
Ligand initial position Number of collisions
50 4515 150 5429 250 4288 350 6255 450 4239 550 5366
650 3126
750 7771
870 1443
950 4990
Total number of collisions = 47422
As can be seen from the results, the total number of collisions is the same within margins of errors regardless of the channel height.
In doing the above simulation I have used the following assumptions:
ID Diffusion <x2>=2Dt
Set Diffusion Coefficient D=62/z= 1/2
Time to diffuse through nanochannel tdiff=<X 2
>
When h=100, tdiff104 When h=1000, tdiff=106
I have used 107 time steps to ensure that steady state has been achieved.
The diffusion coefficient, step size, time step and nanochannel height in the above example has arbitrary units. In order to put in some physiologically relevant numbers, we consider the following:
For a 15kDa protein such as Lysozyme, the mass is m=2.3X10⁻²³ g
The value of kT at 300K is 4.14X10 -14 g/cm2/s2
The measured diffusion coefficient of this molecule D is 10-6 cm2/s
From Thermodynamics, <v2> 1/2=(kT/m)1/2=1 .3X103 cm/s
v= 6/= 103 cm/s
D= 82/U= 10-6 cm2/S
The step size (mean free path) 6=2D/v=10-9 cm Time step z = 6/v=10-12 S
Therefore the above simulation exactly describes ID diffusion of protein in channel heights of h= 1006 (Inm) and h= 10008 (10nm) for duration of t=107T (10 ts)
Monte Carlo simulations make use of a random walk generated by the program. Each simulation represents one possible realization of the actual experiment. To obtain an accurate binding kinetics, many such realizations needed to be performed and averaged. Furthermore, Monte Carlo simulations are time consuming if we need to track more than one particle, as is always the case in real experiments. For this, we introduce a stochastic matrix based Markov Chain simulation.
B. Markov Chain Simulation
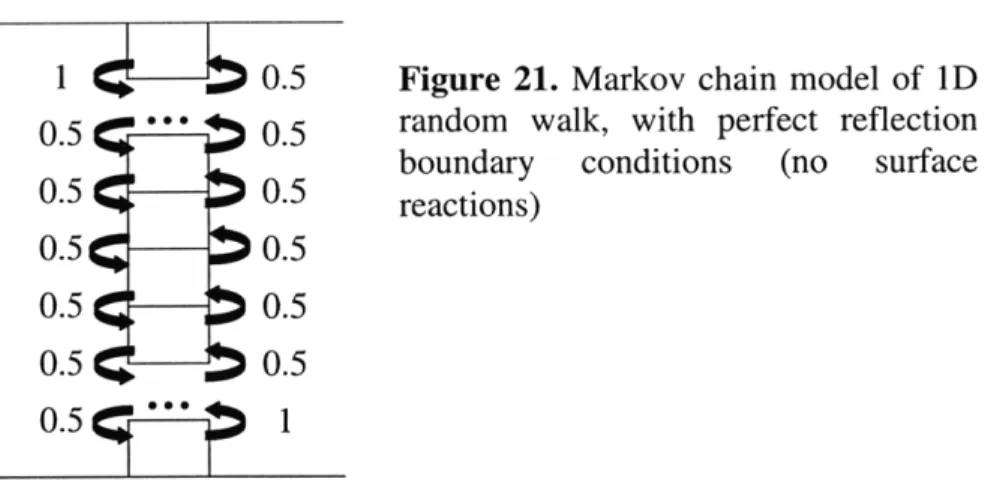
First we will introduce the model without any surface reaction. Based on a 1D random walk model, a molecule at position k has equal probability (0.5) of going to position k-6 or k+6 in a time step i. At the wall boundaries (k=O and k=h) the molecule is reflected with probability 1. This is illustrated in the Figure 21.
5 5 5 5 5 5
We can describe this situation with the following position vo, assuming uniform initial distribution:
0o 0.5 0 0 0 0 0 0 1 0 0.5 0 0 0 0 0 0 0.5 0 0.5 0 0 0 0 0 0 0.5 o 0.5 o 0 0 o 0 0 0.5 o 0.5 o 0 o 0 0 0 0.5 o 0.5 o
o
o
0 0 0 0.5 0 1 o o o o o o 0.5 o To find matrix A to the the particle power of Tdistribution after T time with the initial vector vo:
Figure 21. Markov chain model of 1D
random walk, with perfect reflection boundary conditions (no surface reactions)
transition matrix A and initial
steps, we multiply the transition
VT= A Tv. Matrix manipulation is
extremely efficient in programs such as Matlab, thus we can simulate for more complex situations. For a perfectly reflecting wall with no surface reaction, the final concentration distribution is uniform if initial concentration is uniform regardless of device height. The lack of concentration gradient in the final concentration indicates that there is no increase in collision frequency in nanochannels.
The matrix manipulation method allows us to add finite reaction rate at the nanochannel surface. We simulated the case where the top surface is perfectly reflecting and bottom surface has a finite reaction rate k,,o and koff. The transition matrix becomes:
0o 0.5 o 0 0 0 0 1 0 0.5 0 0 0 0 0 0 0.5 o0 0.5 0 0 0 0 0 0 0.5 0 0.5 0 0 0 0 0 0 0.5 o 0.5 o 0 0 0 0 0 0.5 o0 0.5 0 0 0 0 0 0 0.5 0.5(1-kon ) koff o 0 0 0 0 0 0.5kon 1-koff